

Abstract
Introduction
Natural experiments are considered a priority for examining causal associations between the built environment (BE) and physical activity (PA) because the randomised controlled trial design is rarely feasible. Few natural experiments have examined the effects of walking and cycling infrastructure on PA and active transport in adults, and none have examined the effects of such changes on PA and active transport to school among adolescents. We conducted the Built Environment and Active Transport to School (BEATS) Study in Dunedin city, New Zealand, in 2014–2017. Since 2014, on-road and off-road cycling infrastructure construction has occurred in some Dunedin neighbourhoods, including the neighbourhoods of 6 out of 12 secondary schools. Pedestrian-related infrastructure changes began in 2018. As an extension of the BEATS Study, the BEATS Natural Experiment (BEATS-NE) (2019–2022) will examine the effects of BE changes on adolescents’ active transport to school in Dunedin, New Zealand.
Methods and analysis
The BEATS-NE Study will employ contemporary ecological models for active transport that account for individual, social, environmental and policy factors. The published BEATS Study methodology (surveys, accelerometers, mapping, Geographic Information Science analysis and focus groups) and novel methods (environmental scan of school neighbourhoods and participatory mapping) will be used. A core component continues to be the community-based participatory approach with the sustained involvement of key stakeholders to generate locally relevant data, and facilitate knowledge translation into evidence-based policy and planning.
Ethics and dissemination
The BEATS-NE Study has been approved by the University of Otago Ethics Committee (reference: 17/188). The results will be disseminated through scientific publications and symposia, and reports and presentations to stakeholders.
Trial registration number
ACTRN12619001335189.
Keywords: active transport, adolescents, physical activity, built environment, natural experiment
Strengths and limitations of this study.
This natural experiment follows a large comprehensive baseline survey involving all 12 secondary schools in Dunedin city, which recruited 1780 adolescents aged 13–18 years.
The study methodology has been used previously in the baseline Built Environment and Active Transport to School (BEATS) Study, and includes objective measures of physical activity and the built environment.
Environmental scans of school neighbourhoods and comprehensive mapping are novel methods.
Limitations include self-reported travel to school data and objectively measured physical activity only in a subgroup of adolescents.
In 2018, the newly elected coalition government of New Zealand signalled intentions to provide safe walking and cycling access to all schools; however, such built environment changes take time to plan and implement and are therefore unlikely to influence this study.
Introduction
Low levels of physical activity (PA) and increased engagement in sedentary pastimes among adolescents are global public health concerns.1 2 Although active transport to and/or from school (ATS) is a convenient way to reduce sitting time3 and to integrate PA into everyday life,4 5 rates of ATS among adolescents have been declining in many developed countries,6 including New Zealand (NZ).7 8
NZ’s transport system is dominated by high private vehicle ownership,9 near-complete reliance on fossil fuels,10 sprawling urban areas,11 12 educational policy with an emphasis on school choice,13 increasing numbers of adolescents being driven to school,7 low rates of walking and cycling to school,7 14 15 high rates of bicycle-related crashes in adolescents16 17 and other sociotechnical mobility cultures (eg, financial constraint). These factors reproduce car-dependent norms and practices18 19 and contribute to behaviours that inhibit active transport.
In addition to individual, family, school and social factors, physical environment factors (including the built environment (BE)) are predictors of ATS.20–23 However, the impact of the environment on PA and sedentary behaviour is not consistent.24 25 This can be partly explained by an inadequate understanding of the local context. An ecological approach that examines the multiple levels of influence on ATS is essential for developing and identifying effective interventions to promote ATS. Since the randomised controlled trial (RCT) design is rarely feasible due to prohibitive costs associated with changes to the BE26 and probable opposition presented by town councils and communities to RCTs affecting road infrastructure, natural experiments are considered a priority for examining causal associations between the BE and PA.27 28 Few natural experiments29–33 to date have examined the effects of walking and cycling infrastructure changes on PA and active transport in adults, and none have examined the effects of such changes on PA and ATS among adolescents. The practice-based evidence pathway to improving population health, exemplified in natural experiments, is an essential complement to the more established evidence-based practice pathway, typified in the RCT, and is often the only way to generate meaningful evidence to address critical questions about population health interventions.34
The Built Environment and Active Transport to School (BEATS) Study, 2014–2017
The Built Environment and Active Transport to School (BEATS) Study was conducted in Dunedin city, NZ, in 2014–2017.35 36 It was an interdisciplinary collaboration with multisector partnerships involving the Dunedin Secondary Schools’ Partnership, the local city council, the community and academia,35 and was designed to provide evidence-based information about road safety issues around schools, inform the design of a cycle skills training programme and inform education policies. All 12 Dunedin secondary schools and 1780 adolescents participated.
Findings
The 2014–2015 BEATS Student Survey data showed that only 17.9% of adolescents met minimal PA guidelines,37 and that rates of ATS in Dunedin may be context specific and at least in part attributed to BE-related factors.15 38 39 Specifically, school travel was dominated by motorised transport (60.1%),40 the average distance to school was 6.2±7.4 km40 and less than half of adolescents attended their closest school.38 41 Dunedin adolescents had a preference for private car travel and a desire for and intention to learn to drive.42 Common barriers to ATS included long distance, personal factors (eg, heavy school bags), lack of social support, convenience of being driven to school, the weather, BE factors (intersection density and residential density), traffic safety concerns, cycling helmet legislation and school choice policies.14 15 38 39 41 43–46 Adolescents’ perception of the safety of walking to school was the strongest correlate of ATS.47 The BE in school neighbourhoods correlated with adolescents’ perceptions of the school route for walking and cycling.47 Compared with walking, cycling to school was less common, perceived as less safe and received less social and infrastructure support.39 A complex range of factors contributed to perceptions of cycling safety, including features and perceptions of the BE and traffic safety.43
BEATS Natural Experiment: Study overview
Since 2014, on-road and off-road cycling infrastructure construction has occurred in some Dunedin neighbourhoods. Pedestrian-related infrastructure changes began in 2018. This has provided a unique and timely opportunity to conduct a natural experiment. The BEATS Natural Experiment (BEATS-NE) Study will measure the effects associated with BE changes (cycling and pedestrian infrastructure construction: the intervention) in Dunedin neighbourhoods on ATS and PA in adolescents attending a secondary school.
The objectives and hypotheses are:
Aim 1: To examine the associations between BE changes in Dunedin on transport choices and PA in adolescents enrolled in ‘exposure’ compared with ‘control’ schools.
Hypothesis 1: Compared with baseline (2014–2015), adolescents attending ‘exposure’ schools will have higher rates of ATS, particularly cycling, and greater overall PA levels than adolescents attending ‘control' schools.
Aim 2: To examine the associations between BE changes in Dunedin on adolescents’ perceptions of walking and cycling to school in ‘exposure’ compared with ‘control’ schools.
Hypothesis 2: Compared with baseline (2014–2015), fewer BE-related barriers and traffic-related safety concerns for ATS (particularly for cycling) will be reported by adolescents attending ‘exposure’ versus ‘control’ schools.
Aim 3: To identify factors associated with ATS in adolescents.
Hypothesis 3: Dedicated cycling infrastructure, BE characteristics of home and school neighbourhoods, dietary behaviours, school bag weight and anthropometric measures will be significantly associated with ATS among Dunedin adolescents.
Methods and analysis
Study setting
Dunedin is the seventh largest city by population (population: 130 000), yet second largest by territorial land area in NZ. The city’s topography, transport infrastructure, climate and education setting offer the opportunity to examine the school travel practices of adolescents from both urban and more remote parts of the city (see figure 1).
Figure 1.
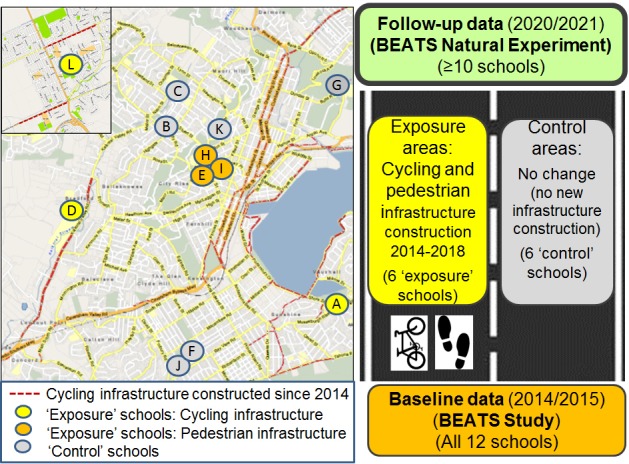
Built Environment and Active Transport to School (BEATS) Natural Experiment: intervention locations and study design.
Topography: Beyond the Central Business District, the city is surrounded by hills and ocean, and much residential housing are on the hillsides. This topography presents specific challenges for promoting active transport.
Transport infrastructure: State Highway 1, a major highway running the length of NZ, passes through Dunedin on two one-way streets with a 50 km/hour speed limit through the Central Business District, and 60 km/hour beyond that area. These one-way streets also have some of the most developed cycling infrastructure in the city.
Climate: Dunedin’s climate is generally temperate, with mild summers and cool winters (mean annual temperature: 11.0°C),48 and unique microclimates arising from the highly varied topographical landscape.
Educational setting: Dunedin has 12 public secondary schools (5 coeducational, 3 boys-only and 4 girls-only schools); 8 regular and 4 special character (religious) schools, and less than half of adolescents enrol in the closest school.38 41
Research design
In the context of a natural experiment, the BEATS-NE will be guided by ecological models for active transport21 49 that account for individual, social, environmental and policy factors (figure 2). The study will use the published BEATS Study methodology36 with both quantitative and qualitative methods, which will be enhanced by novel research methods.
Figure 2.

Built Environment and Active Transport to School (BEATS) Research Programme conceptual framework.
Intervention
The locations of BE cycling and pedestrian infrastructure changes since 2014 are presented in figure 1. The BE infrastructure changes have included both macroscale features (eg, building of new cycle lanes, creation of quiet streets) and microscale features (improvement in intersection design, pedestrian infrastructure, safety features, traffic calming measures, aesthetics). Specifically, infrastructure improvements included extended kerbs/footpaths and painted threshold markings at school zone gateways, platforms, variable electronic speed signs and advanced warning signs advising of approaching a school zone. Other improvements comprised new safe crossing points including extended kerbs and/or raised platforms, intersection design to slow down turning traffic manoeuvers and new drop kerbs to provide proper connections with tactile pavers to assist the visually impaired. The neighbourhoods of 6 out of 12 Dunedin secondary schools are affected (table 1, figure 1).
Table 1.
BEATS Natural Experiment: characteristics of exposure and control schools
| ‘Exposure’ schools (n=6) |
‘Control’ schools (n=6) |
|
| School type | 4 co-ed; 1 boys-only; 1 girls-only |
1 co-ed; 1 boys-only; 3 girls-only |
| School decile* (average (range)) | 7.5 (5–9) | 8.0 (5–10) |
| School size—number of students (average (range)) | 658 (360–869) |
514 (388–872) |
| Topography | 3 on flat; 3 on hillside |
3 on flat; 3 on hillside |
| Too many hills on the way to school† (average per school (range)) | 39% agree (6%–60%) |
37% agree (17%–58%) |
| Active transport to school‡ (average per school (range)) | 24% (10%–45%) |
21% (14%–31%) |
Data presented as average (range) across schools.
*‘Deciles are a measure of the socio-economic position of a school’s student community relative to other schools throughout the country’ (decile 1=‘low’ to decile 10=‘high’).
†BEATS Student Survey 2014/2015 data (excluding adolescents residing >4 km from school and boarders at school).
‡Active transport to school only (excluding mixed modes and boarders at school); data from the BEATS Student Survey 2014/2015.
BEATS, Built Environment and Active Transport to School; co-ed, coeducational.
As this is a natural experiment, we have no control over circumstances that may arise during the study. In 2018, the newly elected coalition government of NZ signalled intentions to provide safe walking and cycling access to all schools.50 While it is possible that these actions will influence our study, BE changes take time to plan and implement, so we do not expect the study to be compromised by these or other unanticipated events over the study period. We will nevertheless actively monitor and document any such changes and account for them in the analyses where possible.
Our study will measure associations between changes in ATS rates and attitudes in the exposure schools relative to changes in the control schools. As in any quasi-experimental study, the relevant exposures are those that are present in one arm of the study but not in the other. These exposures will be measured carefully as, for example, traffic calming introduced in one part of the city may or may not affect traffic speeds and consequent safety perceptions in another part of the city. We will maintain communication with the local road controlling authorities to identify what BE changes have been implemented with respect to the schools studied and the timing of our assessment of outcome measures for those schools.
Patient and public involvement
The BEATS and BEATS-NE Studies have been designed and implemented using a community-based participatory approach with the sustained involvement of key stakeholders: the Dunedin Secondary Schools’ Partnership, Dunedin City Council, NZ Transport Agency and Māori and Pacific communities. They have been involved in setting research priorities, defining research questions and outcome measures, contributing to study design, study materials, research procedures and implementation, data analysis and preparation of research outputs, dissemination of results and the evolution of the BEATS Research Programme since inception.35 For example, in response to the research priorities identified by community partners, the original BEATS Study also examined adolescents and their parents’ perceptions of cycle skills training40 51 and the issue of school choice.38 41 The ongoing involvement of community partners is facilitating the generation of usable data and knowledge translation into evidence-based policy and planning. Findings to date have been adopted by end users, employed in the design of school/city-wide programmes and initiatives in Dunedin and have attracted interest of national organisations and Ministries of Health and Transport.
Recruitment of schools and adolescents
All 12 Dunedin secondary schools will be invited to participate. We anticipate at least 10, if not all, schools will participate. Based on this, the eligible population will be ≈3750–4500 students (~25 students per class × ~3 classes participating per school year × 5 school years × 10–12 schools). For logistical reasons, the sampling of classes within schools will be left to the discretion of each school.36 With an expected adolescents’ participation rate of ~42% (based on the BEATS Study) from at least 10 schools, we will recruit 1600 adolescents aged 13–18 years. Recruitment procedures36 will include: providing study information packages to all invited adolescents (and their parents) at their school 1–3 weeks prior to data collection; advertising the study in school newsletters; school principals sending a study invitation via email to adolescents and their parents; and providing study packages in prepaid envelopes for each school to send to parents without an email address. Adolescents will provide written consent prior to data collection. Based on discussions with the schools and the institutional ethics committee, parental consent will not be required as the study is considered low risk (ethics approval reference: 17/188). In a supervised classroom, consenting adolescents will complete (1) an online survey, (2) anthropometry measurements and school route map at school, with additional optional written consents for each of (3) PA assessment (n=420), (4) focus group participation (n=72), and (5) participatory mapping (n=200). We will survey an equal number of ‘exposure’ and ‘control’ schools in each school term to control for seasonal variations.
Assessment procedures
Assessment procedures36 will include both quantitative and qualitative methods (table 2). The core data will include accelerometer-measured PA, anthropometry, Geographic Information System (GIS) BE measures and route to school drawn maps.
Table 2.
BEATS Natural Experiment: assessments
| Baseline | Follow-up | |
| Data collection (year) | 2014/2015 | 2020/2021 |
| Number of schools (out of 12) | 12 | ≥10 |
| Online student survey | 1663 | 1500 |
| Anthropometric measurements | 1578 | 1400 |
| School bag weight | 1298 | 1200 |
| Accelerometer assessment of physical activity | 416 | 420 |
| Basic mapping of route to school (safe/unsafe areas) | 740 | 750 |
| Comprehensive participatory mapping of school neighbourhoods and route(s) | N/A | 200 |
| GIS analysis (home and school neighbourhoods; route to school) | 1488 | 1450 |
| Environmental audits of school neighbourhoods (schools, n) | N/A | 12 |
| Focus groups (students, n) | 54 | 72 |
BEATS, Built Environment and Active Transport to School; GIS, Geographic Information System; N/A, not applicable.
Student survey
Adolescents will be surveyed once using a 35–40 min BEATS Student Survey questionnaire36 modified for this study (new aspects are highlighted in the following). The questionnaire will be delivered and completed online, during classroom time, with research assistants and a teacher present.36 Questions will include demographics (age, gender, ethnicity, school, home address), family factors (family structure, bicycle/vehicle ownership), school choice,41 transport to school habits,39 motivations for and barriers to ATS,39 independent mobility (new),52 motorised transport, adolescents’ perceptions of their route to school39 and school neighbourhood environment (adapted Neighbourhood Environment Walkability Scale for Youth (test–retest reliability in adolescents: intraclass correlation coefficient (ICC) range 0.56–0.87))53 and health behaviours37 (PA, sedentary behaviour and dietary behaviour (fast food, confectionary and sugar-sweetened beverage intake54)). Home address data will be used to calculate home-to-school distance and to determine NZ Indices of Multiple Deprivation55 as a surrogate for students’ socioeconomic status. School data will include each school’s decile and size. Deciles are a measure of the socioeconomic position of a school’s student community relative to other schools throughout the country.56
Anthropometry measurements
Although not a primary outcome, weight status is the key health indicator. It will be included in analyses of adolescents’ lifestyle habits and access to food outlets. Height (Seca portable stadiometer), weight (A&D scale UC321, A&D Medical) and waist circumference (Lufkin measuring tape) will be measured twice using standard procedures37 in a private, screened-off area in the classroom.36 Adolescents will be asked to remove their shoes, jackets and sweaters prior to the measurements.36 Body mass index will be calculated and weight status category will be determined using international age and gender-specific cut-points.57 Adolescents’ school bags will be weighed,45 including a separate weighing of laptop computers/tablets, for students who bring them to school.
GIS analysis of the built environment
GIS analysis of the BE will be conducted for the home and school neighbourhoods and route to school. BE variables (network-based distance from home to school, land mix use, residential density, intersection density and topography indicators) and food outlet data will be derived through GIS analytical techniques using Esri ArcGIS V.10.6.1 software.36 Distance from home to school will be calculated using both the shortest route on a topologically connected transport network, based on geocoded home and school addresses and the actual route from home to school from paper maps.36 Such GIS-calculated distances were similar to distances measured from Global Navigation Satellite System (GNSS) data collected on the home-to-school route.58 GIS BE measures will include intersection density (the count of intersections within a buffer zone), residential density (the count of located address points within a specific buffer of each address) and the land use mix variable (calculated as the mean land use mix entropy59 using Dunedin City Council reference data (values range from 0 (single class land use) to 1 (even distribution all land use classes))). The topography along the school route will be represented by the altitude difference and total altitude gain variables, calculated in conjunction with digital elevation data. GIS BE measures around home and schools will be assessed using 500 m and 1000 m network buffers and a 100 m buffer along school routes. Buffer sizes differ widely in previous GIS BE studies (400–1600 m around home/school and ≤200 m either side of any route).23 Our choice of buffers follows the precedent of other NZ studies,60 61 derived from analysis of student track GNSS data, as well as other previous studies.44 62 63 Food outlets will be assessed around schools (500 m and 1000 m buffer) and along the common school routes (200 m buffer).61
Basic transport route mapping using annotated paper maps
All survey participants will trace their route from home to school on an A3 printed street map, annotating their transport mode and safe/unsafe zones.36 The paper maps will be scanned, georeferenced and digitised into GIS compatible data. The digitised mapped route will be linked with the GIS BE measures. Map-measured routes have been used as valid in the past, significantly differing from GIS-based network measurements.64 Therefore, this map-based collection method for all participants is added for robustness. From this data set, transport density and travel mode patterns will be examined. Safety categories determined from annotated BEATS maps in 2014/2015 (social, drivers and pedestrians, traffic, intersections/crossings, BE infrastructure and natural environment) will be used.65 Spatial patterns of BE features and unsafe zones in the school neighbourhoods will be compared with 2014–2015 data65 66 and inform focus group discussions.
Comprehensive participatory mapping of the route to school and school neighbourhood
A subgroup of 200 adolescents (16–20 adolescents/school; half from ‘exposure’ schools) will be invited to participate in a separate comprehensive mapping session at their school (50–60 min), supervised by researchers. Participants will use paper maps (A3 size) to map their main route to school and identify their transport mode(s) as well as annotate safe/unsafe areas, as above. Alternative routes, road infrastructure, social, topographic and aesthetic factors and seasonal factors will also be drawn and annotated. In addition, participants will map their school neighbourhood for facilitators of and barriers to walking and cycling to school. Maps will be processed as described above. For detailed annotations, a coding framework will be developed, implemented and visualised, informed by the 2018 BEATS Rural Study protocol and previous research.67 Spatial patterns (densities, verified by spatial analysis) and adolescents’ experiences and perceptions of BE features and unsafe zones en route and around schools will be described. Identified unsafe zones around schools will be discussed in focus groups.
Environmental audit of school neighbourhoods
School neighbourhoods were audited using the Microscale Audit of Pedestrian Streetscapes (MAPS) Global tool.68 We adapted this tool for assessing school neighbourhoods, and collected data in 2017/2018 for all 12 Dunedin secondary schools using 500 m street network buffer around each school.47 MAPS Global tool assesses microlevel BE features including street design, sidewalks and street crossings.69 The tool assesses the features of the route (such as land use, destinations and street amenities), street segments (such as sidewalks, bicycle facilities and slope), crossings (such as crosswalk markings and crossing signals) and cul-de-sacs (such as size and amenities).68 Items within each section are grouped into subscales and used to calculate the overall score.69 MAPS items and subscales have predominantly moderate to excellent inter-rater reliability (ICC values of 0.41 and 0.60, respectively).69 In children, adolescents, adults and older adults, 51.2% of all MAPS scores were significantly associated with walking/cycling for transport, 22.1% were associated with leisure/neighbourhood PA and 15.7% were associated with objectively measured PA.68 After adjusting for walkability, the MAPS grand score was related to active transport with small-to-medium effect sizes (d=0.44 in children).68 The overall score was related to objective PA in children.68 The MAPS tool has been used to assess the route from participants’ home to non-residential destinations.68–70
Physical activity assessment
In a separate process, a subset of consenting adolescents will be provided an accelerometer (ActiGraph, GT3XPlus, Pensacola, FL, USA) 1–3 weeks after completing the survey.36 71 Research assistants will show adolescents how to attach, wear and use an accelerometer at school.36 71 They will be instructed to wear the accelerometer above the right hip for ≥12 hours/day for 7 consecutive days.71 The valid wear time criteria will be set as ≥5 days, for ≥10 hours/day.72 73 To encourage compliance, adolescents will be given a logbook to record the times and reasons for taking the device off during the day and they will be reminded to wear the accelerometer as instructed via email, phone calls or texts.71 They will also be asked to record their mode of transport to and from school and cycling activities daily for the 7 days (due to accelerometer underestimation of PA during cycling), and to return their accelerometer to their school. Activity counts will be stored in 15 s interval counts to detect short bursts of vigorous PA.74 Data will be analysed using MeterPlus software using Evenson cut-points.75 Variables will include average time spent in light, moderate and vigorous PAs and being sedentary (daily, weekday and weekend) and throughout the schoolday (1 hour before school (08:00-09:00), during the schoolday (09:00-15:00), 1 hour after school (15:00-16:00) and late after-school hours (16:00-20:00)).71
Sample size
To power the study for Aim 1, 1500 students (‘exposure’/’control’ schools: 750/750) are needed. To account for 7% invalid consents/surveys based on the BEATS Study, we will recruit 1600 students (‘exposure’/’control’ schools: 800/800). Given the collected baseline data (n=1663), the resulting sample size of 1500 adolescents at the follow-up will be sufficient to detect a small difference in rates of any form of ATS (from baseline 40% to 46% or higher) in the ‘exposure’ schools relative to the ‘control’ schools with 80% power and type I error probability associated with the null hypothesis of 0.05.76 This is based on a comparison of ATS rates for a sample size of 750 students in the exposure schools following BE changes compared with ATS rates among 2250 students in the control schools plus the exposure schools prior to the BE changes, using an uncorrected χ2 test. We will also undertake a subanalysis to compare rates of ATS only versus combined motorised transport only and mixed modes. As all 12 Dunedin schools are likely to participate in the study, the schools are not clusters but are effectively strata with repeated measures across time, which will increase the power of the analysis to detect change beyond that required. Clustering at the classroom level within schools is likely to have a negligible effect on the required sample size. BEATS Student Survey data36 analysed when calculating power and sample size requirements for this study showed no evidence that the variance within classes in schools was smaller than the pooled variance within the respective schools.
Statistical analysis
To examine the associations between ATS and the exposure (BE changes), we will use multilevel logistic models with a binary outcome (active travel or not) to estimate odds of walking and cycling compared with motorised transport to school. Explanatory factors will include the exposure (or for the controls, no exposure), distance to school and time period (baseline or post-exposure). Gender will be considered a moderator. Exposure effects will be determined from the coefficient of the interaction term between time period and exposure status. The regression models will also examine the effects of parental attitudes (as reported by adolescents), season, school neighbourhood topography (hillside/flat) and schools’ decile on ATS rates. To address the various threats to the validity of a natural experiment, we are using a robust design with pre/post-measurements of both exposed and unexposed groups. At baseline (2014/2015), approximately 40% of adolescents used some form of ATS (alone or with motorised transport). Some students will live in neighbourhoods with BE improvements but attend control schools. We will conduct sensitivity analyses excluding such students, and another analysis looking at the shortest route to school as an exposure at the student level (which may have benefited from BE improvements, or not). Using multilevel models (such as GLIMMIX in SAS, version 9.4), we will also examine differences in adolescents’ perceptions and levels of PA as measured by the accelerometers for adolescents in the ‘exposure’ and ‘control’ schools. The latter analysis will also provide estimates of the contribution provided by ATS to overall PA for this group. We anticipate low levels of non-response, as has been achieved at baseline, in which case non-respondents will be excluded from the analysis. If for some reason non-response rates are higher than 25%, or we suspect that the response rates are systematically related to the response, we will conduct sensitivity analyses using propensity scores. In circumstances where non-response is non-negligible, we will use techniques such as multiple imputation in sensitivity analyses.
Focus groups
In the original BEATS Study, we employed qualitative findings to complement information derived from student surveys to obtain a more complete picture about adolescents’ aspirations for car-based travel.42 In the BEATS-NE, the focus groups will provide a unique opportunity to explore school-specific survey and school neighbourhood mapping results with adolescents, allowing them to confirm and/or contest findings, as well as expand on them.77 Depending on the nature of the research questions of specific sub-studies within the overarching BEATS-NE, we plan to take advantage of both quantitative and qualitative data and combine them using a pragmatic position which aims to ‘tap the relative strengths and to make the most efficient use of both in attempting to understand social phenomena’.78 This approach will be used to ‘highlight discrepancies in data or interpretation’ and to ‘enhance the explanatory power’ of our research.79 Such an approach may entail using different strategies to combine or integrate quantitative and qualitative data according to the specific purposes of each sub-study in which mixed methods are used. For such research questions, focus group interviews will be guided using school-specific infographics with selected key survey findings. The investigators will take photos of school-specific unsafe zones identified in participatory mapping and use them as prompts in focus group discussions.
Interviews36 will be conducted with age and gender-diverse groups of six adolescents per session (1 session per school × 8 schools). In addition, two sessions with Māori adolescents and two sessions with Pacific adolescents will be conducted as it is important in NZ to understand the cultural context for Māori who are the indigenous people and also for those of Pacific origin. The proposed size and number of focus groups is based on our previous and current work and should be sufficient to reach data saturation. However, if needed, additional focus groups will be conducted to shed further light into specific issues being investigated until theoretical redundancy or saturation is achieved.
Appropriate tikanga (protocols) will be adhered to for Māori and Pacific focus group sessions and we will be guided by each school on tikanga. Focus groups with Māori and Pacific adolescents will be facilitated by a Māori health researcher (AR) and a Pacific community representative, respectively. Examining survey and mapping results with adolescents will tap into their in-depth understanding about the complexities of their mobilities, and will provide rich contextual information for interpretation of the quantitative data. Facilitators will record interviews digitally and take notes during the sessions. The digitally audio-recorded focus group data will be transcribed then checked for errors. The data will be read, coded and analysed thematically80 by ≥2 investigators (CE, DH, SS) using HyperResearch and/or NVivo qualitative analysis software.
Ethics and dissemination
This study has been approved by the University of Otago Human Ethics Committee (reference: 17/188). The outcomes of the BEATS-NE Study are relevant to Māori and will support improving health and social well-being by providing relevant Māori-specific knowledge for health promoters and policymakers. Consultation with the Ngāi Tahu Research Consultation Committee (University of Otago) has been ongoing since 2013. This Committee provided guidance on ethnicity data collection and avenues for dissemination findings to Māori community, which have been incorporated into the BEATS-NE Study.
BEATS-NE findings will be shared with the academic community, key stakeholders and the wider community through established BEATS Research Programme dissemination channels, including peer-reviewed journal articles and conferences abstracts, academic, stakeholder and community presentations, technical reports and policy briefings, BEATS Research Programme website (www.otago.ac.nz/beats), Active Living Laboratory quarterly newsletter (www.otago.ac.nz/active-living) and media commentaries.36
We will maximise the impact of the BEATS-NE Study locally, nationally and internationally. The study will generate relevant information for key stakeholders for planning future school-, neighbourhood- and city-wide BE changes to encourage ATS as a means of equitably increasing PA and decreasing sedentary behaviour among adolescents. The BEATS-NE will also provide timely, valuable and stakeholder-specific information for: (1) Dunedin City Council (the effects of the BE infrastructure changes on adolescents’ transport to school habits and cycling behaviour); (2) Dunedin Secondary Schools’ Partnership (changes in adolescents’ perspective on school choice compared with 2014/2015); and (3) participating schools (comprehensive information about their students’ transport to school habits, perceptions of ATS and lifestyle habits to tailor future school-based health promotion initiatives).
Supplementary Material
Acknowledgments
The BEATS Research Programme is a collaboration between the Dunedin Secondary Schools' Partnership, Dunedin City Council and University of Otago. We acknowledge the members of the BEATS Research Programme Advisory Board (Stacey Hitchcock, Finau Taungapeau, Associate Professor Janet Stephenson and Sarah Connolly), BEATS collaborators (Associate Professor Melody Smith, Associate Professor Palma Chillón, Associate Professor Javier Molina-García, Associate Professor Ana Queralt and Professor Jennifer S Mindell), research personnel (project manager Kimberley King, research assistants, research students and volunteers) and all participating schools, school principals, students and parents.
Footnotes
Contributors: SM is the principal investigator who conceptualised the overall BEATS Research Programme and the BEATS Natural Experiment Study, established research collaborations and led the project implementation. SM, DH, EGB, AM, SS, KC, CE, MK, AR, GK, GW and JCS contributed to the study design and obtaining research funding for the BEATS Natural Experiment. GW and GK were involved in the study design, design of study materials including study surveys, consultation with schools and assisted with schools’ recruitment. SM wrote the first draft. SM, DH, EGB, AM, SS, KC, CE, MK, AR, GK, GW and JCS contributed to subsequent drafts and approved the final version of the manuscript.
Funding: The BEATS Natural Experiment was supported by the Health Research Council Project Grant (19/173) and internal grants from the Division of Science and School of Physical Education, Sport and Exercise Sciences, University of Otago. The BEATS Study was supported by the Health Research Council of New Zealand Emerging Researcher First Grant (14/565), National Heart Foundation of New Zealand (1602 and 1615), Lottery Health Research Grant (Applic 341129), University of Otago Research Grant (UORG 2014), Dunedin City Council and internal grants from the School of Physical Education, Sport and Exercise Sciences, University of Otago.
Disclaimer: The funding bodies did not have role in the design of the study and collection, analysis, data interpretation or writing this manuscript.
Map disclaimer: The depiction of boundaries on this map does not imply the expression of any opinion whatsoever on the part of BMJ (or any member of its group) concerning the legal status of any country, territory, jurisdiction or area or of its authorities. This map is provided without any warranty of any kind, either express or implied.
Competing interests: None declared.
Patient and public involvement: Patients and/or the public were involved in the design, or conduct, or reporting, or dissemination plans of this research. Refer to the Methods and Analysis section for further details.
Patient consent for publication: Not required.
Ethics approval: This study was approved by University of Otago Human Ethics Committee (reference: 17/188).
Provenance and peer review: Not commissioned; externally peer reviewed.
References
- 1.Tremblay MS, LeBlanc AG, Kho ME, et al. Systematic review of sedentary behaviour and health indicators in school-aged children and youth. Int J Behav Nutr Phys Act 2011;8:98. 10.1186/1479-5868-8-98 [DOI] [PMC free article] [PubMed] [Google Scholar]
- 2.Aubert S, Barnes JD, Abdeta C, et al. Global matrix 3.0 physical activity report card grades for children and youth: results and analysis from 49 countries. J Phys Act Health 2018;15:S251–73. 10.1123/jpah.2018-0472 [DOI] [PubMed] [Google Scholar]
- 3.Owen N, Salmon J, Koohsari MJ, et al. Sedentary behaviour and health: mapping environmental and social contexts to underpin chronic disease prevention. Br J Sports Med 2014;48:174–7. 10.1136/bjsports-2013-093107 [DOI] [PubMed] [Google Scholar]
- 4.Faulkner GEJ, Buliung RN, Flora PK, et al. Active school transport, physical activity levels and body weight of children and youth: a systematic review. Prev Med 2009;48:3–8. 10.1016/j.ypmed.2008.10.017 [DOI] [PubMed] [Google Scholar]
- 5.Mendoza JA, Watson K, Nguyen N, et al. Active commuting to school and association with physical activity and adiposity among US youth. J Phys Act Health 2011;8:488–95. 10.1123/jpah.8.4.488 [DOI] [PMC free article] [PubMed] [Google Scholar]
- 6.Gray CE, Larouche R, Barnes JD, et al. Are we driving our kids to unhealthy habits? results of the active healthy kids Canada 2013 report card on physical activity for children and youth. Int J Environ Res Public Health 2014;11:6009–20. 10.3390/ijerph110606009 [DOI] [PMC free article] [PubMed] [Google Scholar]
- 7.Ministry of Transport 25 years of new Zealand travel: new Zealand household travel 1989–2014, 2015. [Google Scholar]
- 8.Ministry of Transport New Zealand household travel survey 2015-2017, 2017. [Google Scholar]
- 9.The World Bank Motor vehicles (per 1,000 people). 2014, 2014. Available: http://data.worldbank.org/indicator/IS.VEH.NVEH.P3 [Accessed Aug 2019].
- 10.Hopkins D, Campbell-Hunt C, Carter L, et al. Climate change and Aotearoa New Zealand. Wiley Interdiscip Rev Clim Change 2015;6:559–83. 10.1002/wcc.355 [DOI] [Google Scholar]
- 11.Stephenson J, Spector S, Hopkins D, et al. Deep interventions for a sustainable transport future. Transp Res D Transp Environ 2018;61:356–72. 10.1016/j.trd.2017.06.031 [DOI] [Google Scholar]
- 12.Early L, Howden-Chapman P, Russell M, Drivers of Urban Change. Wellington: Steele Roberts, 2015. [Google Scholar]
- 13.Ladd HF, Fiske EB. The uneven playing field of school choice: evidence from New Zealand. J Pol Anal Manage 2001;20:43–64. [DOI] [Google Scholar]
- 14.Mandic S, Leon de la Barra S, García Bengoechea E, et al. Personal, social and environmental correlates of active transport to school among adolescents in Otago, New Zealand. J Sci Med Sport 2015;18:432–7. 10.1016/j.jsams.2014.06.012 [DOI] [PubMed] [Google Scholar]
- 15.Frater J, Williams J, Hopkins D, et al. A tale of two new Zealand cities: cycling to school among adolescents in Christchurch and Dunedin. Transp Res Part F Traffic Psychol Behav 2017;49:205–14. 10.1016/j.trf.2017.06.018 [DOI] [Google Scholar]
- 16.Tin Tin S, Woodward A, Ameratunga S. Injuries to pedal cyclists on new Zealand roads, 1988-2007. BMC Public Health 2010;10:655. 10.1186/1471-2458-10-655 [DOI] [PMC free article] [PubMed] [Google Scholar]
- 17.Ministry of Transport Cyclists 2015. Wellington.: Ministry of Transport, 2015. [Google Scholar]
- 18.Hopkins D. Can environmental awareness explain declining preference for car-based mobility amongst generation Y? A qualitative examination of learn to drive behaviours. Transport Res A-Pol Pract 2016;94:149–63. 10.1016/j.tra.2016.08.028 [DOI] [Google Scholar]
- 19.Hopkins D, Stephenson J. The replication and reduction of automobility: findings from Aotearoa New Zealand. J Transp Geogr 2016;56:92–101. 10.1016/j.jtrangeo.2016.09.005 [DOI] [Google Scholar]
- 20.Davison KK, Werder JL, Lawson CT. Children's active commuting to school: current knowledge and future directions. Prev Chronic Dis 2008;5:A100. [PMC free article] [PubMed] [Google Scholar]
- 21.Panter JR, Jones AP, van Sluijs EM. Environmental determinants of active travel in youth: a review and framework for future research. Int J Behav Nutr Phys Act 2008;5:34. 10.1186/1479-5868-5-34 [DOI] [PMC free article] [PubMed] [Google Scholar]
- 22.Pont K, Ziviani J, Wadley D, et al. Environmental correlates of children's active transportation: a systematic literature review. Health Place 2009;15:849–62. 10.1016/j.healthplace.2009.02.002 [DOI] [PubMed] [Google Scholar]
- 23.Wong BY-M, Faulkner G, Buliung R. GIS measured environmental correlates of active school transport: a systematic review of 14 studies. Int J Behav Nutr Phys Act 2011;8:39. 10.1186/1479-5868-8-39 [DOI] [PMC free article] [PubMed] [Google Scholar]
- 24.Adams MA, Frank LD, Schipperijn J, et al. International variation in neighborhood walkability, transit, and recreation environments using geographic information systems: the IPEN adult study. Int J Health Geogr 2014;13:43. 10.1186/1476-072X-13-43 [DOI] [PMC free article] [PubMed] [Google Scholar]
- 25.Raine KD, Muhajarine N, Spence JC, et al. Coming to consensus on policy to create supportive built environments and community design. Can J Public Health 2012;103:S5–8. 10.1007/BF03403828 [DOI] [PMC free article] [PubMed] [Google Scholar]
- 26.Veitch J, Salmon J, Giles-Corti B, et al. Challenges in conducting natural experiments in parks-lessons from the REVAMP study. Int J Behav Nutr Phys Act 2017;14:5. 10.1186/s12966-016-0460-0 [DOI] [PMC free article] [PubMed] [Google Scholar]
- 27.Sallis JF, Story M, Lou D. Study designs and analytic strategies for environmental and policy research on obesity, physical activity, and diet: recommendations from a meeting of experts. Am J Prev Med 2009;36:S72–7. 10.1016/j.amepre.2008.10.006 [DOI] [PMC free article] [PubMed] [Google Scholar]
- 28.Veitch J, Salmon J, Carver A, et al. A natural experiment to examine the impact of Park renewal on park-use and park-based physical activity in a disadvantaged neighbourhood: the REVAMP study methods. BMC Public Health 2014;14:600. 10.1186/1471-2458-14-600 [DOI] [PMC free article] [PubMed] [Google Scholar]
- 29.Dill J, McNeil N, Broach J, et al. Bicycle boulevards and changes in physical activity and active transportation: findings from a natural experiment. Prev Med 2014;69 Suppl 1:S74–8. 10.1016/j.ypmed.2014.10.006 [DOI] [PubMed] [Google Scholar]
- 30.Yang L, Sahlqvist S, McMinn A, et al. Interventions to promote cycling: systematic review. BMJ 2010;341:c5293. 10.1136/bmj.c5293 [DOI] [PMC free article] [PubMed] [Google Scholar]
- 31.Panter J, Ogilvie D, iConnect consortium . Can environmental improvement change the population distribution of walking? J Epidemiol Community Health 2017;71:528–35. 10.1136/jech-2016-208417 [DOI] [PMC free article] [PubMed] [Google Scholar]
- 32.Keall M, Chapman R, Howden-Chapman P, et al. Increasing active travel: results of a quasi-experimental study of an intervention to encourage walking and cycling. J Epidemiol Community Health 2015;69:1184–90. 10.1136/jech-2015-205466 [DOI] [PubMed] [Google Scholar]
- 33.Macmillan AK, Mackie H, Hosking JE, et al. Controlled before-after intervention study of suburb-wide street changes to increase walking and cycling: te Ara Mua-Future streets study design. BMC Public Health 2018;18:850. 10.1186/s12889-018-5758-1 [DOI] [PMC free article] [PubMed] [Google Scholar]
- 34.Ogilvie D, Adams J, Bauman A, et al. Using natural experimental studies to guide public health action: turning the evidence-based medicine paradigm on its head. J Epidemiol Community Health 2020;74:203–8. 10.1136/jech-2019-213085 [DOI] [PMC free article] [PubMed] [Google Scholar]
- 35.Mandic S, Mountfort A, Hopkins D, et al. Built environment and active transport to school (beats) study: multidisciplinary and multi-sector collaboration for physical activity promotion. Retos 2015;28:197–202. [Google Scholar]
- 36.Mandic S, Williams J, Moore A, et al. Built environment and active transport to school (beats) study: protocol for a cross-sectional study. BMJ Open 2016;6:e011196. 10.1136/bmjopen-2016-011196 [DOI] [PMC free article] [PubMed] [Google Scholar]
- 37.Mandic S, Bengoechea EG, Coppell KJ, et al. Clustering of (Un)Healthy Behaviors in Adolescents from Dunedin, New Zealand. Am J Health Behav 2017;41:266–75. 10.5993/AJHB.41.3.6 [DOI] [PubMed] [Google Scholar]
- 38.Mandic S, Sandretto S, García Bengoechea E, et al. Enrolling in the closest school or not? implications of school choice decisions for active transport to school. J Transp Health 2017;6:347–57. 10.1016/j.jth.2017.05.006 [DOI] [Google Scholar]
- 39.Mandic S, Hopkins D, García Bengoechea E, et al. Adolescents' perceptions of cycling versus walking to school: understanding the New Zealand context. J Transp Health 2017;4:294–304. 10.1016/j.jth.2016.10.007 [DOI] [Google Scholar]
- 40.Mandic S, Flaherty C, Pocock T, et al. Attitudes towards cycle skills training in New Zealand adolescents. Transp Res Part F Traffic Psychol Behav 2016;42:217–26. 10.1016/j.trf.2016.08.002 [DOI] [Google Scholar]
- 41.Mandic S, Sandretto S, Hopkins D, et al. “I wanted to go here”: Adolescents’ perspectives on school choice. J Sch Choice 2018;12:98–122. 10.1080/15582159.2017.1381543 [DOI] [Google Scholar]
- 42.Hopkins D, García Bengoechea E, Mandic S. Adolescents and their aspirations for private car-based transport. Transportation;50 10.1007/s11116-019-10044-4 [DOI] [Google Scholar]
- 43.Hopkins D, Mandic S. Perceptions of cycling among high school students and their parents. Int J Sustain Transp 2017;11:342–56. 10.1080/15568318.2016.1253803 [DOI] [Google Scholar]
- 44.Ikeda E, Stewart T, Garrett N, et al. Built environment associates of active school travel in New Zealand children and youth: a systematic meta-analysis using individual participant data. J Transp Health 2018;9:117–31. 10.1016/j.jth.2018.04.007 [DOI] [Google Scholar]
- 45.Mandic S, Keller R, García Bengoechea E, et al. School bag weight as a barrier to active transport to school among New Zealand adolescents. Children 2018;5. 10.3390/children5100129. [Epub ahead of print: 20 09 2018]. [DOI] [PMC free article] [PubMed] [Google Scholar]
- 46.Molina-García J, Queralt A, García Bengoechea E, et al. Would New Zealand adolescents cycle to school more if allowed to cycle without a helmet? J Transp Health 2018;11:64–72. 10.1016/j.jth.2018.10.001 [DOI] [Google Scholar]
- 47.Pocock T, Moore A, Keall M, et al. Physical and spatial assessment of school neighbourhood built environments for active transport to school in adolescents from Dunedin (New Zealand). Health Place 2019;55:1–8. 10.1016/j.healthplace.2018.10.003 [DOI] [PubMed] [Google Scholar]
- 48.Climate Conversation Group NZ temperature record - a brief history, 2016. [Google Scholar]
- 49.Sallis JF, Cervero RB, Ascher W, et al. An ecological approach to creating active living communities. Annu Rev Public Health 2006;27:297–322. 10.1146/annurev.publhealth.27.021405.102100 [DOI] [PubMed] [Google Scholar]
- 50.New Zealand Government Government policy statement on land transport: 2018/2019-2027/2028. 68, 2018. [Google Scholar]
- 51.Mandic S, Flaherty C, Pocock T, et al. Parental perceptions of cycle skills training for adolescents. J Transp Health 2017;6:411–9. 10.1016/j.jth.2017.03.009 [DOI] [Google Scholar]
- 52.Larouche R, Eryuzlu S, Livock H, et al. Test-Retest reliability and convergent validity of measures of children's travel behaviours and independent mobility. J Transp Health 2017;6:105–18. 10.1016/j.jth.2017.05.360 [DOI] [Google Scholar]
- 53.Rosenberg D, Ding D, Sallis JF, et al. Neighborhood environment Walkability scale for youth (NEWS-Y): reliability and relationship with physical activity. Prev Med 2009;49:213–8. 10.1016/j.ypmed.2009.07.011 [DOI] [PubMed] [Google Scholar]
- 54.Sanchez-Vaznaugh EV, Bécares L, Sallis JF, et al. Active school transport and fast food intake: are there racial and ethnic differences? Prev Med 2016;91:281–6. 10.1016/j.ypmed.2016.08.031 [DOI] [PMC free article] [PubMed] [Google Scholar]
- 55.Exeter DJ, Zhao J, Crengle S, et al. The New Zealand indices of multiple deprivation (IMD): a new suite of indicators for social and health research in Aotearoa, New Zealand. PLoS One 2017;12:e0181260. 10.1371/journal.pone.0181260 [DOI] [PMC free article] [PubMed] [Google Scholar]
- 56.Ministry of Education School deciles 2019, 2019. [Google Scholar]
- 57.Cole TJ, Bellizzi MC, Flegal KM, et al. Establishing a standard definition for child overweight and obesity worldwide: international survey. BMJ 2000;320:1240–3. 10.1136/bmj.320.7244.1240 [DOI] [PMC free article] [PubMed] [Google Scholar]
- 58.Duncan MJ, Mummery WK. GIS or GPs? A comparison of two methods for assessing route taken during active transport. Am J Prev Med 2007;33:51–3. 10.1016/j.amepre.2007.02.042 [DOI] [PubMed] [Google Scholar]
- 59.Cervero R, Kockelman K. Travel demand and the 3Ds: density, diversity, and design. Transp Res D Transp Environ 1997;2:199–219. 10.1016/S1361-9209(97)00009-6 [DOI] [Google Scholar]
- 60.Oliver M, Mavoa S, Badland H, et al. Associations between the neighbourhood built environment and out of school physical activity and active travel: an examination from the kids in the City study. Health Place 2015;36:57–64. 10.1016/j.healthplace.2015.09.005 [DOI] [PubMed] [Google Scholar]
- 61.Day PL, Pearce J. Obesity-promoting food environments and the spatial clustering of food outlets around schools. Am J Prev Med 2011;40:113–21. 10.1016/j.amepre.2010.10.018 [DOI] [PubMed] [Google Scholar]
- 62.Larsen K, Gilliland J, Hess P, et al. The influence of the physical environment and sociodemographic characteristics on children's mode of travel to and from school. Am J Public Health 2009;99:520–6. 10.2105/AJPH.2008.135319 [DOI] [PMC free article] [PubMed] [Google Scholar]
- 63.Kerr J, Rosenberg D, Sallis JF, et al. Active commuting to school: associations with environment and parental concerns. Med Sci Sports Exerc 2006;38:787–94. 10.1249/01.mss.0000210208.63565.73 [DOI] [PubMed] [Google Scholar]
- 64.Stigell E, Schantz P. Methods for determining route distances in active commuting – their validity and reproducibility. J Transp Geogr 2011;19:563–74. 10.1016/j.jtrangeo.2010.06.006 [DOI] [Google Scholar]
- 65.Rodda J, Moore A, Mandic S. An active transport to school route data“atlas” for Dunedin. International Symposium active living and environment:towards a healthier and more sustainable future, 2017:47. [Google Scholar]
- 66.Rodda J, Moore A, Mandic S. Adolescents’ perceptions of safety along routes to Dunedin secondary schools: is perception biased? International Symposium active living and environment: towards a healthier and more sustainable future, 2017:60. [Google Scholar]
- 67.Wilson K, Coen SE, Piaskoski A, et al. Children's perspectives on neighbourhood barriers and enablers to active school travel: a participatory mapping study. Can Geogr 2019;63:112–28. 10.1111/cag.12488 [DOI] [Google Scholar]
- 68.Cain KL, Millstein RA, Sallis JF, et al. Contribution of streetscape audits to explanation of physical activity in four age groups based on the microscale audit of pedestrian Streetscapes (maps). Soc Sci Med 2014;116:82–92. 10.1016/j.socscimed.2014.06.042 [DOI] [PMC free article] [PubMed] [Google Scholar]
- 69.Millstein RA, Cain KL, Sallis JF, et al. Development, scoring, and reliability of the microscale audit of pedestrian Streetscapes (maps). BMC Public Health 2013;13:403. 10.1186/1471-2458-13-403 [DOI] [PMC free article] [PubMed] [Google Scholar]
- 70.Phillips CB, Engelberg JK, Geremia CM, et al. Online versus in-person comparison of microscale audit of pedestrian Streetscapes (maps) assessments: reliability of alternate methods. Int J Health Geogr 2017;16:27. 10.1186/s12942-017-0101-0 [DOI] [PMC free article] [PubMed] [Google Scholar]
- 71.Kek CC, García Bengoechea E, Spence JC, et al. The relationship between transport-to-school habits and physical activity in a sample of new Zealand adolescents. J Sport Health Sci 2019;8:463–70. 10.1016/j.jshs.2019.02.006 [DOI] [PMC free article] [PubMed] [Google Scholar]
- 72.Sherar LB, Griew P, Esliger DW, et al. International children's accelerometry database (ICAD): design and methods. BMC Public Health 2011;11:485. 10.1186/1471-2458-11-485 [DOI] [PMC free article] [PubMed] [Google Scholar]
- 73.Trost SG. Measurement of physical activity in children and adolescents. Am J Lifestyle Med 2007;1:299–314. [Google Scholar]
- 74.Trost SG, McIver KL, Pate RR. Conducting accelerometer-based activity assessments in field-based research. Med Sci Sports Exerc 2005;37:S531–43. 10.1249/01.mss.0000185657.86065.98 [DOI] [PubMed] [Google Scholar]
- 75.Evenson KR, Catellier DJ, Gill K, et al. Calibration of two objective measures of physical activity for children. J Sports Sci 2008;26:1557–65. 10.1080/02640410802334196 [DOI] [PubMed] [Google Scholar]
- 76.Dupont WD, Plummer WD. Power and sample size calculations. A review and computer program. Control Clin Trials 1990;11:116–28. 10.1016/0197-2456(90)90005-m [DOI] [PubMed] [Google Scholar]
- 77.Barbour R, Kitzinger J, Developing focus group research: Politics, theory and practice. Longon, UK: SAGE, 1999. [Google Scholar]
- 78.Rossman GB, Numbers WBL. And words: combining quantitative and qualitative methods in a single large-scale evaluation study. Eval Rev 1985;9:627–43. [Google Scholar]
- 79.Elwood S. Mixed methods: Thinking, doing, and asking in multiple ways : DeLyser D, Crang M, McDowell L, et al., The Handbook of qualitative geography. London: Sage Publications, 2009. [Google Scholar]
- 80.Braun V, Clarke V. Using thematic analysis in psychology. Qual Res Psychol 2006;3:77–101. 10.1191/1478088706qp063oa [DOI] [Google Scholar]
Associated Data
This section collects any data citations, data availability statements, or supplementary materials included in this article.