

Abstract
Background
The preoperative prediction of muscular invasion status is important for adequately treating bladder cancer (BC) but nevertheless, there are some existing dilemmas in the current preoperative diagnostic accuracy of BC with muscular invasion. Here, we investigated the potential association between the fluorescence in situ hybridization (FISH) assay and muscular invasion among patients with BC. A cytogenetic‐clinical nomogram for the individualized preoperative differentiation of muscle‐invasive BC (MIBC) from non‐muscle‐invasive BC (NMIBC) is also proposed.
Methods
All eligible BC patients were preoperatively tested using a FISH assay, which included 4 sites (chromosome‐specific centromeric probe [CSP] 3, 7, and 17, and gene locus‐specific probe [GLP]‐p16 locus). The correlation between the FISH assay and BC muscular invasion was evaluated using the Chi‐square tests. In the training set, univariate and multivariate logistic regression analyses were used to develop a cytogenetic‐clinical nomogram for preoperative muscular invasion prediction. Then, we assessed the performance of the nomogram in the training set with respect to its discriminatory accuracy and calibration for predicting muscular invasion, and clinical usefulness, which were then validated in the validation set. Moreover, model comparison was set to evaluate the discrimination and clinical usefulness between the nomogram and the individual variables incorporated in the nomogram.
Results
Muscular invasion was more prevalent in BC patients with positive CSP3, CSP7 and CSP17 status (OR [95% CI], 2.724 [1.555 to 4.774], P < 0.001; 3.406 [1.912 to 6.068], P < 0.001 and 2.483 [1.436 to 4.292], P = 0.001, respectively). Radiology‐determined tumor size, radiology‐determined clinical tumor stage and CSP7 status were identified as independent risk factors of BC muscular invasion by the multivariate regression analysis in the training set. Then, a cytogenetic‐clinical nomogram incorporating these three independent risk factors was constructed and was observed to have satisfactory discrimination in the training (AUC 0.784; 95% CI: 0.715 to 0.853) and validation (AUC 0.743; 95% CI: 0.635 to 0.850) set. The decision curve analysis (DCA) indicated the clinical usefulness of our nomogram. In models comparison, using the receiver operator characteristic (ROC) analyses, the nomogram showed higher discriminatory accuracy than any variables incorporated in the nomogram alone and the DCAs also identified the nomogram as possessing the highest net benefits at wide range of threshold probabilities.
Conclusion
CSP7 status was identified as an independent factor for predicting muscular invasion in BC patients and was successfully incorporated in a clinical nomogram combining the results of the FISH assay with clinical risk factors.
Keywords: chromosome aneuploidy, fluorescence in situ hybridization, muscular invasion, nomogram, preoperative prediction, urinary bladder neoplasms
Abbreviations
- AUC
area under the curve
- BC
bladder cancer
- CI
confidence interval
- CSP
chromosome‐specific centromeric probe
- CT
computed tomography
- DCA
decision curve analysis
- FISH
fluorescence in situ hybridization
- FITC
fluorescein isothiocyanate
- GLP
gene locus‐specific probe
- MIBC
muscle‐invasive bladder cancer
- MRI
magnetic resonance imaging
- NMIBC
non‐muscle‐invasive bladder cancer
- OR
odds ratio
- RBC
red blood cell
- RC
radical cystectomy
- ROC
receiver operator characteristic
- TURBT
transurethral resection of bladder tumor
1. INTRODUCTION
Bladder cancer (BC) is an important health problem with burdening medical and socioeconomic consequences. It is the ninth most common cancer and ranks 13th as the cause of cancer‐related mortality worldwide [1, 2]. Nearly 75% of the patients present with non‐muscle‐invasive disease (NMIBC), while the remaining 25% present with muscle‐invasive BC (MIBC) [3]. Patients with NMIBC have an excellent prognosis with a 5‐year overall survival rate of approximately 90%, whereas those with MIBC have an inferior prognosis with a 5‐year overall survival of 66%, despite radical surgery [3, 4].
The management of BC depends mostly on the tumor stage and histological grade. Transurethral resection of bladder tumor (TURBT) with adjuvant treatment is the standard therapeutic regime for treating NMIBC [5]. However, radical cystectomy (RC) is considered the standard treatment for localized MIBC, and neoadjuvant and adjuvant chemotherapy have also shown benefits in improving the prognoses of these patients [4]. If clinicians could preoperatively differentiate MIBC from NMIBC, an optimal timely treatment could be implemented which would improve the patient's outcome. Otherwise, a misdiagnosis between MIBC and NMIBC could lead to consequential undertreatment or overtreatment.
The diagnosis and clinical staging of BC are mainly based on cystoscopy and pathologic results of biopsy or resected tissue [4, 5]. Moreover, cystoscopy is also indispensable to the follow‐up of BC [5]. However, several literature studies have reported that up to 68.3% of patients with BC may present clinical to pathological stage discrepancy due to variations in performing biopsy or resection [6, 7, 8]. Since these methods are invasive, uncomfortable, costly and carry a risk of infection as well [9], computed tomography (CT) and magnetic resonance imaging (MRI) are also recommended for the diagnosis and staging of BC [10]. MRI provides favorable soft‐tissue resolution, and better discrimination between diagnosis of MIBC and NMIBC than CT [11]. However, the diagnostic accuracy of MRI is still less than satisfactory, with a reported range between 64.7% and 83% [12, 13, 14, 15].
Some other noninvasive methods have been developed for assisting the diagnosis of BC, such as cytologic urinalysis. However, these tests have insufficient sensitivity in the early stages of the disease [16, 17]. Another promising noninvasive method is the fluorescence in situ hybridization (FISH), which was developed for detecting BC in urine specimens as it can identify cytogenetic alterations that can occur in BC [18]. In previous studies, it was found that the homozygous deletion of p16 locus at 9p21 was one of the most common genetic alterations in the early stages of BC [19, 20]. Several studies have revealed that a high sensitivity and specificity for the detection of BC cells in exfoliated cells from voided or washing urine samples could be achieved by complex detection of p16 locus loss and aneuploidy by chromosomes 3, 7, and 17 [21, 22]. The fluorescent labels to these chromosomes are subsequently included in many FISH commercial assays. Also, since it has been observed that the sensitivity of FISH analysis is increased with higher tumor grade [23], we thereby hypothesized that there might be a correlation between the results of FISH analysis and the muscular invasion of BC. Hence, the objective of this study was to investigate the existence of such correlation and if indeed present, we intended to incorporate the results of FISH analysis and associated clinical predictors to devise a user‐friendly cytogenetic‐clinical nomogram for the preoperative differentiation of MIBC from NMIBC.
2. MATERIALS AND METHODS
2.1. Patients
The Institutional Review Board of Sun Yat‐sen Memorial Hospital approved this retrospective study and waived the need to obtain informed consent from the patients. We reviewed the electronic medical records for 671 patients with BC who underwent RC or TURBT for bladder cancer at Sun Yat‐sen Memorial Hospital (Guangzhou, Guangdong, China) between August 2016 and August 2019. Patients were excluded from the final analysis for the following reasons: absence of preoperative FISH assay results, absence of preoperative imaging data, no muscular tissue in the retrieved specimen after TURBT (with the exception of Ta & Low‐grade or Ta & Grade 1 tumors, tumor grade was assessed based on the 2004 WHO classification and 1973 WHO classification, respectively), missing description in the pathological result regarding the presence of muscular tissue in the retrieved specimen (with the exception of Ta & Low‐grade or Ta & Grade 1 tumors), presence of non‐urothelial carcinoma, and presence of carcinoma in situ. Among the enrolled patients, patients treated between August 2016 and December 2018 were classified in a training set and those treated between January 2019 and August 2019 were classified in a validation set. The patient recruitment pathway is detailed in Figure 1.
FIGURE 1.
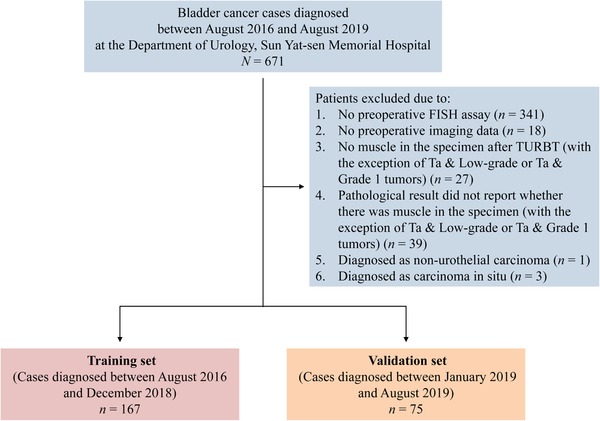
Enrollment illustration of patients with bladder cancer. FISH: fluorescence in situ hybridization; TURBT: transurethral resection of bladder tumor
Baseline characteristics of the patients, including age, sex, urinalysis red blood cell (RBC) count, surgical method, preoperative imaging examination data (CT or MRI), pathologic T stage and the results of the FISH assay were obtained from the patients’ medical records. Pathologic tumor staging was performed based on the Union for International Cancer Control 8th edition TNM staging system [24]. For patients who underwent RC and TURBT, their tumor staging was based on the specimen which had the higher pathological stage.
2.2. FISH analysis
The collection of urine samples for the FISH assay was performed preoperatively in the morning (the first urination of the day). For FISH studies, voided urine samples were centrifuged at 1500 rpm for 10 minutes to collect cell pellets. Then, the cells were resuspended in phosphate‐buffered saline solution, followed by incubation in a hypotonic solution of potassium chloride (0.075 mol/L), and subsequently fixed with fixative (methanol acetic acid [3:1]). Slides made from the voided urine samples were prepared for the FISH assay (GP Medical Technologies, Ltd, Beijing, China).
Chromosome‐specific centromeric probe (CSP) 3, 7, and 17, and gene locus‐specific probe (GLP)‐p16 (9p21) locus (GP Medical Technologies, Ltd, Beijing, China) were used in the FISH assay. Two DNA probes (GP Medical Technologies) were mixed as a set double‐target FISH probe (GP Medical Technologies) and paired as follows: chromosome 3 and chromosome 7, chromosome 17 and p16. Rhodamine and fluorescein isothiocyanate (FITC) (GP Medical Technologies) were used for labeling, resulting in red (rhodamine) and green (FITC) fluorescence signals in the hybridized samples.
Pretreatment of specimen slides, hybridization of fluorescent‐labeled DNA probes and complementary DNA, post‐hybridization washes and counterstaining were performed according to the guidelines of the manufacturer (GP Medical Technologies). Visualization of the signals was accomplished using a computer applied imaging system (IMSTAR S.A., Paris, France). For each probe, 100 nuclei were evaluated. Positivity of the FISH site was reported when aneuploidy by chromosomes 3, 7, 17 or p16 locus loss was detected during the FISH assay. Representative positive and negative FISH assay images are presented in Figure 2.
FIGURE 2.
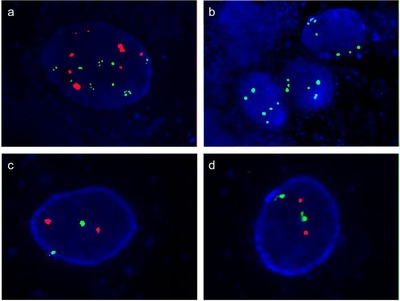
Representative images of FISH assay. (a) An example of chromosome 3 aneuploidy (green signals) and chromosome 7 aneuploidy (red signals) in the FISH image (magnification: × 1000). (b) An example of chromosome 17 aneuploidy (green signals) and p16 locus loss (no red signal) in the FISH image (magnification: × 1000). (c) An example of the normal status of chromosome 3 (green signals) and chromosome 7 (red signals) in the FISH image (magnification: × 1000). (d) An example of the normal status of chromosome 17 (green signals) and p16 locus (red signals) in the FISH image (magnification: × 1000). FISH: fluorescence in situ hybridization
2.3. Exploration of the correlation between FISH assay and tumor muscular invasion
In all enrolled patients, pie plots and bar plots were used to demonstrate the distribution results of the FISH assay and the association among the four FISH sites. We also utilized the Chi‐square tests to evaluate the correlation between the FISH analysis and BC muscular invasion.
2.4. Cytogenetic‐clinical nomogram construction and performance assessment
The results of FISH assay and other clinical candidate predictors were tested using the logistic regression algorithm in the training set. All variables that were significant (P < 0.05) in the univariate analyses were included in the subsequent multivariate logistic regression analysis. Backward stepwise selection using the Akaike Information Criterion was applied to select the independent predictors for constructing the prediction model. Then, we developed a cytogenetic‐clinical nomogram based on the result of the multivariate logistic regression.
The performance of the cytogenetic‐clinical nomogram was evaluated with respect to its discrimination and calibration in the training set. The area under the curve (AUC) of the receiver operator characteristic (ROC) was used to evaluate the discrimination of the model. Calibration was assessed with a calibration curve along with the Hosmer‐Lemeshow test to evaluate the goodness‐of‐fit of the nomogram [25].
Finally, decision curve analysis (DCA) was performed to determine the clinical usefulness of the nomogram by calculating the net benefits at different threshold probabilities [26, 27].
2.5. Validation of the cytogenetic‐clinical nomogram
Validation of the cytogenetic‐clinical nomogram was performed using the data from the validation set. The logistic regression formula constructed in the training set was applied to all patients of the validation set. Then, the performance of the nomogram was also examined by evaluating its calibration (calibration curve), discrimination (AUC) and clinical usefulness (DCA).
2.6. Models comparison
In the whole study cohort, models comparison was set to evaluate the discrimination and clinical usefulness between the cytogenetic‐clinical nomogram and the variables incorporated in the nomogram alone. ROC curves and DCA plots were plotted. Comparison between AUC values was performed using the Delong test [28].
2.7. Statistical analysis
All statistical analyses were performed using the R statistical software, version 3.5.1 (R Foundation for Statistical Computing; statistical https://www.r-project.org/). Logistic regression algorithm, nomogram construction and calibration plots were conducted using the “rms” package. The ROC curve was plotted using the “pROC” package. The Hosmer‐Lemeshow test was performed using the “vcdExtra” package. DCA was performed with the “dca.R” function. All statistical tests were 2‐tailed, and P < 0.05 were considered statistically significant.
3. RESULT
3.1. Characteristics of the training and validation sets
The final study cohort was composed of 242 patients. Among them, 167 patients were allocated to the training set, and 75 patients were allocated to the validation set. The characteristics and results of the FISH assay of the patients with BC in the training and validation sets are summarized in Table 1. The incidence of MIBC (pT2‐4) in the two sets was well‐balanced (44.3% and 41.3% in the training and validation sets, respectively, P = 0.666). There were also no significant differences in other clinical factors between the two datasets (P = 0.094 to 0.814) except for radiology‐determined tumor size (P = 0.011).
TABLE 1.
Baseline characteristics of the investigated patients in the training and validation sets (n = 242)
| Characteristic | Training set (n = 167, %) | Validation set (n = 75, %) | P * |
|---|---|---|---|
| Sex | 0.231 | ||
| Male | 142 (85.0) | 68 (90.7) | |
| Female | 25 (15.0) | 7 (9.3) | |
| Age, years | 0.149 | ||
| Median (Interquartile range) | 63.0 (56.5‐71.0) | 65.0 (60.5‐73.5) | |
| Urinalysis RBC count | 0.597 | ||
| Normal | 35 (21.0) | 18 (24.0) | |
| Abnormal | 132 (79.0) | 57 (76.0) | |
| Radiology‐determined tumor size, cm | 0.011 | ||
| < 3 | 105 (62.9) | 34 (45.3) | |
| ≥ 3 | 62 (37.1) | 41 (54.7) | |
| Radiology‐determined number of tumors | 0.094 | ||
| Single | 108 (64.7) | 40 (53.3) | |
| Multiple | 59 (35.3) | 35 (46.7) | |
| Radiology‐determined clinical tumor (cT) stage | 0.814 | ||
| cTa, cT1 | 102 (61.1) | 47 (62.7) | |
| cT2‐4 | 65 (38.9) | 28 (37.3) | |
| CSP3 status | 0.172 | ||
| Positive | 111 (66.5) | 43 (57.3) | |
| Negative | 56 (33.5) | 32 (42.7) | |
| CSP7 status | 0.145 | ||
| Positive | 112 (67.1) | 43 (57.3) | |
| Negative | 55 (32.9) | 32 (42.7) | |
| CSP17 status | 0.139 | ||
| Positive | 108 (64.7) | 41 (54.7) | |
| Negative | 59 (35.3) | 34 (45.3) | |
| GLP‐p16 status | 0.450 | ||
| Positive | 35 (21.0) | 19 (25.3) | |
| Negative | 132 (79.0) | 56 (74.7) | |
| Surgical method | 0.354 | ||
| RC | 82 (49.1) | 32 (42.7) | |
| TURBT | 85 (50.9) | 43 (57.3) | |
| Pathologic tumor (pT) stage | 0.666 | ||
| pTa, pT1 | 93 (55.7) | 44 (58.7) | |
| pT2‐4 | 74 (44.3) | 31 (41.3) |
P value was obtained from the univariate association analysis between the two data sets. Unless otherwise specified, data are numbers of patients, with percentages in parentheses. Categorical variables were compared using Pearson's χ² test. Continuous variables were compared using the Mann‐Whitney U test.
Abbreviations: RBC, red blood cell; CSP, chromosome‐specific centromeric probe; GLP, gene locus‐specific probe; RC, radical cystectomy; TURBT, transurethral resection of bladder tumor.
3.2. Exploration of the correlation between FISH assay and tumor muscular invasion
For the entire study cohort, the distributions of the results of the four FISH sites are shown as pie plots of Figure 3a. The incidence of aneuploidy by chromosomes 3, 7, 17, and p16 locus loss was 64%, 64%, 62%, and 22%, respectively. In addition, various kinds of the FISH positive sites combination were detected. Aneuploidy by chromosomes 3, 7, and 17 were simultaneously detected in the majority of cases without abnormality at the p16 locus (Figure 3b).
FIGURE 3.
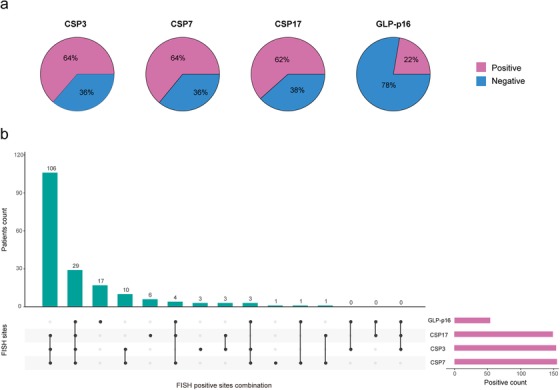
Pie plots and bar plots showing the distribution results of the FISH assay in whole study cohort. (a) Pie plots depicting the distributions of the status of FISH sites in the whole study cohort. (b) The horizontal bars (red) represent the positive count of each FISH site. The rectangular area under the x‐axis shows the various kinds of the FISH positive sites combination. The black dots denote the positive results of the FISH sites, and each column represents a specific combination. The corresponding vertical bars (green) represent the patient count for the specific combination. For instance, the first green bar indicates that there were 106 patients with a FISH result where CSP3 status, CSP7 status, and CSP17 status are positive. FISH: fluorescence in situ hybridization; CSP: chromosome‐specific centromeric probe; GLP: gene locus‐specific probe
Figure 4a‐c shows that chromosomes 3, 7 and 17 aneuploidy had significant relationship with muscular invasion (Chi‐square test, P < 0.001, P < 0.001 and P = 0.001, respectively), while p16 locus loss did not have such relationship (Chi‐square test, P = 0.285) (Figure 4d). To be specific, patients who suffered aneuploidy of chromosomes 3, 7 or 17 were more likely to have MIBC (OR [95% CI], 2.724 [1.555 to 4.774], P < 0.001; 3.406 [1.912 to 6.068], P < 0.001 and 2.483 [1.436 to 4.292], P = 0.001, respectively) (Figure 4a‐c).
FIGURE 4.

Bar plots showing the correlations between the results of each FISH site and tumor muscular invasion in whole study cohort. FISH: fluorescence in situ hybridization; CSP: chromosome‐specific centromeric probe; GLP: gene locus‐specific probe; MIBC: muscle‐invasive bladder cancer; NMIBC: non‐muscle‐invasive bladder cancer; OR: odds ratio; CI: confidence interval
3.3. Cytogenetic‐clinical nomogram construction and performance assessment
Six candidate variables, including urinalysis RBC count, radiology‐determined tumor size, radiology‐determined clinical tumor (cT) stage, CSP3 status, CSP7 status, and CSP17 status (all P < 0.05) were significantly associated with muscular invasion in BC in the univariate logistic regression analyses (Table 2). Among them, radiology‐determined tumor size (P = 0.023), radiology‐determined cT stage (P < 0.001) and CSP7 status (P = 0.001) were identified as independent risk factors for BC muscular invasion by the subsequent multivariate regression analysis (Table 2). Thereafter, a cytogenetic‐clinical nomogram was developed by incorporating these three predictors (Figure 5).
TABLE 2.
Univariate and multivariate logistic regression analysis of the result of FISH assay and clinical candidate predictors in the training set
| Variables | Univariate analysis | Multivariate analysis | ||
|---|---|---|---|---|
| OR (95% CI) | P | OR (95% CI) | P | |
| Sex (male vs. female) | 1.439 (0.611 to 3.413) | 0.403 | – | – |
| Age, years (continuous) | 1.005 (0.979 to 1.031) | 0.726 | – | – |
| Urinalysis RBC count (normal vs. abnormal) | 2.803 (1.259 to 6.750) | 0.015 * | – | – |
| Radiology‐determined tumor size, cm (< 3 vs. ≥ 3) | 3.391 (1.776 to 6.616) | <0.001 * | 2.316 (1.124 to 4.822) | 0.023 * |
| Radiology‐determined number of tumors (single vs. multiple) | 0.885 (0.464 to 1.677) | 0.709 | – | – |
| Radiology‐determined clinical tumor (cT) stage (cTa, cT1 vs. cT2‐4) | 5.951 (2.951 to 12.687) | <0.001 * | 5.579 (2.631 to 12.490) | <0.001 * |
| CSP3 status (negative vs. positive) | 2.736 (1.393 to 5.563) | 0.004 * | – | – |
| CSP7 status (negative vs. positive) | 3.379 (1.691 to 7.067) | <0.001 * | 3.580 (1.662 to 8.081) | 0.001 * |
| CSP17 status (negative vs. positive) | 2.453 (1.269 to 4.877) | 0.009 * | – | – |
| GLP‐p16 status (negative vs. positive) | 0.688 (0.313 to 1.464) | 0.338 | – | – |
Abbreviations: CI, confidence interval; OR, odds ratio; RBC, red blood cell; CSP, chromosome‐specific centromeric probe; GLP, gene locus‐specific probe.
P < 0.05
FIGURE 5.
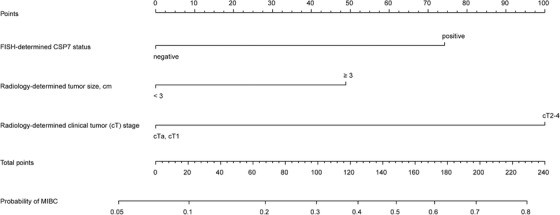
Cytogenetic‐clinical nomogram for predicting the probability of muscular invasion in patients with bladder cancer. The range of the total points for the nomogram is 0 to 223.1. CSP: chromosome‐specific centromeric probe; MIBC: muscle‐invasive bladder cancer
The nomogram showed favorable discrimination with an AUC of 0.784 (95% CI: 0.715 to 0.853) in the training set (Figure 6a). The calibration curve suggested good agreement between model prediction and actual observation in the training set (Figure 6c). Besides, the Hosmer‐Lemeshow test yielded a nonsignificant P value of 0.802, indicating good calibration power.
FIGURE 6.
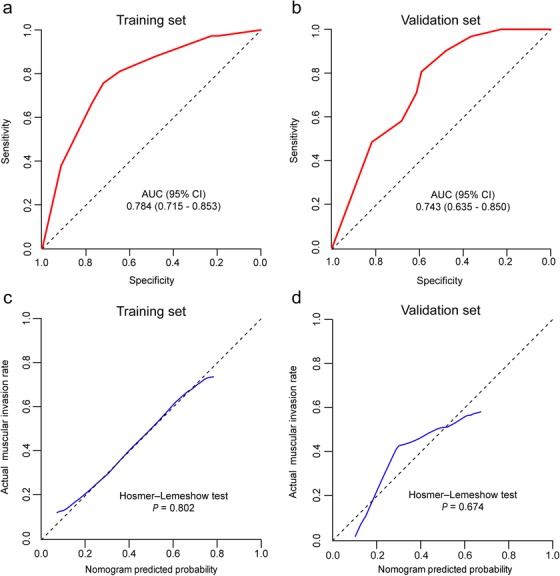
Discrimination and calibration of the cytogenetic‐clinical nomogram for determining muscular invasion in the bladder cancer patients. Receiver operator characteristic curve of the cytogenetic‐clinical nomogram in the training set (a) and validation set (b). Calibration curve of the cytogenetic‐clinical nomogram in the training set (c) and validation set (d). For the calibration curve, the y‐axis represents the actual observed muscular invasion probabilities, and the x‐axis represents nomogram‐predicted probabilities. The calibration curve shows how well the predicted probabilities agreed with the observed probabilities. The diagonal black dash line represents a perfect prediction by an ideal model, and the blue solid line represents the predictive performance of the nomogram. The solid line has a closer fit to the dashed line, which indicates a better prediction. AUC: area under the curve; CI: confidence interval
The DCA result for the nomogram in the training set is presented in Figure 7a. The DCA showed that if the threshold probabilities for clinicians or patients ranged between 11% and 79%, using the cytogenetic‐clinical nomogram to make the decision of whether to undergo treatment added more net benefit than treating either all patients or none in the training set in this study. In other words, our nomogram highlighted its value as a promising tool for governing clinical decision‐making.
FIGURE 7.
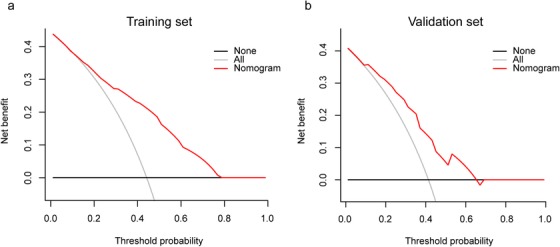
Decision curve analyses depicting the clinical net benefit of the cytogenetic‐clinical nomogram. (a) The decision curve analysis for the cytogenetic‐clinical nomogram in the training set. (b) The decision curve analysis for the cytogenetic‐clinical nomogram in the validation set. The x‐axis shows the threshold probability. Threshold probability was defined as the minimum probability of disease at which further intervention would be warranted. The y‐axis represents the net benefit, which is calculated across a range of threshold probabilities. Net benefit = sensitivity × prevalence – (1 – specificity) × (1 – prevalence) × w, where w is the odds at the threshold probability. The horizontal solid black line represents the assumption that no patients with muscular invasion were involved, and the solid gray line represents the assumption that all patients had muscular invasion. The solid red line represents the cytogenetic‐clinical nomogram
3.4. Validation of the cytogenetic‐clinical nomogram
The satisfactory discrimination of the nomogram was confirmed using the validation set, with an AUC of 0.743 (95% CI: 0.635 to 0.850) (Figure 6b). Good calibration was also observed in the validation set, with a nonsignificant P value of 0.674 derived from the Hosmer‐Lemeshow test (Figure 6d). The DCA demonstrated that when the threshold probabilities ranged between 9% and 66%, the cytogenetic‐clinical nomogram also showed a higher net benefit in the validation set (Figure 7b).
3.5. Models comparison
Figure 8a presents the results of the ROC analyses. Delong tests were used to compare the discrimination of the cytogenetic‐clinical nomogram with the variables incorporated in the nomogram alone. The cytogenetic‐clinical nomogram showed higher discriminatory accuracy for predicting muscular invasion in patients with BC than any variables incorporated in the nomogram alone (P < 0.001).
FIGURE 8.
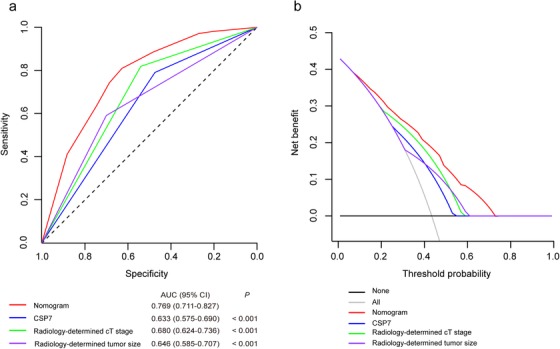
Models comparison in the whole study cohort. (a) Receiver operator characteristic curves of the models are presented to compare their discriminatory accuracy for predicting muscular invasion. P values show the AUC for the cytogenetic‐clinical nomogram versus the AUCs for other variables incorporated in the nomogram alone. (b) Decision curve analyses comparing the net benefit of the cytogenetic‐clinical nomogram versus the other variables incorporated in the nomogram alone are shown. CSP: chromosome‐specific centromeric probe; AUC: area under the curve; CI: confidence interval
We also applied the DCAs to compare the performance of the models with respect to their clinical usefulness. These analyses revealed that the cytogenetic‐clinical nomogram had a higher overall net benefit than the models containing risk factors incorporated in the nomogram alone across wide range of threshold probabilities (Figure 8b).
4. DISCUSSION
In this study, we identified that BC patients with positive FISH sites status, including CSP3, CSP7, and CSP17, were more likely to have muscular invasion. A diagnostic nomogram model based on the results of the FISH assay and clinical predictors was developed and successfully validated to predict the individualized risk of muscular invasion in patients with BC. This cytogenetic‐clinical model demonstrated favorable diagnostic accuracy to predict muscular invasion of BC.
Whether BC infiltrates the muscular layer is a crucial factor for clinicians in order to choose the optimal therapeutic regimen for the patients. Currently, the histological evaluation of resected or biopsy tissue and imaging are recommended for preoperative BC staging. However, some dilemmas still exist, such as unsatisfactory diagnostic accuracy [4, 5, 11, 12, 13]. Additionally, the quality of the biopsy or resection in TURBT depends on whether detrusor muscle presents in the specimen, which is also dependent on surgeon experience [29]. Thus, even preoperative histological evaluation presents some uncertain problems. Many studies have also revealed that understaging or upstaging errors in patients with BC are common in clinical practice and may result in a significantly higher risk of disease progression or recurrence and cancer‐specific death [6, 7, 8, 30]. This observation may be due to a delay or omission in offering optimal management [6, 31]. For instance, if a patient with MIBC is understaged with NMIBC, then optimal management such as neoadjuvant chemotherapy and RC, could not be implemented in time. Such misdiagnosis may lead to a poor clinical outcome because MIBC is frequently associated with progression to metastatic disease [3]. Therefore, accurate staging at the time of diagnosis can optimize disease treatment and improve patient outcome.
As an alternative technique to the current diagnosis pattern, the FISH assay has been reported to be a promising tool for diagnosing and surveilling in BC [32]. Compared to invasive methods, such as cystoscopy and TURBT, the FISH assay possesses advantages, including noninvasiveness, comfort and safety, since performing this assay only needs to collect urine samples from patients [9, 33]. Although the conventional urine cytology test has high specificity, the sensitivity of the test stays low, especially for low‐grade tumors, with reported sensitivity ranged from 39.2 to 75.6%; specificity ranged from 82.8 to 97.1% [17, 34, 35, 36, 37]. Nevertheless, FISH assay has higher sensitivity in the detection of BC, with reported sensitivity ranging from 63% to 85% [17, 23, 38], and performs as an auxiliary tool for detecting BC in patients with equivocal or negative cystoscopy and atypical cytology [39]. In this study, we identified CSP3, CSP7, and CSP17 to be associated with muscular invasion in BC patients except for GLP‐p16. Moreover, the positivity of CSP7 was found to serve as an independent predictor for muscular invasiveness of BC. In previous studies, the researchers also found that CSP7 and CSP17 were associated with BC muscular invasion [40, 41]. The possible mechanism of this phenomenon is that there may be genes on chromosome 7 and chromosome 17 (for example, epidermal growth factor receptor and c‐erb‐B2, respectively) which may present in extra copy number, leading to increased tumor proliferation [42, 43, 44]. In another study by Berggren et al., the researchers identified no association between the occurrence of p16 locus loss and BC muscular invasion [45], which is consistent with our findings. Nevertheless, the relationship between CSP3 and muscular invasion in BC has not yet been reported. We hypothesize that this could be related to the limited number of patients investigated or population ethnicity. Hence, future studies are awaited to explain this discrepancy.
In addition to the status of CSP7, the other independent clinical predictors, including radiology‐determined tumor size and radiology‐determined cT stage, were incorporated to achieve a more comprehensive model in our study, the cytogenetic‐clinical nomogram, thus improving the prediction efficacy. Indeed, the association between bladder tumor size and tumor stage has been reported. Larger tumors are more likely to have deeper penetration [46, 47], and tumor size was identified an independent clinical predictor for predicting muscular invasion in patients with BC [48]. Moreover, bladder tumor size is also used as a factor in risk group stratification for NMIBC [5]. Meanwhile, the tumor size in the validation set was relatively larger in our study (P = 0.011, Table 1). Such phenomenon may be illustrated by the fact that the proportion of patients who underwent RC in the validation set was relatively higher than that in the training set. Although a significant difference was found in the radiology‐determined tumor size between the two datasets, there was no significant difference in other baseline characteristics, which justified their use as training and validation sets. Although there was a significant difference in tumor size among the two datasets, the nomogram also performed well in the validation set, indicating that the proposed model has been verified and it is reasonable to believe that this difference has little effect to our study. The nomogram showed good calibration and discrimination in the training and validation sets and could be used as a tool to help identifying MIBC. Therefore, the main clinical utility of this nomogram could be to facilitate the decision on whether a patient requires treatment for MIBC by offering a risk of muscular invasion for reference.
In this study, we explored the association between aberrations of the FISH assay sites and muscular invasion in patients with BC. The CSP7 status was also identified as an independent risk factor for predicting muscular invasion in BC patients. In addition, a cytogenetic‐clinical nomogram incorporating the pertinent clinical factors was evaluated and internally validated. Since the variables incorporated in the nomogram are available from the imaging examination and the FISH assay, the presented nomogram may serve as a non‐invasive and user‐friendly tool for the prediction of muscular invasion in BC patients.
Despite the strengths, several limitations should be considered when interpreting these data. First, potential selection biases might occur because of the retrospective nature of the study. This is the analysis of banked urine samples collected from a single high‐volume center, so our study may not be representative of the general population at risk for muscle invasion of BC. Second, the nomogram was validated in participants from the same hospital, and the efficacy of the nomogram needs to be further validated in external and prospective studies. Third, the model only considered certain clinical factors. Future studies may consider incorporating other potential clinical risk factors, and even the other high‐throughput quantitative technologies to improve the prediction performance of the model.
5. CONCLUSION
We identified that the status of CSP7, a probe in the FISH assay, as an independent risk factor for muscular invasion in BC patients. A diagnostic model incorporating CSP7 status, and radiology‐determined clinical parameters such as tumor size and cT stage, was developed for preoperatively evaluating the risk of muscular invasion in patients with BC. The proposed model may provide a reliable noninvasive tool that can increase the accuracy of cT staging in patients with BC, which may aid in clinical decision‐making for treatment selection to improve patient outcome, but still awaits large multicenter validation for wide clinical practice implementation.
FUNDING
This study was supported by the National Key Research and Development Program of China (Grant No. 2018YFA0902803), the National Natural Science Foundation of China (Grant No. 81825016, 81961128027, 81772719, 81772728), the Key Areas Research and Development Program of Guangdong (Grant No. 2018B010109006), the Science and Technology Planning Project of Guangdong Province (Grant No. 2017B020227007), Guangdong Special Support Program (2017TX04R246), Project Supported by Guangdong Province Higher Vocational Colleges & Schools Pearl River Scholar Funded Scheme (for Tianxin Lin), special fund for basic scientific research operating expenses of Sun Yat‐sen university (19ykyjs29), Grant [2013]163 from Key Laboratory of Malignant Tumor Molecular Mechanism and Translational Medicine of Guangzhou Bureau of Science and Information Technology, Grant KLB09001 from the Key Laboratory of Malignant Tumor Gene Regulation and Target Therapy of Guangdong Higher Education Institutes, and Grants from the Guangdong Science and Technology Department (2017B030314026). The funders had no involvement in study design; in the collection, analysis, or interpretation of data; in the writing of the report; or in the decision to submit the paper for publication.
AVAILABILITY OF DATA AND MATERIALS
All data generated or analyzed during this study are included in this published article.
AUTHORS' CONTRIBUTIONS
TXL and JH had full access to all the data in the study and take responsibility for the integrity of the data and the accuracy of the data analysis.
Study concept and design: TXL, JH, XYD, JHC, JJZ, and JQK.
Acquisition and analysis of data: XYD, JJZ, JQK, SXW, HY, HH, WBX, XC, CRH, LFH and HDQ.
Drafting the manuscript: XYD, JHC, JJZ, JQK, SXW, HY, HH, XC and WBX.
Proofread the manuscript for important intellectual content: TXL, JH, HDQ, XYD, JJZ and JHC.
Approval of the final version manuscript: all authors.
Accountable for all aspects of the work: all authors.
ETHICS APPROVAL AND CONSENT TO PARTICIPATE
The Institutional Review Board of Sun Yat‐sen Memorial Hospital approved this retrospective study and waived the need to obtain informed consent from the patients.
COMPETING INTERESTS
The authors declare that they have no competing interests.
CONSENT FOR PUBLICATION
Not applicable.
ACKNOWLEDGMENTS
We thank Zhenfang Zhou from Cellular and Molecular Diagnostics Center in Sun Yat‐sen Memorial Hospital for providing detailed information about the reagents and equipment used in the FISH assay.
Diao X, Cai J, Zheng J, et al. Association of chromosome 7 aneuploidy measured by fluorescence in situ hybridization assay with muscular invasion in bladder cancer. Cancer Communications. 2020;40:167–180. 10.1002/cac2.12017
Contributor Information
Jian Huang, Email: huangj8@mail.sysu.edu.cn.
Tianxin Lin, Email: lintx@mail.sysu.edu.cn.
REFERENCES
- 1. Cumberbatch MGK, Jubber I, Black PC, Esperto F, Figueroa JD, Kamat AM, et al. Epidemiology of Bladder Cancer: A Systematic Review and Contemporary Update of Risk Factors in 2018. Eur Urol. 2018;74(6):784–95. [DOI] [PubMed] [Google Scholar]
- 2. Bray F, Ferlay J, Soerjomataram I, Siegel RL, Torre LA, Jemal A. Global cancer statistics 2018: GLOBOCAN estimates of incidence and mortality worldwide for 36 cancers in 185 countries. CA Cancer J Clin. 2018;68(6):394–424. [DOI] [PubMed] [Google Scholar]
- 3. Funt SA, Rosenberg JE. Systemic, perioperative management of muscle‐invasive bladder cancer and future horizons. Nat Rev Clin Oncol. 2017;14(4):221–34. [DOI] [PMC free article] [PubMed] [Google Scholar]
- 4. Alfred Witjes J, Lebret T, Comperat EM, Cowan NC, De Santis M, Bruins HM, et al. Updated 2016 EAU Guidelines on Muscle‐invasive and Metastatic Bladder Cancer. Eur Urol. 2017;71(3):462–75. [DOI] [PubMed] [Google Scholar]
- 5. Babjuk M, Burger M, Compérat EM, Gontero P, Mostafid AH, Palou J, et al. European Association of Urology Guidelines on Non‐muscle‐invasive Bladder Cancer (TaT1 and Carcinoma In Situ) ‐ 2019 Update. Eur Urol. 2019;76(5):639–57. [DOI] [PubMed] [Google Scholar]
- 6. Shariat SF, Palapattu GS, Karakiewicz PI, Rogers CG, Vazina A, Bastian PJ, et al. Discrepancy between clinical and pathologic stage: impact on prognosis after radical cystectomy. Eur Urol. 2007;51(1):137–51. [DOI] [PubMed] [Google Scholar]
- 7. Svatek RS, Shariat SF, Novara G, Skinner EC, Fradet Y, Bastian PJ, et al. Discrepancy between clinical and pathological stage: external validation of the impact on prognosis in an international radical cystectomy cohort. BJU Int. 2011;107(6):898–904. [DOI] [PubMed] [Google Scholar]
- 8. Turker P, Bostrom PJ, Wroclawski ML, van Rhijn B, Kortekangas H, Kuk C, et al. Upstaging of urothelial cancer at the time of radical cystectomy: factors associated with upstaging and its effect on outcome. BJU Int. 2012;110(6):804–11. [DOI] [PubMed] [Google Scholar]
- 9. Valenberg FJPv, Hiar AM, Wallace E, Bridge JA, Mayne DJ, Beqaj S, et al. Prospective Validation of an mRNA‐based Urine Test for Surveillance of Patients with Bladder Cancer. Eur Urol. 2019;75(5):853–60. [DOI] [PubMed] [Google Scholar]
- 10. Lam TBL. Optimizing the diagnosis of pelvic lymph node metastasis in bladder cancer using computed tomography and magnetic resonance imaging. Cancer communications (London, England: ). 2018;38(1):2. [DOI] [PMC free article] [PubMed] [Google Scholar]
- 11. McKibben MJ, Woods ME. Preoperative imaging for staging bladder cancer. Curr Urol Rep. 2015;16(4):22. [DOI] [PubMed] [Google Scholar]
- 12. Kobayashi S, Koga F, Yoshida S, Masuda H, Ishii C, Tanaka H, et al. Diagnostic performance of diffusion‐weighted magnetic resonance imaging in bladder cancer: potential utility of apparent diffusion coefficient values as a biomarker to predict clinical aggressiveness. Eur Radiol. 2011;21(10):2178–86. [DOI] [PubMed] [Google Scholar]
- 13. Daneshmand S, Ahmadi H, Huynh LN, Dobos N. Preoperative staging of invasive bladder cancer with dynamic gadolinium‐enhanced magnetic resonance imaging: results from a prospective study. Urology. 2012;80(6):1313–8. [DOI] [PubMed] [Google Scholar]
- 14. Wu L‐M, Chen X‐X, Xu J‐R, Zhang X‐F, Suo S‐T, Yao Q‐Y, et al. Clinical value of T2‐weighted imaging combined with diffusion‐weighted imaging in preoperative T staging of urinary bladder cancer: a large‐scale, multiobserver prospective study on 3.0‐T MRI. Acad Radiol. 2013;20(8):939–46. [DOI] [PubMed] [Google Scholar]
- 15. Rajesh A, Sokhi HK, Fung R, Mulcahy KA, Bankart MJG. Bladder cancer: evaluation of staging accuracy using dynamic MRI. Clin Radiol. 2011;66(12):1140–5. [DOI] [PubMed] [Google Scholar]
- 16. Grossman HB, Messing E, Soloway M, Tomera K, Katz G, Berger Y, et al. Detection of bladder cancer using a point‐of‐care proteomic assay. JAMA. 2005;293(7):810–6. [DOI] [PubMed] [Google Scholar]
- 17. Placer J, Espinet B, Salido M, Solé F, Gelabert‐Mas A. Clinical utility of a multiprobe FISH assay in voided urine specimens for the detection of bladder cancer and its recurrences, compared with urinary cytology. Eur Urol. 2002;42(6):547–52. [DOI] [PubMed] [Google Scholar]
- 18. Halling KC, Kipp BR. Bladder cancer detection using FISH (UroVysion assay). Adv Anat Pathol. 2008;15(5):279–86. [DOI] [PubMed] [Google Scholar]
- 19. Orlow I, Lacombe L, Hannon GJ, Serrano M, Pellicer I, Dalbagni G, et al. Deletion of the p16 and p15 genes in human bladder tumors. J Natl Cancer Inst. 1995;87(20):1524–9. [DOI] [PubMed] [Google Scholar]
- 20. Cairns P, Shaw ME, Knowles MA. Initiation of bladder cancer may involve deletion of a tumour‐suppressor gene on chromosome 9. Oncogene. 1993;8(4):1083–5. [PubMed] [Google Scholar]
- 21. Sokolova IA, Halling KC, Jenkins RB, Burkhardt HM, Meyer RG, Seelig SA, et al. The development of a multitarget, multicolor fluorescence in situ hybridization assay for the detection of urothelial carcinoma in urine. J Mol Diagn. 2000;2(3):116–23. [DOI] [PMC free article] [PubMed] [Google Scholar]
- 22. Sarosdy MF, Schellhammer P, Bokinsky G, Kahn P, Chao R, Yore L, et al. Clinical evaluation of a multi‐target fluorescent in situ hybridization assay for detection of bladder cancer. J Urol. 2002;168(5):1950–4. [DOI] [PubMed] [Google Scholar]
- 23. Chou R, Gore JL, Buckley D, Fu R, Gustafson K, Griffin JC, et al. Urinary Biomarkers for Diagnosis of Bladder Cancer: A Systematic Review and Meta‐analysis. Ann Intern Med. 2015;163(12):922–31. [DOI] [PubMed] [Google Scholar]
- 24. Brierley JD, Gospodarowicz MK, Wittekind C. TNM classification of malignant tumours: John Wiley & Sons; 2016. [Google Scholar]
- 25. Kramer AA, Zimmerman JE. Assessing the calibration of mortality benchmarks in critical care: The Hosmer‐Lemeshow test revisited. Crit Care Med. 2007;35(9):2052–6. [DOI] [PubMed] [Google Scholar]
- 26. Balachandran VP, Gonen M, Smith JJ, DeMatteo RP. Nomograms in oncology: more than meets the eye. Lancet Oncol. 2015;16(4):e173–e80. [DOI] [PMC free article] [PubMed] [Google Scholar]
- 27. Vickers AJ, Elkin EB. Decision curve analysis: a novel method for evaluating prediction models. Med Decis Making. 2006;26(6):565–74. [DOI] [PMC free article] [PubMed] [Google Scholar]
- 28. Demler OV, Pencina MJ, D'Agostino RB, Sr. Misuse of DeLong test to compare AUCs for nested models. Stat Med. 2012;31(23):2577–87. [DOI] [PMC free article] [PubMed] [Google Scholar]
- 29. Mariappan P, Zachou A, Grigor KM, Edinburgh Uro‐Oncology G. Detrusor muscle in the first, apparently complete transurethral resection of bladder tumour specimen is a surrogate marker of resection quality, predicts risk of early recurrence, and is dependent on operator experience. Eur Urol. 2010;57(5):843–9. [DOI] [PubMed] [Google Scholar]
- 30. Cumberbatch MGK, Foerster B, Catto JWF, Kamat AM, Kassouf W, Jubber I, et al. Repeat Transurethral Resection in Non‐muscle‐invasive Bladder Cancer: A Systematic Review. Eur Urol. 2018;73(6):925–33. [DOI] [PubMed] [Google Scholar]
- 31. Malavaud B. T1G3 bladder tumours: the case for radical cystectomy. Eur Urol. 2004;45(4):406–10. [DOI] [PubMed] [Google Scholar]
- 32. Soria F, Droller MJ, Lotan Y, Gontero P, D'Andrea D, Gust KM, et al. An up‐to‐date catalog of available urinary biomarkers for the surveillance of non‐muscle invasive bladder cancer. World J Urol. 2018;36(12):1981–95. [DOI] [PMC free article] [PubMed] [Google Scholar]
- 33. van der Aa MNM, Steyerberg EW, Sen EF, Zwarthoff EC, Kirkels WJ, van der Kwast TH, et al. Patients' perceived burden of cystoscopic and urinary surveillance of bladder cancer: a randomized comparison. BJU Int. 2008;101(9):1106–10. [DOI] [PubMed] [Google Scholar]
- 34. Glass RE, Coutsouvelis C, Sheikh‐Fayyaz S, Chau K, Rosen L, Brenkert R, et al. Two‐tiered subdivision of atypia on urine cytology can improve patient follow‐up and optimize the utility of UroVysion. Cancer Cytopathology. 2016;124(3):188–95. [DOI] [PubMed] [Google Scholar]
- 35. Zhang ML, Rosenthal DL, VandenBussche CJ. The cytomorphological features of low‐grade urothelial neoplasms vary by specimen type. Cancer Cytopathology. 2016;124(8):552–64. [DOI] [PubMed] [Google Scholar]
- 36. Bastacky S, Ibrahim S, Wilczynski SP, Murphy WM. The accuracy of urinary cytology in daily practice. Cancer. 1999;87(3):118–28. [DOI] [PubMed] [Google Scholar]
- 37. Bravaccini S, Casadio V, Gunelli R, Bucchi L, Zoli W, Amadori D, et al. Combining cytology, TRAP assay, and FISH analysis for the detection of bladder cancer in symptomatic patients. Annals of Oncology: Official Journal of the European Society for Medical Oncology. 2011;22(10):2294–8. [DOI] [PubMed] [Google Scholar]
- 38. Gudjónsson S, Isfoss BL, Hansson K, Domanski A‐M, Warenholt J, Soller W, et al. The value of the UroVysion assay for surveillance of non‐muscle‐invasive bladder cancer. Eur Urol. 2008;54(2):402–8. [DOI] [PubMed] [Google Scholar]
- 39. Schlomer BJ, Ho R, Sagalowsky A, Ashfaq R, Lotan Y. Prospective validation of the clinical usefulness of reflex fluorescence in situ hybridization assay in patients with atypical cytology for the detection of urothelial carcinoma of the bladder. J Urol. 2010;183(1):62–7. [DOI] [PubMed] [Google Scholar]
- 40. Ohta JI, Miyoshi Y, Uemura H, Fujinami K, Mikata K, Hosaka M, et al. Fluorescence in situ hybridization evaluation of c‐erbB‐2 gene amplification and chromosomal anomalies in bladder cancer. Clin Cancer Res. 2001;7(8):2463–7. [PubMed] [Google Scholar]
- 41. Sandberg AA, Berger CS. Review of chromosome studies in urological tumors. II. Cytogenetics and molecular genetics of bladder cancer. J Urol. 1994;151(3):545–60. [DOI] [PubMed] [Google Scholar]
- 42. Waldman FM, Carroll PR, Kerschmann R, Cohen MB, Field FG, Mayall BH. Centromeric copy number of chromosome 7 is strongly correlated with tumor grade and labeling index in human bladder cancer. Cancer Res. 1991;51(14):3807–13. [PubMed] [Google Scholar]
- 43. Collard JG, van de Poll M, Scheffer A, Roos E, Hopman AH, Geurts van Kessel AH, et al. Location of genes involved in invasion and metastasis on human chromosome 7. Cancer Res. 1987;47(24 Pt 1):6666–70. [PubMed] [Google Scholar]
- 44. Petrov SV, Malkhasyan KA, Ulyanin MY, Abdrakhmanov EF, Khasanov RS. The value of the preoperative FISH test in unscreened bladder cancer patients with TUR indications. Pathology Oncology Research: POR. 2012;18(4):1059–66. [DOI] [PubMed] [Google Scholar]
- 45. Berggren P, Kumar R, Sakano S, Hemminki L, Wada T, Steineck G, et al. Detecting homozygous deletions in the CDKN2A(p16(INK4a))/ARF(p14(ARF)) gene in urinary bladder cancer using real‐time quantitative PCR. Clin Cancer Res. 2003;9(1):235–42. [PubMed] [Google Scholar]
- 46. Sylvester RJ, van der Meijden AP, Oosterlinck W, Witjes JA, Bouffioux C, Denis L, et al. Predicting recurrence and progression in individual patients with stage Ta T1 bladder cancer using EORTC risk tables: a combined analysis of 2596 patients from seven EORTC trials. Eur Urol. 2006;49(3):466–5; discussion 75‐7. [DOI] [PubMed] [Google Scholar]
- 47. Stimson CJ, Cookson MS, Barocas DA, Clark PE, Humphrey JE, Patel SG, et al. Preoperative hydronephrosis predicts extravesical and node positive disease in patients undergoing cystectomy for bladder cancer. J Urol. 2010;183(5):1732–7. [DOI] [PubMed] [Google Scholar]
- 48. Zheng J, Kong J, Wu S, Li Y, Cai J, Yu H, et al. Development of a noninvasive tool to preoperatively evaluate the muscular invasiveness of bladder cancer using a radiomics approach. Cancer. 2019;125(24):4388–98. [DOI] [PubMed] [Google Scholar]
Associated Data
This section collects any data citations, data availability statements, or supplementary materials included in this article.
Data Availability Statement
All data generated or analyzed during this study are included in this published article.