Summary
Thyroglobulin is the protein precursor of thyroid hormones, which are essential for growth, development and control of metabolism in vertebrates1,2. Hormone synthesis from thyroglobulin (TG) occurs in the thyroid gland via the iodination and coupling of pairs of tyrosines and is completed by TG proteolysis3. Tyrosine proximity within TG is thought to enable the coupling reaction but hormonogenic tyrosines have not been clearly identified and the lack of a three-dimensional structure of TG has prevented mechanistic understanding4. Here we present the structure of full-length human thyroglobulin at ~3.5 Å resolution determined by electron cryomicroscopy (cryo-EM). We identified all hormonogenic tyrosine pairs in the structure and verified them via site-directed mutagenesis and in vitro hormone production assays using human TG expressed in HEK cells. Analysis revealed that proximity, flexibility and solvent exposure of the tyrosines are the key characteristics of hormonogenic sites. Transferring the reaction sites from TG to an engineered tyrosine donor-acceptor pair in the unrelated bacterial maltose binding protein (MBP) yielded hormone production with efficiency comparable to TG. Our study provides a framework to further understand the production and regulation of thyroid hormones.
Keywords: thyroglobulin, thyroxine, T3, T4, thyroid hormone, tyrosine iodination, cryo-EM
Tetraiodothyronine (thyroxine, T4) and triiodothyronine (T3) are iodine-containing thyroid hormones (TH) that regulate metabolism and many other fundamental processes in vertebrates1,5. T4 and smaller amounts of T3 are found in the bloodstream of healthy humans3, whereas suboptimal levels of TH have dramatic consequences for heart rate, brain function and foetal development. Approximately 5% of the world's human population suffer from thyroid diseases, but the molecular events behind TH synthesis are yet to be completely understood6.
TH synthesis is stimulated by TSH (thyroid stimulating hormone), itself produced in pituitary gland, to occur in the thyroid from the protein precursor thyroglobulin (TG). Iodide (I-) is accumulated in the thyroid both in the cytoplasm and lumen of thyroid follicular cells (colloid), into which TG is secreted in high amounts2,7. Two apical membrane enzymes dual oxidases (DUOX, producing H2O2) and thyroid peroxidase (TPO, oxidising iodide) allow the extracellular iodination of tyrosine residues within the TG protein substrate3,8. TG, a protein dimer of 600 kDa, has an unusually high number of ~ 60 disulfide bonds per monomer and 17 glycosylation sites, which confer remarkable stability and solubility to the protein1,2,9. Of ~30 iodinated tyrosines in TG per monomer (out of 66), only a small number are hormonogenic, i.e. are a substrate for TH formation. In the hormonogenic sites, after iodination, the aromatic ring of a donor di- (or mono-) iodo-tyrosine is transferred to a proximal acceptor di-iodo-tyrosine, thereby forming T4 (or T3) hormone, still connected to the polypeptide backbone, while leaving a dehydroalanine at the donor position10. After endocytosis from the colloid to cytoplasmic lysosomes, TG is proteolysed in follicular cells and releases free TH (Extended Data Figure 1)11,3. Furthermore, a thyroid dehalogenase (Dehal1) recycles iodide stored in non-hormonogenic iodotyrosines of TG12.
Mass spectrometry analyses of thyroid-extracted TG have identified four or more acceptor tyrosines, but the position of the donors has remained unclear13.
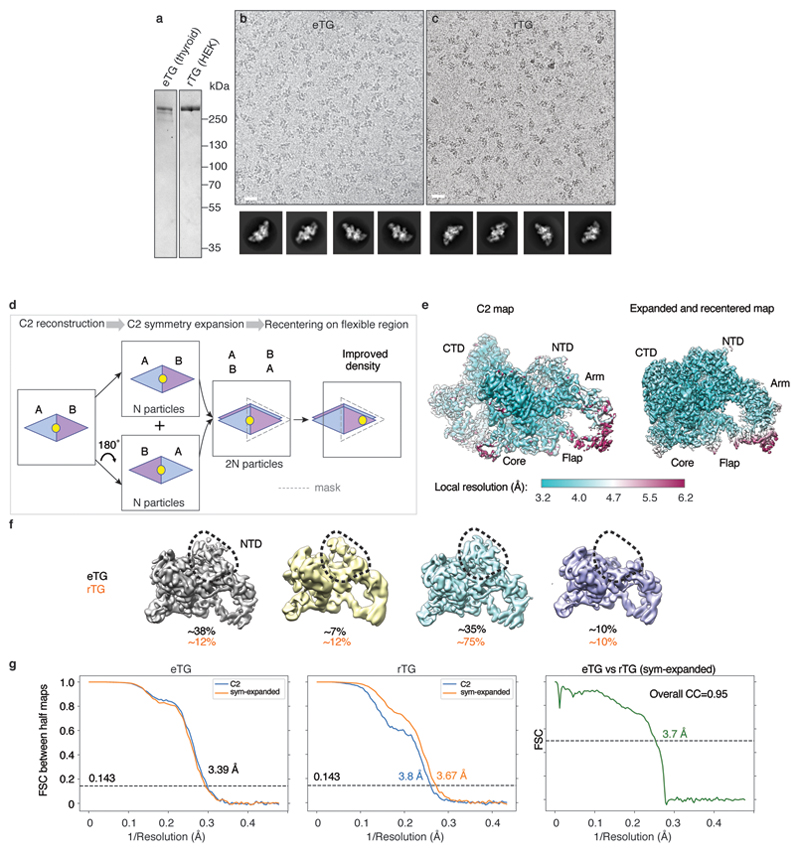
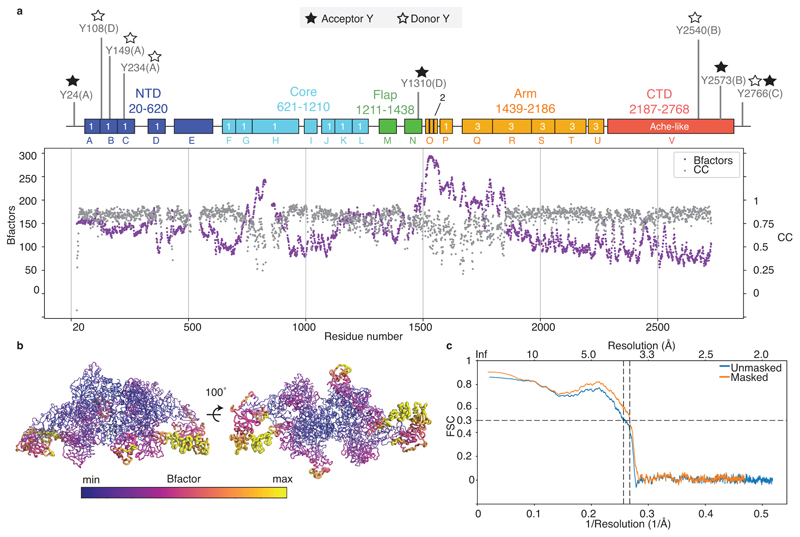
We recombinantly produced full-length non-iodinated human TG in HEK293T cells (rTG)14. rTG appears to be indistinguishable by SDS-PAGE and cryo-EM from endogenous TG purified from thyroid glands of goitrous patients (eTG), which is partly iodinated (Extended Data Figure 2 a-c). In cryo-EM, TG has a bilobed shape with average dimensions of 120 x 235 Å, which correlate well with previously reported negative staining EM data15. We collected cryo-EM datasets for both rTG and eTG and obtained very similar reconstructions at the resolution of ~3.5 Å (Extended Data Figure 2 d-g, Extended Data Table 1). The initial maps obtained by imposing C2 symmetry showed local resolutions ranging from ~3 to ~6 Å. Symmetry expansion and focussed refinements improved the quality of the peripheral regions (Extended Data Figure 2 e). Using a combination of de novo and homology modelling we built a TG atomic model covering 93% of its 2749 amino acids, with variable local quality (Extended Data Figure 3).
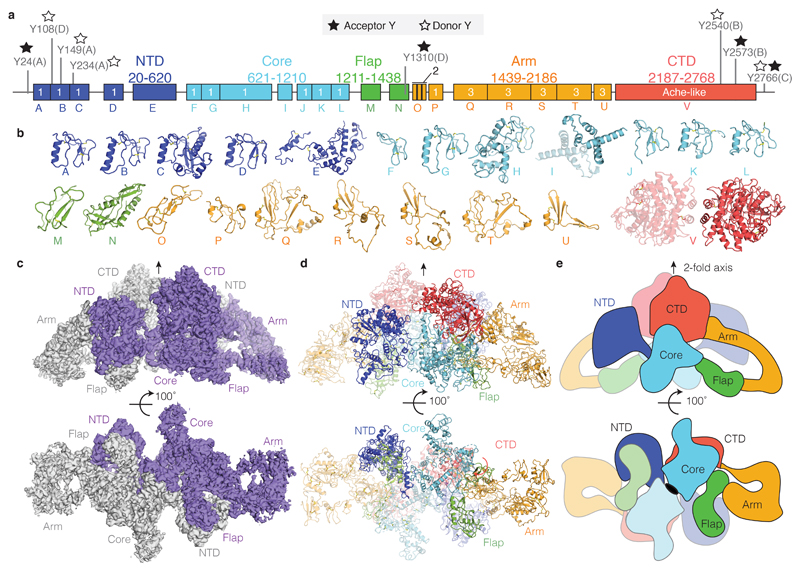
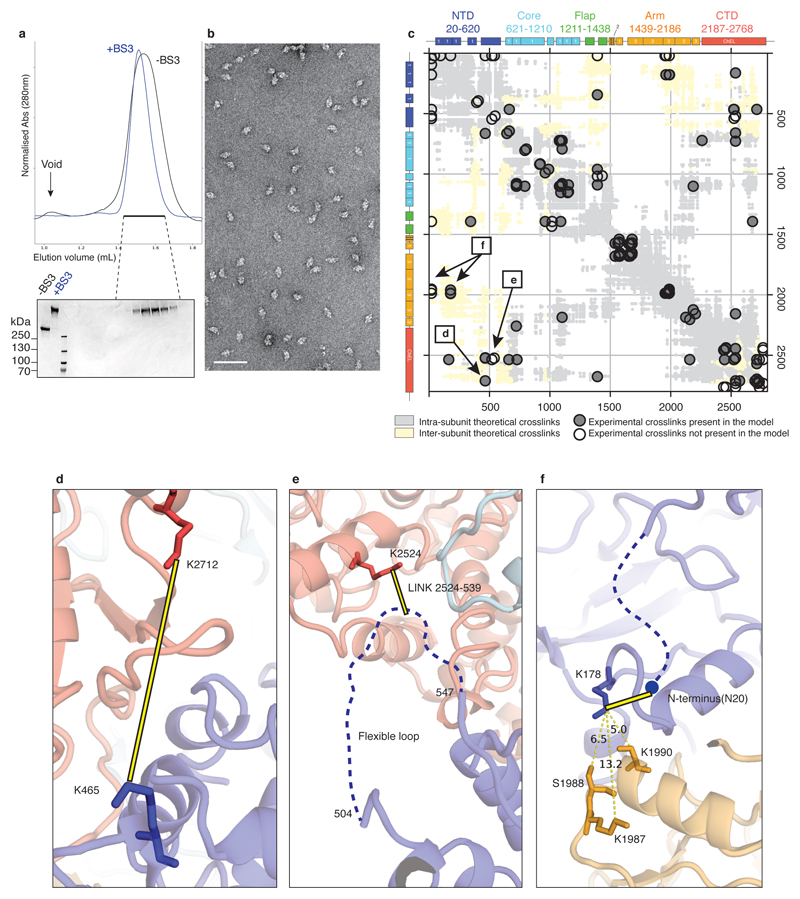
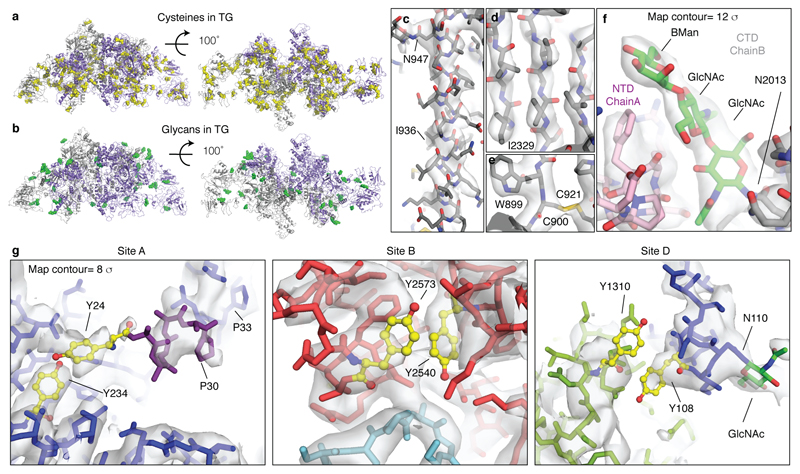
TG's sequence is dominated by a number of cysteine rich domains, which have been named type 1, 2 and 3 thyroglobulin-like repeats (Figure 1a)16,17,18. TG-repeats are spaced by linker domains and connected to a C-terminal choline esterase-like domain (ChEL). Following the domain arrangement in the context of TG's 3D structure, we defined five TG regions: NTD (N-terminal domain), Core, Flap, Arm and CTD (C-terminal domain), as indicated in Figures 1a-b. TG's dimer interface is very large at 29,350 Å2 (Figures 1c-e, Supplementary Video 1). In the TG monomer, the globular NTD is connected to the Core region via a linker (residues 610-620), crossing the central dimer interface and it is partially flexible (Extended Data Figure 2f). The Core contains two triplets of type-1 repeats (domain H with a very large insertion), separated by domain I, located near the C2 axis. The Core is then connected to the Flap region, which is composed of two Ig-like domains, M and N. The Flap extends along the minor axis of the molecule with the M domain protruding at the opposite side of the NTD and folding back onto the Arm region. The Arm consists of a rod-shaped arrangement formed by concatenated type-2 TG repeats with a laminin-like fold and by a single type-1 repeat P. This is followed by a series of type-3 TG repeats, tightly docking onto each other in an arc towards the direction of the C2 axis. The Arm is linked to the CTD region, corresponding to the dimeric ChEL domain, located near the C2 axis. Overall, TG's structure appears entangled and revolves around the central ChEL dimer that interacts with different regions of the Arm and the Core of the same chain and, via the E domain, with the NTD of the other chain. Due to the intertwined nature of the dimer, the NTD interacts with all regions of the other subunit of the dimer. To validate the complex TG architecture, we used crosslinking mass spectrometry and found that the predicted inter- and intra-molecular links from our atomic model are in excellent agreement with experimental crosslinks (Extended Data Figure 4). For example, we detected long-range crosslinks that are consistent with the TG fold where the NTD crosses the ChEL dimer interface: 539-2524, the N-terminus with 178 and the Arm region 1987-1990 (Extended Data Figure 4d-f). Most of TG's disulfide bonds show clear EM density in our maps (Extended Data Figure 5a) and we found no inter-subunit disulfide bonds, in agreement with previous observations that TG is a non-covalent dimer19. We resolved 12 previously predicted N-linked GlcNac in our maps, and four that had not been identified, at N110, N484, N1869 and N212220 (Extended Data Table 3). Some glycans are partially buried and are resistant to treatment with deglycosylases, as shown by EM. Notably, the glycans linked to N2013 mediate the contact between the NTD and CTD and might contribute to the dimer stability (Extended Data Figure 5b & f, Supplementary Video 1).
Figure 1. The structure of human TG by cryo-EM.
a) Domain assignment of human thyroglobulin. Five regions (NTD, Core, Flap, Arm and CTD) contain domains of type-1 to type-3 TG repeats, as well as the choline esterase-like domain (ChEL), labelled as A to V. b) Structural gallery of all resolved TG domains. c) TG cryo-EM map where individual subunits are coloured blue and grey. The NTD crosses the major C2 interface. d) Ribbon diagram of panel c), coloured as in panel a). e) Schematic representation of TG structure in the same colour scheme as in a) and d).
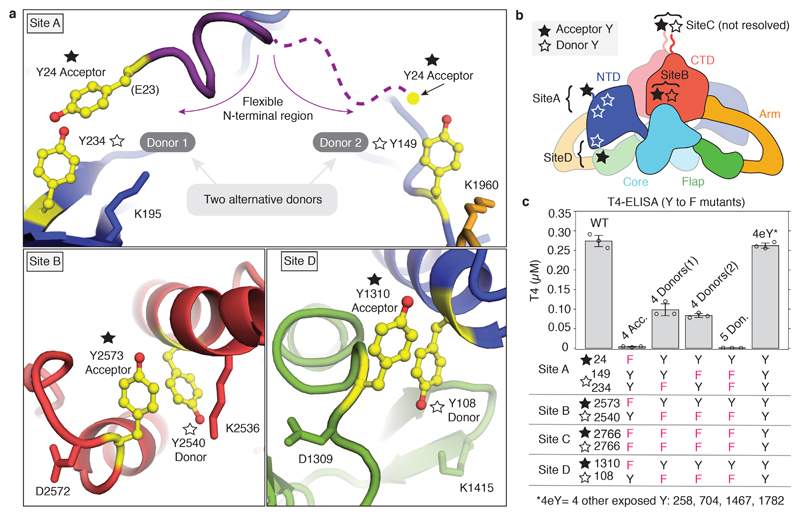
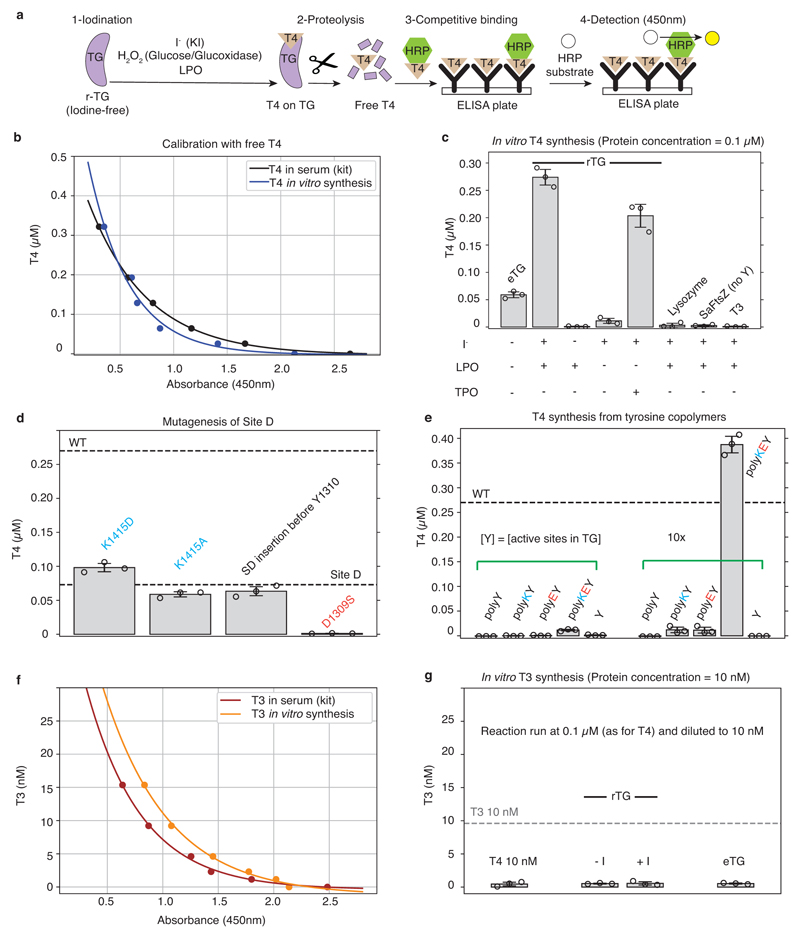
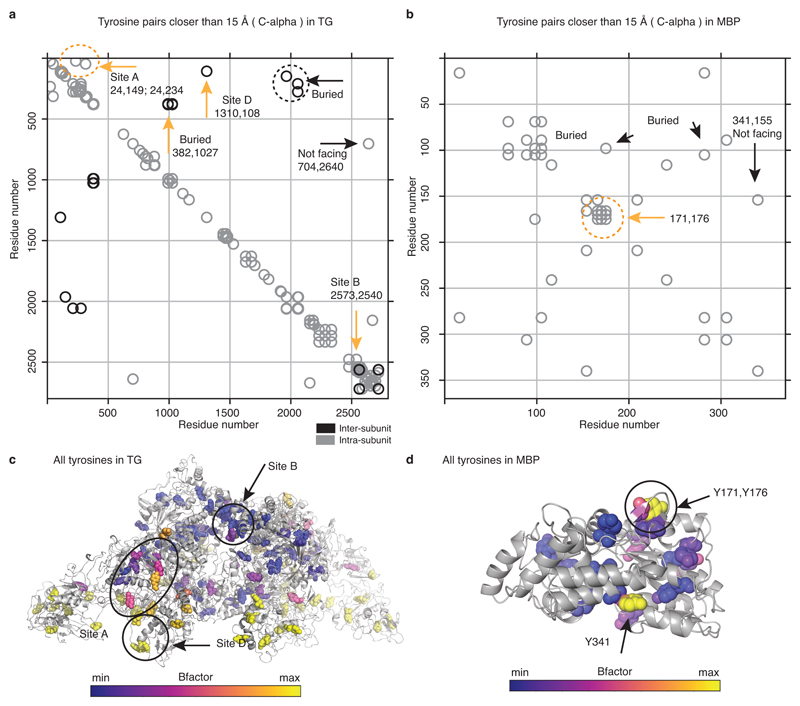
We inspected our structure within a 15 Å radius of the reported acceptor tyrosines (designated Sites A-D)21 and identified putative donor tyrosines (Figure 2a). Acceptor Y24 (partially disordered) at Site A appears to have two possible donor partners Y234 and Y149 (donor 1 and donor 2). In Site B the acceptor Y2573 pairs with donor Y2540; At Site C, Y2766, not resolved in our maps, probably acts both as donor and acceptor across the C2 dimer axis19. In Site D the acceptor Y1310 pairs with Y108 of the other subunit (Figure 2a). Therefore, TG likely contains four hormonogenic acceptor tyrosines and five donor tyrosines. We verified this by comparing the amount of TH obtained from unmodified rTG and rTG variants where acceptor or donor tyrosines were mutated to phenylalanines, abolishing hormone formation. TH synthesis was performed by rTG in vitro iodination, and the T4 or T3 concentrations were measured by adapting a commercial ELISA assay (Extended Data Figure 6)22,23. Using our reaction conditions, we could only detect significant production of T4, but not of T3 (Extended Data Figure 6f-g). We used lactoperoxidase (LPO) in all other reactions, since it showed the same activity as TPO in our assay8. As shown in Figure 2c, when we mutated all acceptors (Y24, Y2573, Y2766 and Y1310)21,13 we observed no T4 synthesis, demonstrating that there are no more than four significant hormonogenic sites in TG. A residual activity, corresponding to about a third of unmodified rTG activity, was detected by mutating all but one of the proposed donors for Site A: those at Sites B, C and D (Y2540, Y2766 and Y108), and either donor 1 or donor 2 at Site A (Y234 and Y149). When all five proposed donors were mutated, no significant T4 formation could be detected, confirming that Site A indeed has two donor tyrosines: Y234 and Y149. We also mutated four exposed tyrosines (4eY), suggested as being important for hormonogenesis21,24 and obtained the same activity as for un-mutated rTG. Therefore, at least under the conditions used, we unequivocally determined and validated the complete set of tyrosines involved in the four TG hormonogenic Sites A, B, C and D. The uniqueness of these tyrosine pairs is corroborated by the analysis of all tyrosine pairs at less than 15 Å distance from each other, calculated from the TG structure (Extended Data Figure 7 a & c). We found that only the tyrosines at TG's hormonogenic sites appear sufficiently close and exposed to permit T4 synthesis. Within the overall TG structure, Site A is located in the NTD, Site B in the CTD, Site C is at the C-terminus across the C2 dimer interface and Site D bridges the NTD and Flap (M domain) of the other subunit in the dimer (Figure 2b).
Figure 2. Identification and validation of hormonogenic donor-acceptor tyrosine pairs in TG.
a) Close-up view of the T4 hormonogenic sites resolved in the cryo-EM map, donor and acceptor tyrosines are highlighted in yellow. Site A suggests two donors, Y234 and Y149. b) Location of the four hormonogenic Sites A to D in the TG structure. c) T4 ELISA after in vitro iodination in triplicate. Bar plot and error bars indicate average and standard deviation. Replacing all acceptor tyrosines (Y) with phenylalanines (F) prevents hormone formation (4 Acc: 24, 2573, 2766, 1310). Replacing all five donors suppresses T4 synthesis (4 Donors (1): 2540, 2766, 108, 234; 4 Donors (2): 2540, 2766, 108, 149; 5 Donors: 2540, 2766, 108, 234, 149). Replacing other tyrosines at the surface (258, 704, 1467, 1782) has no effect (4eY).
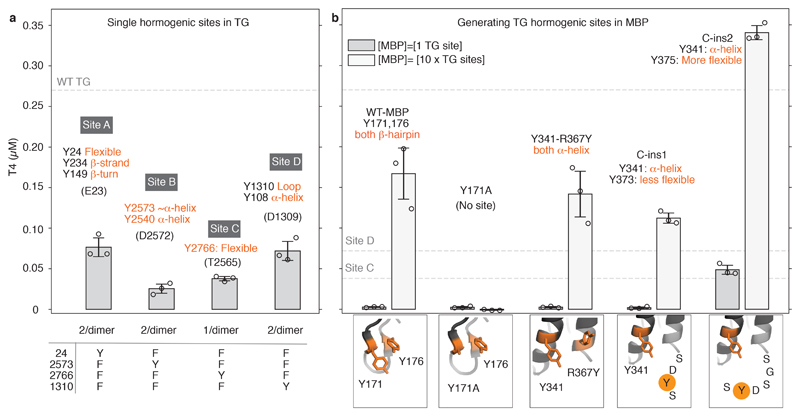
Furthermore, we showed that all acceptor mutants with one hormonogenic site active at a time (Figure 3a) contribute to hormone formation and the sum of the concentrations measured individually recapitulates the total T4 amount produced by unmodified rTG. We conclude that TG synthesises seven molecules of T4 per dimer, since each TG dimer contains two sites (one per monomer) of A, B and D and only one Site C.
Figure 3. Engineering T4 hormone synthesis by bacterial maltose binding protein (MBP).
a) rTG mutants with only one site active at a time. T4 release measured with the same T4 ELISA as in Figure 2c. The sum of T4 produced by the individual sites recapitulates the T4 produced by WT. b) T4 ELISA after in vitro iodination of engineered MBP to reconstruct TG's hormonogenic sites. See text and Supplementary Video 2 for details. An MBP version adding a flexible SGSDYS tail to the C-terminus shows activity comparable to a single site on TG as shown in panel a). All measurements done in triplicate. Bar plot and error bars indicate average and standard deviation.
Resolved Sites A, B and D do not show obvious structural similarity and active tyrosines are in solvent accessible and flexible regions (Figure 2a, Extended Data Figure 7a,c). A conserved lysine is found in proximity of the donor, and a conserved acidic residue (Glu or Asp) always precedes the acceptor 21. By mutagenesis of Site D, we showed that K1415 is not relevant, but D1309 is essential for hormonogenesis (Extended Data Figure 6d). Inserting an additional Ser-Asp sequence before acceptor Y1310 did not change the amount of T4 produced. Therefore, the presence of the aspartate seems to be overall more important than its distance to the donor tyrosine.
Because in Sites A, B and D the donor backbone conformation is constrained within secondary structure elements, whereas the acceptor is in more flexible regions, the acidic Asp or Glu residues (pointing towards the solvent) could play a role in orienting the following acceptor towards the more rigid donor. There is no preceding acidic residue in the C-terminal Site C, where both acceptor and donor (Y2766 from the two chains of the dimer) are in unstructured regions with higher intrinsic flexibility.
Although the reaction mechanism of T4 synthesis from polypeptide chains remains to be established in more detail, four features seem to be crucial for hormonogenesis: tyrosine pairs must be solvent exposed to be iodinated, in proximity and in roughly antiparallel orientation, and in highly mobile regions of the protein in order to allow the significant bond rearrangement resulting in T4 synthesis.
To validate our list of requirements for hormonogenesis from polypeptide chains, we set out to engineer synthetic T4 hormonogenic sites into the unrelated bacterial maltose binding protein (MBP). E. coli MBP naturally contains 15 tyrosines, mostly found in its hydrophobic core except the Y171-Y176 pair, which is in a solvent-exposed β-hairpin, and Y341, located in a solvent-exposed helix, facing the C-terminal helix (Extended Data Figure 7b & d). We engineered a putative partner tyrosine for Y341 first via the mutation R367Y (in a neighbouring helix) and second by inserting a tyrosine-containing peptide at the C-terminus: SDYS (C-ins1) or SGSDYS insert (C-ins2). We measured T4 hormonogenesis with the same ELISA used for TG (Extended Data Figure 7a), at a concentration corresponding to a single TG site, and 10 times higher, to allow detection of marginal activities (Figure 3b). Unmodified MBP's T4 hormone production was only measurable at the higher concentration. We attribute this basal activity to the Y171/Y176 pair since it could be suppressed by introducing a Y171A mutation. The low level of T4 production can be attributed to a lack of flexibility of the backbone near Y171 and Y176, and to their relative orientations, which is different to any of the sites in TG. Equally, the hormonogenic activity was unchanged when introducing the pair Y341/Y367, presumably because both tyrosines were constrained by their rigid α-helical backbone, and the coupling reaction could not occur with any effectiveness. The C-ins1 variant, producing a putative tyrosine pair with Y341, also showed low activity, possibly because the added linker was designed to be too short for the two tyrosines to come into proximity. However, and significantly, the amount of T4 measured for the two-residue longer C-ins2 MBP variant was comparable to a single site in TG (Figure 3b, Supplementary Video 2). Finally, with our ELISA we could also obtain modest T4 synthesis from random tyrosine copolymers, as previously reported4 (Extended Data Figure 6e).
Nature has selected the complex and large scaffold of the TG dimer to synthesise only seven molecules of hormones, using a chemical reaction involving radicals that could be carried out by unfolded peptides or other less complex proteins. However, in the context of the thyroid gland and the iodine cycle in vertebrates, TG's structure effectively combines hormonogenesis with iodination of many other solvent exposed tyrosine residues for iodine storage21,13. The solvent exposure of tyrosines is presumably compensated by the exceptional solubility and stability that allows TG to persist at high concentrations in the harsh environment of the colloid. Moreover, the complexity of the TG molecule might fulfil further important roles in endocytosis, regulation of the T3/T4 ratio, TG proteolytic processing and in the trafficking to lysosomes25,26. The atomic structure of human TG presented here will enable further studies towards a deeper understanding of thyroglobulin within the thyroid, and its involvement in thyroid diseases27,28,29.
Methods
DNA constructs
A gene encoding for full length human TG (Uniprot P01266) additionally containing a 10x histidine tag at the C-terminus preceded by a TEV cleavage site was codon-optimised for mammalian expression and purchased from GenScript (Piscataway, NJ). The gene was cloned with EcoRI and XhoI restriction sites (enzymes purchased from NEB) into vector pLEXm14 for recombinant expression in mammalian cells. Mutations were introduced by PCR and the purified overlapping fragments were assembled with the EcoRI/XhoI linearised vector by Gibson assembly (NEB).
Maltose binding protein (MBP) constructs were purchased as gBlocks (IDT) and cloned using BlpI and NdeI restriction sites (enzymes purchased from NEB) into the pHis17 bacterial vector, for the expression of N-terminally 6x histine-tagged MBP variants. A synthetic gene comprising human TPO (UniProt ID P07202) 1-838 with native extracellular signal sequence was cloned into pFastBac1 plasmid adding a C-terminal 6x histidine tag. All translated sequences of recombinant proteins used in this work are listed in SUPPLEMENTARY INFORMATION 1.
Proteins, protein expression and purification
Endogenous TG (eTG) from human thyroid glands was purchased from Biorad (Hercules, CA). We found it contains some T4, as measured by using our T4-ELISA, but not T3 (Extended Data Figure 6). It is also partially degraded, as shown by SDS-PAGE (Extended Data Figure 2a). While the protein behaved well when performing negative staining EM, it was challenging to produce specimens amenable to high resolution cryo-EM. Therefore, eTG was deglycosylated with the addition of 1 μl/200 μg eTG of PNGaseF from NEB (Ipswich, MA) for 1 h at 37 °C and purified by size exclusion chromatography using a Superose 6 Increase 3.2/300 column (GE Healthcare), equilibrated with buffer T200 (50 mM Tris/HCl, 200 mM NaCl, pH 8.0).
For the recombinant production of human TG (rTG), HEK293T (ATCC no. CRL-1573) cells were cultured as adherent monolayers until 90% confluency in Dulbecco’s modified Eagle’s medium (Sigma-Aldrich Company Ltd., Gillingham, UK) supplemented with 10% foetal calf serum (v/v; Sigma-Aldrich Company Ltd.), L-glutamine and nonessential amino acids (Invitrogen Ltd., Paisley, UK), and transiently transfected with 2 mg of DNA and 4 mg of polyethyleneimine (PEI; Sigma-Aldrich Company Ltd.) per litre of culture. We note that the involvement of glycans in TG dimer formation as revealed by the structure might explain the poor expression yields of thyroglobulin when produced in expression systems with reduced/altered glycosylation, such as insect cells, HEK293S GnT1-/- cells or HEK293T cells in the presence of kifunensine (data not shown).
Five days later, the supernatant containing approximately 0.5 mg/L of secreted TG was harvested and filtered (0.22 μm) for protein purification. For smaller cultures (~125 mL) the supernatant was diluted with an equal volume of buffer T200 containing 20 mM imidazole. For volumes larger than 250 mL the supernatant was concentrated and buffer exchanged into buffer T200 using an Äkta Flux system (GE Healthcare). Subsequently, Ni-NTA agarose beads (QIAGEN, West Sussex, UK) were added to the supernatant (2 mL per litre of supernatant). The mixture was gently stirred at 4 °C for 1 h and the beads collected by centrifugation at 600 xg for 5 min in 50 mL tubes (Falcon, BD Biosciences, Oxford, UK). The beads were poured into a 10 mL EconoColumn (Bio-Rad Laboratories Ltd., Hemel Hempstead, UK) and washed with 10 column volumes (CV) of buffer T200, supplemented with increasing concentrations of imidazole (20 mM, 50 mM, 80 mM), prior to elution with 5 column volumes of buffer T200 supplemented with 500 mM imidazole (all buffers adjusted to pH 8.0). Eluting fractions containing TG, according to SDS-PAGE analysis, were pooled and concentrated prior to further purification by size exclusion chromatography (SEC) using a Superose 6 Increase 3.2/300 column (GE Healthcare), or a Superose 6 10/300 GL column for larger amounts of protein. Fractions containing TG were joined, concentrated by ultrafiltration, aliquoted at a concentration of ~0.5 mg/mL, flash frozen in liquid nitrogen and stored at -80 °C.
For maltose binding protein (MBP) variants, the plasmid was transformed into chemically competent C41(DE3) E. coli cells. 100 mL bacterial cultures were grown in 2xTY medium at 37 °C in the presence of 100 μg/mL ampicillin, and protein expression was induced at an optical density OD600 of ~1.0 with 1 mM IPTG for 5 hrs. Cells were harvested by centrifugation at 5000 xg, re-suspended in buffer T200, supplemented with 20 mM imidazole, DNAse, RNaseA, lysozyme (Sigma Aldrich) and protease inhibitors (Roche), and lysed by sonication. The soluble fraction was separated by ultracentrifugation at 40,000 xg and MBP protein variants were purified as described for TG, with a SEC final purification step using a Superdex 200 3.2/300 column.
For human TPO ectodomain expression in insect cells, bacmids were prepared using DH10EMBacY competent cells (Geneva Biotech) following the Bac-to-Bac Baculovirus Expression System user guide by Invitrogen. Sf9 cells were transfected with FuGENE Transfection reagent (Promega). V1 virus was used for large-scale protein production in 400 mL, and cells were supplemented with 5-aminolevulinic acid, which is a precursor of the heme prostetic group and has been reported to increase specific activity of TPO30. Four days after infection, cells were harvested via centrifugation (800 xg, and then 10.000, both at 4 °C) and the supernatant was concentrated by tangential flow filtration. The concentrated supernatant was dialysed against PBS, pH 7.4 and TPO was purified by nickel affinity purification (GE Healthcare HisTrap HP, 1 mL column) using as binding buffer PBS plus 20 mM imidazole, pH 7.4 and as elution buffer PBS plus 400 mM imidazole, also at pH 7.4. Relevant fractions were pooled, concentrated by ultrafiltration and TPO was further purified using a Superdex 200 10/300 column (GE Healthcare), pre-equilibrated with PBS, pH 7.4. TPO was concentrated to 1 mg/mL and flash frozen in liquid nitrogen for storage at -80 °C. The heme occupancy of TPO was estimated by measuring the ratio of absorbance at 412 nm and 280 nm which was 0.2, which roughly equates to 20% occupancy30.
EM sample preparation and data collection
Graphene oxide (GO) grids were prepared following a published procedure31 using as support Quantifoil Cu/Rh 200 mesh R2/2 grids. 3 μL of TG sample was applied to the GO grids at a concentration of approximately 0.05 mg/mL and plunge-frozen in liquid ethane using a Vitrobot Mark IV (Thermo Fisher). While eTG behaved better when deglycosylated, there was no difference between glycosylated and deglycosylated rTG. Therefore, we collected datasets of deglycosylated eTG and non-deglycosylated rTG.
Images were acquired on a K2 Summit detector (Gatan) in counting mode using a Titan Krios G2 (Thermo Fisher) electron microscope at 300 kV. A Quantum GIF energy filter (Gatan) was used with a slit width of 20 eV to remove inelastically scattered electrons. The eTG dataset was collected at eBIC (Diamond Light Source, UK) while the rTG dataset was collected at MRC-LMB. For the eTG dataset, 40 movie frames were recorded, using a fluency of 1.18 electrons per Å2 per frame, for a total accumulated dose of 47.2 electrons per Å2 at a pixel size of 1.043 Å on the specimen. For the rTG dataset 52 movie frames were recorded, using a fluency of 0.91 electrons per Å2 per frame, for a total accumulated dose of 36.3 electrons per Å2 at a pixel size of 1.149 Å on the specimen. Further details are presented in Extended Data Table 1.
Cryo-EM image processing
Movie frames were corrected for gain using a reference, motion-corrected and dose-weighted using MOTIONCOR232. Aligned micrographs were used to estimate the contrast transfer function (CTF) in Gctf33. All subsequent image-processing steps were performed using single particle reconstruction methods in RELION 2.1 or 3.034,35. Poor-quality images were discarded after manual inspection. Particles were initially manually picked in order to generate 2D class references for automated picking in RELION. After picking the whole dataset automatically, particles were extracted with 4 x 4 binning and two rounds of reference-free 2D classifications were performed. The particles belonging to the best 2D classes were extracted un-binned (400 pixels box size) and used for 3D reconstruction, applying C2 symmetry. The resolution was estimated with the FSC criterion of 0.143 and B-factor sharpening was applied, both using the relion_postprocess routine. Local map resolution was estimated with RELION. Bayesian polishing and per particle CTF and tilt correction were performed but did not provide a significant improvement in resolution.
The central regions of the maps, corresponding to the C-terminal ChEL domains, were well defined (~3 Å in resolution), whereas peripheral regions corresponding to the Arms were noisy and at lower resolutions (~ 6 Å). In order to improve resolution especially in the Arm regions we expanded the dataset using the relion_symmetry_expand routine by the C2 symmetry and re-extracted the particles centred at the least resolved part of the map (Extended Data Figure 2d),36. After applying a soft mask to one half of the TG dimer, several cycles of refinement and 3D classification were run using solvent flattening. Although the overall resolution of the expanded and re-centred map was very similar to the C2 counterpart, the local resolution and continuity of the density in the Arm region was significantly improved (Extended Data Figure 2e). The same procedure was applied to both eTG and rTG datasets, which at the end looked virtually identical as shown in Extended Data Figure 2g. The best final maps we used for model building were the C2 map from the eTG dataset (overall 3.39 Å resolution) and the expanded map from the rTG dataset (overall 3.67 Å resolution). In order to allow simultaneous model building in both maps the expanded rTG map was aligned and resampled onto the C2 map, and subsequently C2 symmetrised for the final dimer TG model.
Model building
Following the domain annotations reported in UniprotKB for TG (P01266), we generated homology models with SWISSMODEL37, as reported in Extended Data Table 2. We visually inspected the map and localised matching domains for some of the models, which we fitted by correlation in Chimera38. Firstly, the large ChEL domain at the dimeric TG interface was identified; secondly, triplets of TG type-1 repeats where fitted16,17. Their correct order was determined by the differences in side chain densities surrounding the CWC motif and the characteristic loop insertions of each domain. The best resolved type-3 repeat was domain U, which we built de novo in MAIN39 and used as a template to generate homology models for the other type-3 repeats Q, R, S and T. The connecting regions with unknown folds were build de novo in MAIN39 and COOT40, with help of secondary structure predictions (HHpred41, Jpred42). The correct assignment of the polypeptide chain register was often helped by the presence of large aromatic side chains and disulfide bond pairs, as well as the presence of glycosylation sites at Asn residues (17, plus 4 new sites which we identified, Extended Data Table 3, Extended Data Figure 5a-f). Residues 24 (acceptor Site A) to 29 were built tentatively into a map filtered to lower resolution using MAIN score map density modification procedure39, however their coordinates are only indicative and hence are included in the model as poly-alanine (Extended Data Figure 6g).
Initially, the full model was built in one half of the rTG map (expanded, re-centred and masked) and refined using Phenix.real_space_refinement43. Subsequently, the full dimeric structure was generated by applying C2 symmetry and further refined in the C2-symmetrised rTG map. Final statistics and validation of the model are reported in Extended Data Table 1 and Extended Data Figure 2. The resolution of the map is non-uniform and consequently the model has variable quality depending on the map region. To illustrate this, per residue B-factor and per-residue map-to-model cross correlation plots as calculated in Phenix are provided in Extended Data Figure 3.
Crosslinking and mass spectrometry analysis
An rTG aliquot 100 μL at 0.5 mg/mL was buffer-exchanged using a Superose 6 Increase 3.2/300 column (GE Healthcare), pre-equilibrated with 20 mM Hepes, 200 mM NaCl at pH 7.5. Pooled fractions were incubated for 2 h on ice at 0.5 mg/mL with or without 1 mM BS3 (bis(sulfosuccinimidyl)suberate, Thermo Fisher). The crosslinking reaction was quenched by adding 50 mM ammonium bicarbonate and the product was analysed using a Superose 6 Increase 3.2/300 column pre-equilibrated in buffer T200 (Extended Data Figure 4). Gel bands corresponding to crosslinked rTG were excised and digested with trypsin (Pierce, Germany) following an in-gel digestion protocol44. The resulting tryptic peptides were extracted and desalted using C18 StageTips45.
Enrichment of crosslinked peptides was accomplished by size-exclusion chromatography using a Superdex Peptide 3.2/300 column (GE Healthcare). Mobile phase consisted of 30% (v/v) acetonitrile and 0.1% trifluoroacetic acid, running at a flow rate of 10 μL/min. The earliest five peptide-containing fractions (50 μL each) were collected and dried in a vacuum concentrator.
LC-MS/MS analysis was performed using an Orbitrap Fusion Lumos Tribrid mass spectrometer (Thermo Fisher Scientific, Germany), connected to an Ultimate 3000 RSLCnano system (Dionex, Thermo Fisher Scientific, Germany). Samples were resuspended in 1.6% v/v acetonitrile 0.1% v/v formic acid and injected onto an EASY-Spray column of 50 cm length (Thermo Fisher) running at 300 nL/min with mobile phases A (0.1% formic acid) and B (80% acetonitrile, 0.1% formic acid). Samples were eluted by applying a gradient ranging from 2% to 45% B over 90 min. Each gradient was optimised for the corresponding SEC fraction. After this, a washing step was applied in which the content of B was ramped to 55% and 95% within 2.5 min each, followed by 5 min at 95% B. Each fraction was analysed in duplicates. The settings of the mass spectrometer were as follows: data-dependent mode with 3s-top-speed setting; MS1 scan in Orbitrap at 120,000 resolution over 400 to 1,600 m/z; MS2-scan trigger only on precursors with z = 3-6+; fragmentation by HCD employing a decision tree logic with optimised collision energies; MS2 scan in Orbitrap at resolution of 30,000; dynamic exclusion was enabled upon single observation for 60 seconds. Generation of fragment spectra peak lists from raw mass spectrometric data used msConvert (version 3.0.11729), operating under default settings. Precursor m/z were recalibrated and the crosslink search was performed using Xi46 using TGs Isoform 1 sequence without N terminal signal peptide sequence and extra residues from TEV-cleavage. Decoy sequences were generated by reversing the protein sequence. For the search MS1 and MS2 accuracies were set to 3 and 10 ppm, respectively. Tryptic peptides (full trypsin specificity) with up to four missed cleavages were allowed. BS3’s reaction specificity was restricted to the side chains of lysine, serine, threonine, tyrosine, as well as the protein N termini. Carbamidomethylation on cysteine was set as fixed; oxidation on methionine, hydrolysed/aminolysed BS3 from hydrolysis or ammonia quenching on a free cross-linker end were set as variable modifications. Identified crosslinked peptide candidates were filtered to an FDR of 2% on residue-pair-level using XiFDR47. A list of all experimental crosslinks is reported in Supplementary Table 1. Inter- and intramolecular theoretical crosslinking pairs were calculated from our TG atomic structure and overlapped with the experimental pairs with a Xi score > 12 and an estimated FDR = 0 (Extended Data Figure 4c).
T4 and T3 ELISA
We produced TH from recombinant (non-iodinated) proteins following the procedures reported previously for poorly iodinated eTG22, and quantified the T4 and T3 products via ELISA designed to work in blood serum (Abcam, ab108661: Human Thyroxine ELISA Kit; Abcam, ab108664: Human Triiodothyronine ELISA Kit (free + total T3). To perform the assays, protein at a concentration of 0.1 μM was added to 1 mM KI, 24 mM glucose, 2 μg/mL glucose oxidase and 3 μg/mL lactoperoxidase (LPO) or TPO (Extended Data Figure 6c). All commercial reagents were purchased from Sigma. The iodination reaction was allowed to proceed for 10 min at 37 °C and then Pronase protease mix (Roche) was added at ~2.5 μg/mL to digest all enzymes, and TG to release TH. This was followed by heat inactivation for 15 min at 95 °C, a step that does not affect the stability of free T4 or T348. The reaction product was diluted to measure TH production in dynamic range compatible with the ELISA kits. Subsequently, we added BSA at a concentration of 60 mg/mL to the mixture as an essential blocking agent, and added the mixture to ELISA plates for detection, following the manufacturer’s instructions. In order to check whether any of the iodination components were interfering with the ELISA (which is optimised for TH detection in serum) we performed the assay without iodide but adding known amounts of T4 or T3 (Sigma Aldrich). This yielded calibration curves similar to the ones provided by the manufacturer, and also showed good dynamic range (Extended Data Figure 6). Only T4 was produced in detectable amounts in our in vitro TH production assay. Considering that TG has 3-4 sites, 0.1 μM was determined to be the optimal starting concentration for the assay. Positive controls were performed with eTG (containing some hormones and partly iodinated) and negative controls with T3 (tri-iodo-thyronine, Sigma), lysozyme and with FtsZ from Staphylococcus aureus, which does not contain tyrosines. Using our calibration curve, we converted the absorbance into T4 concentration, performed each measurement three times independently and reported the average and standard deviation values (Extended Data Figure 6, Figures 2 & 3). Recombinant TPO was added at a five times higher concentration, compensating for its heme content of only ~20 %. Tyrosine copolymers were purchased from Sigma Aldrich (P4659, P0151, P4409, P1800) and dissolved in T200 buffer.
Extended Data
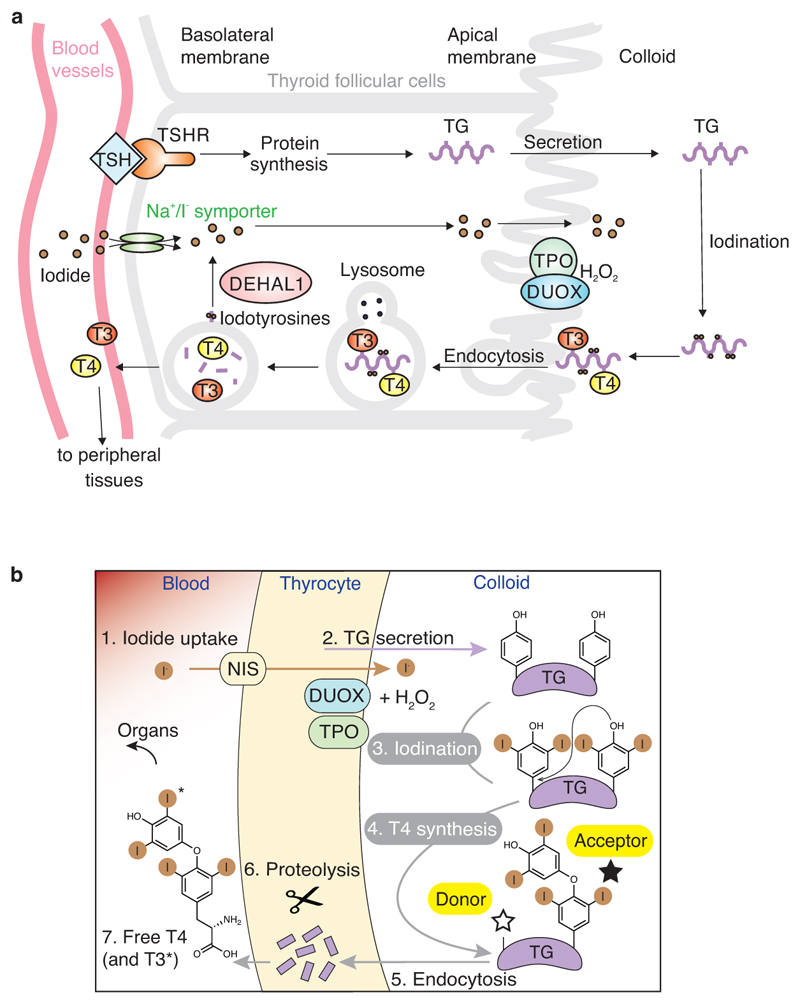
Extended Data Figure 1. The iodine cycle in the thyroid gland and the chemistry of thyroid hormone formation.
a) Iodide is extracted from the blood vessels and into the thyroid cells via the Na/I symporter (NIS). TSH binds TSH receptor (TSHR) to induce the expression of TG. TG is secreted into the extracellular lumen of follicular cells (colloid). DUOX and TPO catalyse the iodination of TG, therefore T4 (or T3) hormones are formed on the TG polypeptide chain. After hormonogenesis, TG is reimported and proteolysed in lysosomes to release T4/T3 into the blood. DEHAL1 deiodinates iodo-tyrosines to recycle iodide in thyroid cells. b) T4 (or T3) synthesis from thyroglobulin (TG) in the thyroid gland.
Extended Data Figure 2. Cryo-EM reconstruction of endogenous and recombinant thyroglobulin (eTG, rTG).
a) SDS-PAGE of endogenous eTG from goitrous thyroid extracts and recombinant rTG expressed in HEK293T cells. b) Cryo-EM micrograph of eTG with calculated reference-free 2D class averages below. Scale bar 200 Å. c) Cryo-EM micrograph of recombinant rTG with 2D class averages, showing the two proteins to be structurally identical at this level of analysis. Scale bar 200 Å. d) Schematic illustrating the C2 symmetry-expansion and re-centring procedure, which was used to enhance TG map quality in peripheral regions. For a detailed procedure see the Methods section ‘Cryo-EM image processing’. e) Local resolution of the C2 and symmetry-expanded and re-centred eTG maps. f) Flexibility of N-terminal domain (NTD) resulting in varying map quality and occupancy of this region in a number of 3D class averages (calculated in RELION). g) Fourier shell correlation (FSC) between RELION 'gold standard' half-maps and between the final eTG and rTG maps, showing their strong similarity.
Extended Data Figure 3. Local properties of the atomic TG model.
a) Per-residue atomic B-factor and cross correlation with the rTG map, plotted per residue number. b) Local B-factor colour-coded onto the surface of the TG structure. c) FSC between the map and model calculated for rTG. FSC 0.5 is indicated.
Extended Data Figure 4. Validation of TG's three-dimensional architecture by MS crosslinking.
a) Size-exclusion chromatograms of rTG before and after BS3 crosslinking and subsequent SDS-PAGE (Coomassie stained). b) Negative staining micrograph of crosslinked rTG, showing the absence of higher-order structures caused by unwanted inter-dimer crosslinks. c) Plot representing experimental crosslinks (circles) overlapping with predicted crosslinks, calculated from the structure determined here. d) - f) Detail of key TG interfaces confirmed by the crosslinking.
Extended Data Figure 5. TG cryo-EM map details.
a) All disulfide bonds in TG included in the model (yellow spheres). b) Glycans detected in the cryo-EM maps and included in the TG atomic model (green spheres). c) Close-up view of a typical alpha helix in the TG cryo-EM map (part of the Core region). d) Close-up of a beta sheet in TG (part of the ChEL domain). e) Close-up of the disulfide bond C900-C921 (Core region). f) Map details of N2013 and N-linked GlcNAc between two TG subunits. g) Close-up views showing conformational disorder within the hormonogenic sites, making precise side chain placements difficult, but the backbone positions are resolved (rTG map).
Extended Data Figure 6. Quantitative TH ELISA assays.
a) Schematic summarising in vitro TH synthesis and quantification via ELISA assays. b) T4 assay calibration curves with added T4 under manufacturer-recommended and modified (T4 synthesis as performed here) conditions. c) Validation of the T4 ELISA assay. eTG presumably contains already reacted tyrosine side chains. rTG produces T4. Addition of iodide is required for the reaction to occur. LPO is as active as TPO, taking the reduced 20% heme content in our TPO into account. Lysozyme (some tyrosines), SaFtsZ (no tyrosines) and T3 produce no T4 signal. d) Mutating residues in hormonogenic Site D in a version of TG that is only active in Site D shows that a conserved lysine residue is not important for the reaction. Adding an extra Ser-Asp before Y1310 has no effect, but the mutation D1309S abolished activity. e) Synthesis of T4 from tyrosine copolymers as measured by the T4 ELISA assay. Only a polymer where tyrosines are spaced apart and preceded by Lys-Asp produce some T4. Note that activity is lower than in a single site of TG (or MBP, compare with Figure 4). f) T3 assay calibration curves with added T3 under recommended and modified (as for T4) conditions. g) No significant T3 production was detected from iodinated rTG or eTG from goiter.
Extended Data Figure 7. Tyrosine pair proximity plots for TG and MBP.
a & b) Proximity plots of tyrosine residues closer than 15 Å to each other, calculated from TG a) and MBP b) atomic models (TG: this study; MBP PDB ID: 1ANF). The coordinates of each point in the plot represent a tyrosine pair position (residue number). For the TG dimer, the distance between tyrosines from the same or the other subunit in the dimer are shown in grey or black, respectively. In TG there are no more than five pairs that are exposed and in < 15 Å proximity at the same time, predicting the absence of other significant hormonogenic sites. In MBP only one pair closer than 15 Å is sufficiently exposed to be a candidate for hormonogenesis. c) & d) Ribbon diagram of TG and MBP where tyrosine residues are represented as spheres and coloured by B-factor, which largely indicates solvent exposed residues.
Extended Data Table 1. Thyroglobulin (TG) cryo-EM and model statistics.
| Data collection and processing | eTG (C2 map) | rTG (expanded map) |
|---|---|---|
| Magnification | 134,615x | 105,000x |
| Voltage (kV) | 300 | 300 |
| Electron exposure (e-/Å2) | 45 | 40 |
| Defocus range (μm) | 0.5-3.5 | 0.5-3.5 |
| Pixel size (Å) | 1.043 | 1.149 |
| Symmetry imposed | C2 | C1 |
| Initial particle images | 422,087 | 240,194 |
| Final particle images | 181,830 | 151,601 |
| Map resolution (Å) – (FSC 0.143) | 3.39 | 3.67 |
| Map resolution range (Å) | 2.8-7.0 | 3.3-5.0 |
| Map sharpening B factor (Å2) | -138.641 | -113.164 |
| Refinement | ||
| Model resolution (Å) (FSC 0.5) | 3.4 (3.8) | |
| PDB ID | 6SCJ | |
| EMDB | EMD-10141 | |
| Model composition | ||
| Non-hydrogen atoms | 39,886 | |
| Protein residues | 2,569 | |
| RMS deviations | ||
| Bond lengths (Å) | 0.005 | |
| Bond angles (°) | 1.274 | |
| Validation | ||
| Molprobity score (percentile) | 1.85 (83rd) | |
| Clashscore | 4.88 | |
| Poor rotamers (%) | 0.14 | |
| Ramachandran plot | ||
| Favored (%) | 86.69 | |
| Allowed (%) | 13.31 | |
| Disallowed (%) | 0 | |
Extended Data Table 2. TG domain annotation.
| Region (residue range) | Region name | Domain | Domain type | Template for homology model (PDB ID) |
|---|---|---|---|---|
| 31-92 | NTD | A | type-1 TG repeat | 1ICF.I |
| 93-160 | NTD | B | type-1 TG repeat | 1ICF.I |
| 161-297 | NTD | C | type-1 TG repeat | 1ICF.I |
| 298-358 | NTD | D | type-1 TG repeat | 1ICF.I |
| 359-620 | NTD | E | helical | de novo |
| 621-658 | Core | F | type-1 TG repeat | 1ICF.I |
| 659-726 | Core | G | type-1 TG repeat | 1ICF.I |
| 727-921 | Core | H | type-1 TG repeat | 1ICF.I |
| 922-1008 | Core | I | similar to type-1 (dimer) | de novo |
| 1023-1073 | Core | J | type-1 TG repeat | 1ICF.I |
| 1074-1145 | Core | K | type-1 TG repeat | 1ICF.I |
| 1146-1211 | Core | L | type-1 TG repeat | 1ICF.I |
| 1210-1283 | Flap | M | Fv from an IgM | 1IGM |
| 1284-1438 | Flap | N | Fv from an antibody | 2E27 |
| 1439-1510 | Arm | O | TNF/EGF/laminin-like | 5wiw |
| 1511-1565 | Arm | P | type-1 TG repeat | 1ICF.I |
| 1603-1723 | Arm | Q | type-3 TG repeat | U domain |
| 1724-1892 | Arm | R | type-3 TG repeat | U domain |
| 1893-1995 | Arm | S | type-3 TG repeat | U domain |
| 1996-2129 | Arm | T | type-3 TG repeat | U domain |
| 2130-2186 | Arm | U | type-3 TG repeat | de novo |
| 2187-2728 | CTD | V | ChEL (dimer) | 5HQ3 |
Extended Data Table 3. List of N-linked GlcNac in TG structure.
| Asn | GlcNAc | GlcNAc | Bman | |
|---|---|---|---|---|
| 76 | 3617 | |||
| 110 | 3620 | Newly identified | ||
| 198 | 3618 | |||
| 484 | 3619 | Newly identified | ||
| 529 | not visible in the map (flexible) | |||
| 748 | not visible in the map (flexible) | |||
| 816 | not visible in the map (flexible) | |||
| 947 | 2733 | |||
| 1220 | 2734 | |||
| 1348 | not present | |||
| 1349 | 2735 | |||
| 1365 | 2736 | |||
| 1716 | 2737 | |||
| 1774 | 2748 | |||
| 1869 | 2747 | Newly identified | ||
| 2013 | 2740 | 2741 | 2742 | |
| 2122 | 2746 | Newly identified | ||
| 2250 | 2743 | |||
| 2295 | 2744 | |||
| 2582 | 2745 |
Supplementary Material
Acknowledgements
We thank Christos Savva, Giuseppe Cannone and Shaoxia Chen (MRC-LMB) for help with electron microscopes. We thank Sjors Scheres, Rafael Fernandez Leiro, Paul Emsley, Viswanathan Chandrasekaran and Simonas Masilius (MRC-LMB) for image processing and model building advice. We acknowledge Radu Aricescu (MRC-LMB) for help with the expression of TG in mammalian cells. Christina Heroven and Duncan Laverty (MRC-LMB) helped with mammalian tissue culture. We thank Frank Bürmann, and Greg Slodkowicz (MRC-LMB) for help with data analysis. Fusinita van den Ent and Tim Nierhaus (MRC-LMB) advised on protein work. We thank Toby Darling and Jake Grimmett (MRC-LMB) for computing support. We thank Dan Clare (eBIC Diamond Light Source) for EM data collection. We acknowledge Diamond Light Source for access and support of the cryo-EM facilities at the UK's National Electron Bio-imaging Centre (eBIC), funded by the Wellcome Trust, MRC and BBRSC. This work was funded by the Medical Research Council (U105184326 to JL), the Wellcome Trust (202754/Z/16/Z to JL, 203149 to JR) and by the Slovenian Research Agency (ARRS; P1-0048, IO-0048 and J1-7479 to DT). This work was supported by the Wellcome Trust through a Senior Research Fellowship (103139 to JR) and by the DFG, German Research Foundation (329673113 and EXC 2008/1 – 390540038 to JR).
Footnotes
Author Contributions
F.C. performed TG mammalian expression, cryo-EM, TG biochemistry, ELISA design and data analysis. F.C., J.L and D.T. built and refined the TG model. A.T.-V. and I.B. performed TPO biochemistry. V.T.C. performed expression of TG in mammalian cells with F.C.. T.I. collected initial negative staining data on eTG. M.R. developed initial eTG purifications. L.S., F.J.O. and J.R. performed crosslinking mass spectrometry analysis. F.C. and J.L. wrote the manuscript. J.L., F.C., D.T. and A.T.-V. were responsible for project strategy and data interpretation.
Author Information Statement
Reprints, permissions and materials may be requested from Dusan Turk (dusan.turk@ijs.si) or Jan Löwe (jyl@mrc-lmb.cam.ac.uk).
The authors declare no competing interests.
Data Availability Statement
Datasets generated during the current study are available ion the following repositories: PDB ID: 6SCJ; EMDB: EMD-10141; ProteomeXchange: PXD014821. All other data generated or analysed during this study are included in this published article (and its supplementary information files).
References
- 1.Di Jeso B, Arvan P. Thyroglobulin From Molecular and Cellular Biology to Clinical Endocrinology. Endocr Rev. 2016;37:2–36. doi: 10.1210/er.2015-1090. [DOI] [PMC free article] [PubMed] [Google Scholar]
- 2.Citterio CE, Targovnik HM, Arvan P. The role of thyroglobulin in thyroid hormonogenesis. Nat Rev Endocrinol. 2019;15:323–338. doi: 10.1038/s41574-019-0184-8. [DOI] [PubMed] [Google Scholar]
- 3.Carvalho DP, Dupuy C. Thyroid hormone biosynthesis and release. Mol Cell Endocrinol. 2017;458:6–15. doi: 10.1016/j.mce.2017.01.038. [DOI] [PubMed] [Google Scholar]
- 4.Cahnmann HJ, Pommier J, Nunez J. Spatial requirement for coupling of iodotyrosine residues to form thyroid hormones. Proc Natl Acad Sci U S A. 1977;74:5333–5335. doi: 10.1073/pnas.74.12.5333. [DOI] [PMC free article] [PubMed] [Google Scholar]
- 5.Holzer G, et al. Thyroglobulin Represents a Novel Molecular Architecture of Vertebrates. J Biol Chem. 2016;291:16553–16566. doi: 10.1074/jbc.M116.719047. [DOI] [PMC free article] [PubMed] [Google Scholar]
- 6.Taylor PN, et al. Global epidemiology of hyperthyroidism and hypothyroidism. Nat Rev Endocrinol. 2018;14:301–316. doi: 10.1038/nrendo.2018.18. [DOI] [PubMed] [Google Scholar]
- 7.Sellitti DF, Suzuki K. Intrinsic Regulation of Thyroid Function by Thyroglobulin. Thyroid. 2014;24:14. doi: 10.1089/thy.2013.0344. [DOI] [PMC free article] [PubMed] [Google Scholar]
- 8.Xiao S, Dorris ML, Rawitch AB, Taurog A. Selectivity in tyrosyl iodination sites in human thyroglobulin. Arch Biochem Biophys. 1996;334:284–294. doi: 10.1006/abbi.1996.0457. [DOI] [PubMed] [Google Scholar]
- 9.Heidelberger M. The molecular weight of thyroglobulin. Science. 1934;80:414. doi: 10.1126/science.80.2079.414. [DOI] [PubMed] [Google Scholar]
- 10.Gavaret JM, Cahnmann HJ, Nunez J. Thyroid Hormone Synthesis in Thyroglobulin. J Biol Chem. 1981;256:9167–9173. [PubMed] [Google Scholar]
- 11.Mondal S, Raja K, Schweizer U, Mugesh G. Chemistry and Biology in the Biosynthesis and Action of Thyroid Hormones. Angew Chem Int Ed. 2016;55:7606–7630. doi: 10.1002/anie.201601116. [DOI] [PubMed] [Google Scholar]
- 12.Gnidehou S, et al. Iodotyrosine dehalogenase 1 (DEHAL1) is a transmembrane protein involved in the recycling of iodide close to the thyroglobulin iodination site. FASEB J Off Publ Fed Am Soc Exp Biol. 2004;18:1574–1576. doi: 10.1096/fj.04-2023fje. [DOI] [PubMed] [Google Scholar]
- 13.Dedieu A, Gaillard J-C, Pourcher T, Darrouzet E, Armengaud J. Revisiting iodination sites in thyroglobulin with an organ-oriented shotgun strategy. J Biol Chem. 2011;286:259–269. doi: 10.1074/jbc.M110.159483. [DOI] [PMC free article] [PubMed] [Google Scholar]
- 14.Aricescu AR, Lu W, Jones EY. A time- and cost-efficient system for high-level protein production in mammalian cells. Acta Crystallogr D Biol Crystallogr. 2006;62:1243–1250. doi: 10.1107/S0907444906029799. [DOI] [PubMed] [Google Scholar]
- 15.Berg G, Björkman U, Ekholm R. The structure of newly synthesized intracellular thyroglobulin molecules. Mol Cell Endocrinol. 1980;20:87–98. doi: 10.1016/0303-7207(80)90096-9. [DOI] [PubMed] [Google Scholar]
- 16.Gunčar G, Pungerčič G, Klemenčič I, Turk V, Turk D. Crystal structure of MHC class II-associated p41 Ii fragment bound to cathepsin L reveals the structural basis for differentiation between cathepsins L and S. EMBO J. 1999;18:793–803. doi: 10.1093/emboj/18.4.793. [DOI] [PMC free article] [PubMed] [Google Scholar]
- 17.Molina F, Bouanani M, Pau B, Granier C. Characterization of the Type-1 Repeat from Thyroglobulin, a Cysteine-Rich Module Found in Proteins from Different Families. Eur J Biochem. 1996;240:125–133. doi: 10.1111/j.1432-1033.1996.0125h.x. [DOI] [PubMed] [Google Scholar]
- 18.Lee J, Arvan P. Repeat motif-containing regions within thyroglobulin. J Biol Chem. 2011;286:26327–26333. doi: 10.1074/jbc.M111.242099. [DOI] [PMC free article] [PubMed] [Google Scholar]
- 19.Citterio CE, Morishita Y, Dakka N, Veluswamy B, Arvan P. Relationship between the dimerization of thyroglobulin and its ability to form triiodothyronine. J Biol Chem. 2018;293:4860–4869. doi: 10.1074/jbc.RA118.001786. [DOI] [PMC free article] [PubMed] [Google Scholar]
- 20.Yang S-X, Pollock HG, Rawitch AB. Glycosylation in Human Thyroglobulin: Location of the N-Linked Oligosaccharide Units and Comparison with Bovine Thyroglobulin. Arch Biochem Biophys. 1996;327:61–70. doi: 10.1006/abbi.1996.0093. [DOI] [PubMed] [Google Scholar]
- 21.Lamas L, Andersont Peggy C, Foxy Jay W, Dunn John T. Consensus Sequences for Early Iodination and Hormonogenesisn Human Thyroglobulin. J Biol Chem. 1989;264:5. [PubMed] [Google Scholar]
- 22.Pommier J, Deme D, Nunez J. Effect of Iodide Concentration on Thyroxine Synthesis Catalysed by Thyroid Peroxidase. Eur J Biochem. 1973;37:406–414. doi: 10.1111/j.1432-1033.1973.tb03000.x. [DOI] [PubMed] [Google Scholar]
- 23.de Vijlder J, den Hartog M. Anionic iodotyrosine residues are required for iodothyronine synthesis. Eur J Endocrinol. 1998;138:227–231. doi: 10.1530/eje.0.1380227. [DOI] [PubMed] [Google Scholar]
- 24.Dunn J, Kim PS, Dunn AD. Favored Sites for Thyroid Hormone Formation on the Peptide Chains of Human Thyroglobulin. J Biol Chem. 1982;257:88–94. [PubMed] [Google Scholar]
- 25.Botta R, et al. Sortilin is a putative postendocytic receptor of thyroglobulin. Endocrinology. 2009;150:509–518. doi: 10.1210/en.2008-0953. [DOI] [PubMed] [Google Scholar]
- 26.Weber J, et al. Interdependence of thyroglobulin processing and thyroid hormone export in the mouse thyroid gland. Eur J Cell Biol. 2017;96:440–456. doi: 10.1016/j.ejcb.2017.02.002. [DOI] [PubMed] [Google Scholar]
- 27.Rivolta CM, Targovnik HM. Molecular advances in thyroglobulin disorders. Clin Chim Acta. 2006;374:8–24. doi: 10.1016/j.cca.2006.05.043. [DOI] [PubMed] [Google Scholar]
- 28.Latrofa F, et al. Thyroglobulin autoantibodies in patients with papillary thyroid carcinoma: comparison of different assays and evaluation of causes of discrepancies. J Clin Endocrinol Metab. 2012;97:3974–3982. doi: 10.1210/jc.2012-2406. [DOI] [PubMed] [Google Scholar]
- 29.Fiore E, Latrofa F, Vitti P. Iodine, thyroid autoimmunity and cancer. Eur Thyroid J. 2015;4:26–35. doi: 10.1159/000371741. [DOI] [PMC free article] [PubMed] [Google Scholar]
- 30.Guo J, Mclachlan SM, Hutchison S, Rapoport B. The Greater Glycan Content of Recombinant Human Thyroid Peroxidase of Mammalian Than of Insect Cell Origin Facilitates Purification to Homogeneity of Enzymatically Protein Remaining Soluble at High Concentration. Endocrinology. 1998;139:7. doi: 10.1210/endo.139.3.5782. [DOI] [PubMed] [Google Scholar]
- 31.Bokori-Brown M, et al. Cryo-EM structure of lysenin pore elucidates membrane insertion by an aerolysin family protein. Nat Commun. 2016;7 doi: 10.1038/ncomms11293. 11293. [DOI] [PMC free article] [PubMed] [Google Scholar]
- 32.Zheng SQ, et al. MotionCor2 - anisotropic correction of beam-induced motion for improved cryo-electron microscopy. Nat Methods. 2017;14:331–332. doi: 10.1038/nmeth.4193. [DOI] [PMC free article] [PubMed] [Google Scholar]
- 33.Zhang K. Gctf: Real-time CTF determination and correction. J Struct Biol. 2016;193:1–12. doi: 10.1016/j.jsb.2015.11.003. [DOI] [PMC free article] [PubMed] [Google Scholar]
- 34.Scheres SHW. RELION: Implementation of a Bayesian approach to cryo-EM structure determination. J Struct Biol. 2012;180:519–530. doi: 10.1016/j.jsb.2012.09.006. [DOI] [PMC free article] [PubMed] [Google Scholar]
- 35.Zivanov J, et al. New tools for automated high-resolution cryo-EM structure determination in RELION-3. eLife. 2018;7:e42166. doi: 10.7554/eLife.42166. [DOI] [PMC free article] [PubMed] [Google Scholar]
- 36.Li Y, et al. Mechanistic insights into caspase-9 activation by the structure of the apoptosome holoenzyme. Proc Natl Acad Sci. 2017;114:1542–1547. doi: 10.1073/pnas.1620626114. [DOI] [PMC free article] [PubMed] [Google Scholar]
- 37.Waterhouse A, et al. SWISS-MODEL: homology modelling of protein structures and complexes. Nucleic Acids Res. 2018;46:W296–W303. doi: 10.1093/nar/gky427. [DOI] [PMC free article] [PubMed] [Google Scholar]
- 38.Pettersen EF, et al. UCSF Chimera--a visualization system for exploratory research and analysis. J Comput Chem. 2004;25:1605–1612. doi: 10.1002/jcc.20084. [DOI] [PubMed] [Google Scholar]
- 39.Turk D. MAIN software for density averaging, model building, structure refinement and validation. Acta Crystallogr D Biol Crystallogr. 2013;69:1342–1357. doi: 10.1107/S0907444913008408. [DOI] [PMC free article] [PubMed] [Google Scholar]
- 40.Emsley P, Cowtan K. Coot: model-building tools for molecular graphics. Acta Crystallogr D Biol Crystallogr. 2004;60:2126–2132. doi: 10.1107/S0907444904019158. [DOI] [PubMed] [Google Scholar]
- 41.Söding J, Biegert A, Lupas AN. The HHpred interactive server for protein homology detection and structure prediction. Nucleic Acids Res. 2005;33:W244–W248. doi: 10.1093/nar/gki408. [DOI] [PMC free article] [PubMed] [Google Scholar]
- 42.Drozdetskiy A, Cole C, Procter J, Barton GJ. JPred4: a protein secondary structure prediction server. Nucleic Acids Res. 2015;43:W389–W394. doi: 10.1093/nar/gkv332. [DOI] [PMC free article] [PubMed] [Google Scholar]
- 43.Afonine PV, et al. Real-space refinement in PHENIX for cryo-EM and crystallography. Acta Crystallogr Sect Struct Biol. 2018;74:531–544. doi: 10.1107/S2059798318006551. [DOI] [PMC free article] [PubMed] [Google Scholar]
- 44.Shevchenko A, Tomas H, Havli J, Olsen JV, Mann M. In-gel digestion for mass spectrometric characterization of proteins and proteomes. Nat Protoc. 2006;1:2856–2860. doi: 10.1038/nprot.2006.468. [DOI] [PubMed] [Google Scholar]
- 45.Rappsilber J, Ishihama Y, Mann M. Stop and go extraction tips for matrix-assisted laser desorption/ionization, nanoelectrospray, and LC/MS sample pretreatment in proteomics. Anal Chem. 2003;75:663–670. doi: 10.1021/ac026117i. [DOI] [PubMed] [Google Scholar]
- 46.Mendes ML, et al. An integrated workflow for crosslinking mass spectrometry. 2018 doi: 10.1101/355396. [DOI] [PMC free article] [PubMed] [Google Scholar]
- 47.Fischer L, Rappsilber J. Quirks of Error Estimation in Cross-Linking/Mass Spectrometry. Anal Chem. 2017;89:3829–3833. doi: 10.1021/acs.analchem.6b03745. [DOI] [PMC free article] [PubMed] [Google Scholar]
- 48.Ledeţi I, et al. Thermal stability of synthetic thyroid hormone l-thyroxine and l-thyroxine sodium salt hydrate both pure and in pharmaceutical formulations. J Pharm Biomed Anal. 2016;125:33–40. doi: 10.1016/j.jpba.2016.03.026. [DOI] [PubMed] [Google Scholar]
Associated Data
This section collects any data citations, data availability statements, or supplementary materials included in this article.


