

Abstract
The existing market of beverages is in utmost need of non-conventional and cheaper option of a functional protein beverage. The primary goal of this research was to formulate a beverage using prepared from roasted Bengal gram (sattu) which can provide health benefits. Fortified sattu beverage was prepared by incorporating pectin, citric acid, ascorbic acid and sugar as additives with beetroot juice was added for the enrichment and coloration of beverage in four different proportions viz. 5%, 10%, 15% and 20% labelled as A, B, C and D. Beverage without enrichment was taken as blank sample. After formulation, physio-chemical parameters of beverage were measured which included pH, TSS, protein content, sedimentation index and color. For antioxidant potential, DPPH and ABTS methods were performed followed by measurement of TPC, TFC and Betalain content. Sensory analysis of beverage was also performed to determine the consumer acceptability. Sample containing 10% beetroot juice was observed to have the optimal formulation amongst all with regards to sedimentation index (24.86), protein content (28.10%), pH (3.83), TSS (7.43°Brix), acidity (0.522%), DPPH activity (83.22%), ABTS scavenging assay (70.38%), phenolic content (42.49 mg GAE/g), flavonoid content (50.51 mg RE/g). The lightness L* (− 6.3), redness a* (3.2) and greenness b* (0.8) were the color values of this sample.
Keywords: Sattu, Beetroot, Enrichment, Beverage, Protein, Antioxidants
Introduction
The chickpea or Bengal gram is extensively cultivated in Canada, Egypt, Western-China and other Asian countries. Its products are also very popular among these countries (Sanjeewa et al. 2010; Kahlon et al. 2005; El-Adawy 2002). Roasting and grinding of these cereals or legumes commonly done in eastern states of India to prepare a powder, which is called Sattu. It is made by conjunction of cereals and legumes wherein flavours are also added. The most preferable cereal for making sattu is Bengal gram or chickpea. In rural India sattu is considered as a supplement because of its higher protein percent, better shelf life, easy availability and taste (Mridula et al. 2010). The chickpea flour possesses high antioxidant content and phenolic content. Bengal gram contains 22% of protein on dry weight basis and 19–22.7% of dietary fibre. It also contains lectins and agglutinins which can be anticancer, immunomodulatory, anti-obesity in nature (Jogihalli et al. 2017).
The recommended intake of dietary protein is 0.8 g/kg/day (Batool et al. 2015). In developing countries, protein malnutrition is directly linked with oxidative damage due to lower antioxidant levels in turn individuals are susceptible to chronic diseases (Gruenwald 2009). Although, animal protein is cheap but it increases risk of chronic diseases due to higher saturated fat and cholesterol content (Apaiah and Hendrix 2005).
Among the functional foods, beverages have acquired more attention because of easy consumption and have proved as potential medium for nutrient supply. Commercial beverages contain certain chemical preservatives and additives which are the major causes of diet related chronic diseases (Pèrez-Cataluña et al. 2018). Some of the beverages prepared by fermentation of cereal grains are beer from barley and maize, tella from barley, opaque and cloudy beers from sorghum and millets etc. Cereals based non-alcoholic fermented beverages are common in some parts of African countries viz. Mahewu, Motoho, Bushera, etc. (Waters et al. 2015).
Though sattu has been used in different bakery products, ready-to-eat products, snacks etc., its drink has never been standardized, characterized and commercialized. People have been consuming its drink in traditional way since. Common fruit and vegetable-based beverages lacks protein and dietary fibres (Iglesias et al. 2016). Hence, in this context, intent was made to increase the nutritional value of the beverage of sattu by adding beetroot juice. Beetroot is grown and consumed worldwide in raw form as salad, frozen products, juices etc. Juice is loaded with antioxidants and nutrients such as phosphorus, potassium, sodium, calcium, iron, zinc and magnesium. A water-soluble pigment, betalain present in beetroot exhibits anticarcinogenic, anti-inflammatory and hepatoprotective properties. The protein content of beetroot juice is 2–3% (Chhikara et al. 2019). On the other hand, sattu has higher protein content but it lacks antioxidants and colour is also not tempting for consumer.
Hence, Bengal gram products can be fortified with beetroot juice to elevate the bioactive compound content thereby increasing the antioxidant potential. The present work involves standardized process and formulation for the sattu beverage and its characterization. The physio-chemical properties, antioxidant properties and sensory characteristics was analysed for better understanding of the product.
Materials and methods
Chemicals
1,1-Diphenyl-2-picrylhydrazyl (DPPH), 2,2-azino-bis-3-ethylbenzthiazoline-6-sulphonic acid (ABTS) and Folin–Ciocalteau Reagent were purchased from Himedia Laboratories Private Limited, India. Sodium carbonate, gallic acid and ascorbic acid were purchased from Molychem, India. Aluminium chloride, rutin, pectin and sulphuric acid were purchased from Loba Chemie Private Limited, India. Citric acid was purchased from Merck Specialities Private Limited, India. All solutions were prepared by using Merck Millipore water (Millipore). Citric acid, Ascorbic acid, Pectin and Sugar was added in the beverage as acidity regulator, preservative, stabilizer and sweetener, respectively.
Sattu beverage preparation
Roasted Bengal gram was procured from the local market of Raipur (India). The seed coat was removed and the Bengal gram was collected separately. Sattu was prepared by grinding the roasted Bengal gram in a Bajaj mixer grinder (Model name: Popular mixer grinder). Grounded Bengal gram was sieved to get a size of sattu. The beetroot was washed, cleaned and sliced into small pieces. The juice was prepared using a domestic juicer, which was then stored at refrigerated condition until further use. The sattu beverage was prepared by enrichment with beetroot juice at the proportion of 5%, 10%, 15% and 20%, mixed thoroughly. Sample A, sample B, sample C and sample D denotes the four different proportions: 5%, 10%, 15% and 20%, respectively, of sattu used for beverage formulations. Further, sugar syrup (prepared by heating the sugar with water in the ratio of 1:1) and 0.3% of citric acid was also added to this syrup, as per Goods Manufacturing Practices (GMP) regulations for food additives. 0.5% of pectin was added to the beverage as a stabilizer as per the GMP regulations. These samples were heated at 65 °C for the gelatinization of starch. The beverage was pasteurized at 72 °C for 15 s. Each sample was packed and refrigerated separately in Amber colour bottle.
Physio-chemical properties of sattu beverage
pH and TSS
The pH of the samples was measured using a calibrated digital pH meter (Model-111 Electronics India). The total soluble solids (TSS) of each beverage sample was determined by a bench top Abbe refractometer (Model No. 135005 Contech Limited) and expressed in °Brix.
Protein content
For the determination of protein content in beverage, the AOAC method was adopted. A Micro-Kjeldahl apparatus was used to determine the nitrogen in the beverage and the protein content was calculated.
Antioxidant analysis of sattu beverage
DPPH antioxidant activity
The antioxidant activity was determined by DPPH method. In brief, 100 µl of sample was mixed with 3900 µl of 0.1 mM freshly prepared DPPH solutions and the samples were incubated in dark at room temperature for 30 min. The absorbance was taken for each sample at 517 nm wavelength, ascorbic acid was considered as standard and the antioxidant activity was calculated by the below mentioned equation
| 1 |
ABTS radical scavenging assay
The ABTS radical scavenging assay was performed by the method described by Awe et al. (2013). In brief, 7 mM of aqueous solution of ABTS was mixed with 2.45 mM K2S2O8 was kept in dark for 14 h the generation of ABTS+ ions. After the generation of cations, the working solution was prepared by adjustment of absorbance up to 0.70 ± 0.02 at 734 nm wavelength using ethanol for dilution. Now, 0.2 ml of diluted beverage samples were mixed with 2 ml of prepared ABTS solution and the absorbance was measured at 734 nm. The scavenging capacity was calculated by the formula
| 2 |
Phenolic and flavonoid content of beverage
The total phenolic content (TPC) of the beverage samples was determined by Folin Ciocalteau method. In brief, 200 µl of sample was mixed with 1720 µl of Merck Millipore water, 80 µl of Folin–Ciocalteau reagent was added to the solution and mixed thoroughly. 200 µl of 20% Na2CO3 was added further followed by the addition of 1800 µl of water, to make up a volume of 4 ml. The absorbance reading was taken at 725 nm in the UV–Vis Spectrophotometer for each sample. Gallic acid was taken as standard and the TPC was calculated using a calibration curve of Gallic acid. The results were expressed in terms of gallic acid equivalent (GAE).
For the determination of total flavonoid content (TFC), the Aluminium chloride method considered. About 200 µl of beverage was diluted in the ratio of 1:10, 1.25 ml of Merck Millipore water was added followed by addition of 75 µl of 5% Sodium Nitrite solution. After 5 min 150 µl of 10% Aluminium Chloride solution was added to the reaction mixture. 500 µl of 1 M NaOH was again added after 6 min of incubation to stabilize the reaction mixture. The absorbance of samples was measured at 734 nm and total flavonoid content was calculated by plotting a calibration curve of Rutin, which was considered as standard. The results were expressed as Rutin equivalents (RE).
Betalain content
The betalain content of samples was measured by the spectrophotometric method (Wruss et al. 2015). The samples were diluted appropriately before the measurement. Betacyanin and betaxanthin contents were calculated separately and their sum was used to calculate the total betalain content (mg/L). Absorbance for betacyanin was measured at 536 nm while for betaxanthin was 485 nm. The formula used is mentioned below
| 3 |
where for Betacyanin MW (Molecular weight) = 550 g/mol, A = A536nm – A650nm, ε (Molar extinction coefficient in L × mol−1 × cm−1) = 60,000. Similarly, for betaxanthin MW (Molecular weight) = 339 g/mol, A = A485nm – A650nm, ε (Molar extinction coefficient in L × mol−1 × cm−1) = 48,000, DF = Dilution factor, i = path length in cm.
Rheological analysis of sattu beverage
The rheological analysis of the beverage samples was performed to calculate the viscosity and identify the flow behaviour. A Rheometer MCR 102 (Anton Paar, GmbH, Germany) equipped with 4-bladed impeller ST22-4V-40 was used for this analysis, the temperature for sample analysis was considered as 20 ± 2 °C. The impeller was inserted vertically into the specimen container filled with beverage sample. The shear rate range of 1–100 s−1 was defined for the rheological analysis. About 100 data points were taken during total duration of 300 s, the time interval was 3 s for this analysis. The measurements were done in triplicate for each sample using the Rheoplus software (Meher et al. 2017).
Sedimentation Index (SI)
The sedimentation index was determined by the method explained by Cano-Ruiz and Richter (1998). The beverage samples were mixed properly which was further transferred into 15 ml test tubes. The initial height of the sample in test tube was denoted as ho. The samples were subjected to centrifugation at 3000 rpm for 20 min, the height of sediment measured was denoted by hf. The SI was calculated by the following equation
| 4 |
Colour analysis
The color analysis of beverage was done by using Konika Minolta CR-10 Plus Lab Colorimeter. The instrument was calibrated prior to the analysis. The color coordinates were measured in terms of L*, a* and b* which corresponds to lightness/darkness, redness (+)/greenness (−) and yellowness (+)/blueness (−). ∆E denotes the color difference between the control sample and fortified samples of beverage. All the measurements were recorded in triplicate.
Sensory analysis
The enriched beverage samples were subjected to 9-point hedonic test for evaluation of sensory characteristics. The rating for 9 points were 1-like extremely, 8-like very much, 7-like moderately, 6-like slightly, 5-neither like nor dislike, 4-dislike slightly, 3-dislike moderately, 2-dislike very much and 1-dislike extremely. An untrained and unprofessional panel was randomly selected from the faculty, staff and students of the department for sensory analysis. They were asked to rate the samples on the basis of colour, flavour, odour and overall acceptability.
Statistical analysis
All the experimental data was recorded in triplicate and represented as mean ± standard deviation. One-way ANOVA was applied for statistical analysis using the Microsoft Excel 2016 Data Analysis Toolpack. The p value was used to identify the significance of dataset i.e. p ≤ 0.05 when the values were significant and p ≥ 0.05 when the values were non-significant.
Results and discussion
Physicochemical analysis
Physicochemical parameters of 10% aqueous sattu beverage (pH, TSS, protein% and acidity %) were measured for the blank sample (0% beetroot juice), sample A (5% beetroot juice), sample B (10% beetroot juice), sample C (15% beetroot juice) and sample D (20% beetroot juice) and is depicted in Table 1. Enrichment with beet root had a significant effect on pH of beverage. The control sample showed a pH of 3.47 ± 0.016 which increased for sample A (3.92 ± 0.012) as beet root was added in 5% volume fraction, whereas decreases as we go from sample B to sample D i.e. volume fraction of beet root was increased. The p value denoted that pH of control sample, sample A and sample B were found to be significant (p ≤ 0.05) The increment of pH in sample A was due to the high pH of beetroot juice (5.5) compared to blank sample. The decrement in pH of other samples can be correlated to the fact that organic acids and amino acids are generated because of the influence of ascorbic acid on sugar and proteins of the beverage (Yadav et al. 2010). Citric acid was added as acidity regulator and Ascorbic acid was added as preservative, they also improved the flavour and taste. On the other hand, they contribute to the tartness and tanginess in beverage, which helps in balancing the sweetness (Reddy et al. 2016). Moreover, the acidity was observed to be increasing with the increase in enrichment of sattu beverage by beetroot juice. This observation can be justified by the results of pH decrement in the beverage samples. The high acidity of beverage samples is an indicator of high proportion of organic acids present. This can aid in prevention of food spoilage and increase the shelf-life. Also, the significant values (p ≤ 0.05) of acidity was recorded for control sample, sample A and sample B. The TSS for control sample was 7.35 ºBrix which kept on increasing with the increase of enrichment proportion and reached the highest for sample D i.e. 8.50 ºBrix. This can be due to the liberation of simple carbohydrates from complex sugars after their hydrolytic breakdown. It shows that TSS is affected by addition of sugar and fruit juice content, similar results were also reported (Serpa-Guerra et al. 2018). The protein content of the beverage was also observed to increase with the enrichment percentage. For control sample it was 21.62%, it acquired the highest value of 33.85% for sample D. This change was intentional because of the addition of beetroot juice to non-enriched sattu beverage. The elevated level of protein in the beverage is the reason behind formulation of this beverage. Hence sample B was found to exhibit the significant values (p ≤ 0.05) of physicochemical parameters pH 3.83, TSS 7.43°Brix, protein 28.10% and titratable acidity 0.522.
Table 1.
Physicochemical analysis of beverage samples
| Sample | pH | TSS (ºBrix) | Protein % | Acidity % |
|---|---|---|---|---|
| Blank | 3.47 ± 0.016a | 7.35 ± 0.034a | 21.62 ± 0.46b | 0.495 ± 0.012a |
| Sample A | 3.92 ± 0.012a | 7.40 ± 0.041a | 25.62 ± 0.46a | 0.512 ± 0.010a |
| Sample B | 3.83 ± 0.032a | 7.43 ± 0.047a | 28.10 ± 0.30a | 0.522 ± 0.015a |
| Sample C | 3.77 ± 0.026b | 7.80 ± 0.040b | 30.41 ± 0.37b | 0.531 ± 0.010a |
| Sample D | 3.70 ± 0.012b | 8.50 ± 0.045b | 33.85 ± 0.26a | 0.544 ± 0.005b |
The superscript ‘a’ depicts the significant data when p ≤ 0.05 and superscript ‘b’ represents the non-significant data when p ≥ 0.05
Antioxidant profile
Antioxidant attribute is one of the important characteristics along with taste and colour of this beverage. The non-enriched sattu beverage showed 22.15% (p ≤ 0.05) and 22.85% (p ≤ 0.05) of DPPH antioxidant activity and ABTS radical scavenging capacity (Table 2). Antioxidant profile of the enriched beverage was observed to increase in accordance to the juice proportion. Beetroot juice based sattu beverage showed increased antioxidant activity. The antioxidant activity was found to be 80.97% (p ≤ 0.05), 83.22% (p ≤ 0.05), 84.63% (p ≥ 0.05) and 88.15% (p ≤ 0.05) for sample A, sample B, sample C and sample D, respectively. Similarly, ABTS radical scavenging capacity for sample A, sample B, sample C and sample D was calculated to be 65.09% (p ≥ 0.05), 70.38% (p ≤ 0.05), 75.42% (p ≤ 0.05) and 77.85% (p ≥ 0.05), respectively. The increase in both parameters is the evidence of phytochemicals addition to sattu beverage, via incorporation of beetroot juice volume fraction. The TPC of formulated beverage increased to 62.70 mg GAE/g (for sample D) from 31.12 mg GAE/g for control, by the addition of enrichment (Table 3). TFC for control sample was 48.16 mg RE/g (Table 3). TFC of the formulated beverages was 50.48 mg RE/g, 50.51 mg RE/g, 56.31 mg RE/ g and 67.36 mg RE/g for sample A, sample B, sample C and sample D, respectively, and here again an increase was observed with the incorporation of beet root juice. The values of DPPH, ABTS, TPC and TFC depicts that the beetroot juice has significantly (p ≤ 0.05) affected the antioxidant profile of the sattu beverage.
Table 2.
DPPH antioxidant activity, ABTS radical scavenging assay, TPC, TFC and Betalain content of beverage samples
| Sample | DPPH (%) | ABTS (%) | TPC (mg GAE/g) | TFC (mg RE/g) | Betacyanin (mg/100 ml) | Betaxanthin (mg/100 ml) |
|---|---|---|---|---|---|---|
| Blank | 22.15 ± 0.94a | 22.85 ± 0.11a | 31.12 ± 0.57a | 48.16 ± 0.23a | Nil | Nil |
| Sample A | 80.97 ± 0.90a | 65.09 ± 3.87b | 38.21 ± 3.16b | 50.48 ± 0.15a | 54.44 ± 0.30a | 20.44 ± 0.38b |
| Sample B | 83.22 ± 0.35a | 70.38 ± 1.14a | 42.49 ± 1.42a | 50.51 ± 0.90a | 59.14 ± 0.19b | 23.46 ± 0.25a |
| Sample C | 84.63 ± 0.34b | 75.42 ± 1.04a | 49.58 ± 0.63a | 56.31 ± 0.21b | 64.95 ± 0.26a | 29.73 ± 0.21b |
| Sample D | 88.15 ± 0.12a | 77.85 ± 0.64b | 62.70 ± 0.30b | 67.36 ± 0.90b | 65.16 ± 0.07b | 29.98 ± 0.14a |
The superscript ‘a’ depicts the significant data when p ≤ 0.05 and superscript ‘b’ represents the non-significant data when p ≥ 0.05
Table 3.
Apparent viscosity, consistency index, flow behaviour index and sedimentation index of beverage samples
| Sample | Apparent viscosity (Pa s) | Consistency Index (k) | Flow behaviour index (n) | Sedimentation Index |
|---|---|---|---|---|
| Blank | 0.0036 ± 0.002a | 8.7302 × 10⁻⁵ a | 1.9021a | 33.51 ± 0.98b |
| Sample A | 0.0030 ± 0.001a | 1.4264 × 10⁻⁴ a | 1.7955b | 23.04 ± 0.42a |
| Sample B | 0.0036 ± 0.001a | 9.7902 × 10⁻⁵ a | 1.8545a | 24.86 ± 0.26b |
| Sample C | 0.0037 ± 0.002b | 7.081 × 10⁻⁵ a | 1.9428a | 32.73 ± 0.57a |
| Sample D | 0.0040 ± 0.002b | 1.11275 × 10⁻⁴ b | 1.8806a | 47.89 ± 0.85b |
The superscript ‘a’ depicts the significant data when p ≤ 0.05 and superscript ‘b’ represents the non-significant data when p ≥ 0.05
Betalain content
Betalains are the natural colouring compounds present in beetroot. They have been reported to possess huge antioxidant potential. Betalain content is evaluated by betacyanin and betaxanthin content. Table 2 represents the calculated values of betacyanin and betaxanthin content of the enriched beverage samples and control samples. The amount of betalain significantly (p ≤ 0.05) increased with enrichment which has played crucial role in colouring of the beverage. The colour has become more intense which is further discussed in subsequent sections.
Sedimentation Index
The suspended particles in the beverage tend to sediment at the bottom. This behaviour can be countered by addition of stabilizer and sedimentation index is an indicator of beverage stability. The sedimentation indices are depicted in Table 3 for all the samples. The control sample showed a SI of 33.51 (p ≥ 0.05) which tends to decrease during the enrichment for sample A, sample B and sample C to 23.04 (p ≤ 0.05), 24.86 (p ≥ 0.05) and 32.73 (p ≤ 0.05) respectively. This variation was observed due to the impact of pectin on beverage which was used as a stabilizing agent. However, for sample D the SI was 47.89 (p ≥ 0.05) which might be due to degradation or breakdown of pectin into monomers of saccharides. The high value of SI is highly undesirable in beverages because it decreases the stability and nutritional quality of beverage. The control sample showed higher sedimentation index because of absence of any of the stabilizing agent. The aggregation of degraded protein present in sattu might be the reason for the sedimentation as described by Baccouche et al. (2013).
Rheological analysis
The rheogram in Fig. 1 depicts the flow behaviour of blank sample, sample A, sample B, sample C and sample D. Table 3 represents the apparent viscosity, consistency index and flow behaviour index of sattu beverage samples. The apparent viscosity for control sample was 0.0036 Pa s (p ≤ 0.05) which decreased to 0.0030 Pa s (p ≤ 0.05) for sample A which might be due to the fact that sattu beverage has been diluted by beetroot juice. The apparent viscosity again increased to 0.0036 Pa s (p ≤ 0.05), 0.0037 (p ≥ 0.05) and 0.0040 Pa s (p ≥ 0.05) for sample B, sample C and sample D respectively. Since, the beetroot juice has indigenous sugar which is complex in nature. Hence, this sugar had participated with pectin to increase the viscosity of beverages after 5% enrichment. It was confirmed by the sensory test done by the panel members for sensory attributes. Pectin and beetroot juice concentration had significant impact on degradability and stability by shear stress of sattu beverage. Similar, observations were reported for fruit yogurt and lactic beverage, respectively (Singh and Muthukumarappan 2008; Penna et al. 2001). Since, the viscosity was increasing the data analysis was done by Herschel–Bulkley fluid model by calculating the consistency index and flow behaviour index. The consistency index was also indicating that there is an increase in viscosity of the beverage samples. The flow behaviour index of all beverage sample was found be greater than 1 which shows that the beverage was a shear thickening fluid (dilatant fluid).
Fig. 1.

Rheogram of formulated sattu beverage: Blank sample (○), sample A (□), sample B (◊), sample C (×) and sample D (+). Lines represent fitted model data
Color
The color measurement of the enriched samples is represented in Table 4 and Fig. 2. The spider chart shows relationship between sensory attributes and samples. Control sample, Sample A, Sample B, Sample C and Sample D is denoted by numeric 1, 2, 3, 4 and 5 at the edges of pentagon chart. The color of sattu beverage before enrichment was dirty yellowish. The L*, a* and b* values were recorded to be 28.9, 0.7 and 1.2 for blank sample. The data shows that sattu was brighter; redness was very less compared to yellowness which was due to roasting as explained by Jogihalli et al. (2017). After enrichment, sample A showed L*, a* and b* values of − 5.7, 4.1 and − 0.7 which represents that the beverage became darker and bluish-red in color. Brightness was observed to be increasing for the rest of the beverage samples. Redness was found to be decreasing and increasing for sample B, C and D in a non-uniform manner which might be due to instability of betalains in the beverage. However, blueness of sample B and C was similar to sample B but it increased for sample D which can be due to the increased proportion of betalains in the beverage. Similar interpretations were made for fortified orange juice. The difference in color was equivalent for all the samples (Jairajpuri and Qadri 2015).
Table 4.
Sensory and colour attributes of beverage samples
| Attributes | Colour | Flavour | Odour | Overall acceptability | L* | a* | b* | ∆E |
|---|---|---|---|---|---|---|---|---|
| Blank | 4 ± 0.5a | 4 0. ± 23a | 3 0. ± 82a | 3.3 ± 0.21a | 28.9 | 0.7 | 1.2 | |
| Sample A | 8 ± 0.04a | 7.5 ± 0.65b | 7.8 ± 0.73b | 7.7 ± 0.12a | − 5.7 | 4.1 | − 0.7 | 7.1 |
| Sample B | 8.2 ± 0.09a | 7.2 ± 0.44a | 7.3 ± 0.47b | 7.4 ± 0.32a | − 6.3 | 3.2 | − 0.8 | 7.1 |
| Sample C | 8.5 ± 0.5a | 6.8 ± 0.76b | 6.4 ± 0.33b | 7.2 ± 0.93b | − 6.2 | 3.6 | − 0.7 | 7.2 |
| Sample D | 8.8 ± 0.33b | 6.1 ± 0.48a | 5.8 ± 0.52b | 6.9 ± 0.55b | − 6.2 | 2.7 | − 1.1 | 6.9 |
The superscript ‘a’ depicts the significant data when p ≤ 0.05 and superscript ‘b’ represents the non-significant data when p ≥ 0.05
Fig. 2.
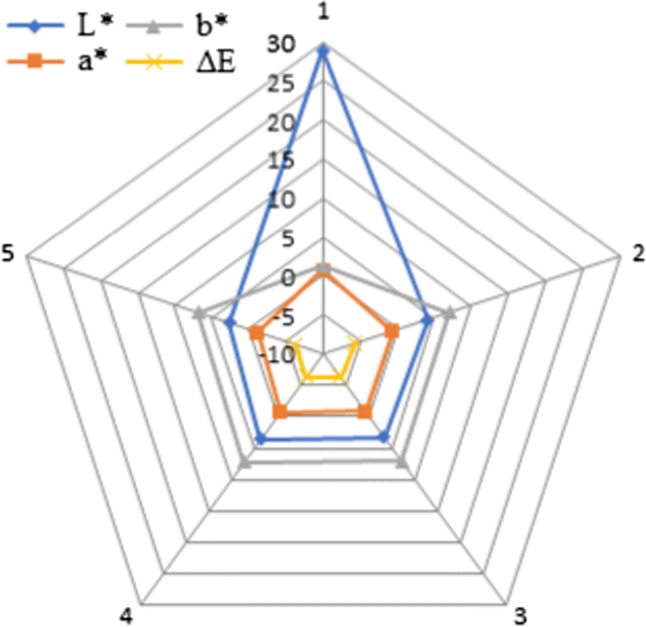
Spider chart for colour analysis of beverage samples where L*, a*, b* and ∆E are lightness, redness, greenness and color difference, respectively. Edges 1, 2, 3, 4 and 5 represent blank sample, sample A sample B, sample C and sample D
Sensory analysis
Table 4 depicts the ratings for colour, flavour, odour and overall acceptability of all the beverage samples. The blank sample showed a lower value for each attribute and the panel slightly disliked the blank samples. Colour was the most liked attribute of the beverage which kept on increasing for the enriched samples and the panel members liked it very much. The attraction towards the colour was due to the vibrant purple-red coloured of the beverage after enrichment. The likeability of all the sensory attributes kept on declining after sample A which shows that addition of beetroot juice above 5% is not acceptable. Hence, it can be concluded that the sattu beverage with 5% of beetroot juice is the best formulation in terms of sensory characteristics.
Conclusion
The research work on formulation, standardization and characterization of sattu beverage concludes that it can be alternative to conventional protein beverage. The beverage showed improved protein content along with better antioxidant profile. The beverage was appreciated in terms of appearance and taste. Moreover, the panel found it to be thirst quenching and refreshing. Sample B which contained 10% sattu and 10% beetroot juice was the best formulated sattu beverage. However, sedimentation was observed to be one of the parameters which needs more attention for further improvement of beverage.
Footnotes
Publisher's Note
Springer Nature remains neutral with regard to jurisdictional claims in published maps and institutional affiliations.
References
- Apaiah RK, Hendrix EMT. Design of a supply chain network for pea-based novel protein foods. J Food Eng. 2005;70(3):383–391. doi: 10.1016/j.jfoodeng.2004.02.043. [DOI] [Google Scholar]
- Awe FB, Fagbemi TN, Ifesan BOT, Badejo AA. Antioxidant properties of cold and hot water extracts of cocoa, Hibiscus flower extract, and ginger beverage blends. Food Res Int. 2013;52(2):490–495. doi: 10.1016/j.foodres.2013.01.021. [DOI] [Google Scholar]
- Baccouche A, Ennouri M, Felfoul I, Attia H. A physical stability study of whey-based prickly pear beverages. Food Hydrocoll. 2013;33(2):234–244. doi: 10.1016/j.foodhyd.2013.03.007. [DOI] [Google Scholar]
- Batool R, Butt MS, Sultan MT, Saeed F, Naz R. Protein-energy malnutrition: a risk factor for various ailments. Crit Rev Food Sci Nutr. 2015;55(2):242–253. doi: 10.1080/10408398.2011.651543. [DOI] [PubMed] [Google Scholar]
- Cano-Ruiz ME, Richter RL. Changes in physicochemical properties of retort-sterilized dairy beverages during storage. J Dairy Sci. 1998;81(8):2116–2123. doi: 10.3168/jds.S0022-0302(98)75787-X. [DOI] [PubMed] [Google Scholar]
- Chhikara N, Kushwaha K, Sharma P, Gat Y, Panghal A. Bioactive compounds of beetroot and utilization in food processing industry: a critical review. Food Chem. 2019;272:192–200. doi: 10.1016/j.foodchem.2018.08.022. [DOI] [PubMed] [Google Scholar]
- El-Adawy Tarek A. Nutritional composition and antinutritional factors of chickpeas (Cicer arietinum L.) undergoing different cooking methods and germination. Plant Foods Hum Nutr. 2002;57(1):83–97. doi: 10.1023/A:1013189620528. [DOI] [PubMed] [Google Scholar]
- Gruenwald J. Novel botanical ingredients for beverages. Clin Derma. 2009;27:210–216. doi: 10.1016/j.clindermatol.2008.11.003. [DOI] [PubMed] [Google Scholar]
- Iglesias MS, Vaesken MLS, Moreiras GV. Composition and nutrient information of non-alcoholic beverages in the Spanish market: an update. Nutrients. 2016;8(10):1–12. doi: 10.3390/nu8100618. [DOI] [PMC free article] [PubMed] [Google Scholar]
- Jairajpuri DS, Qadri S. Fortification of orange juice with Withania somnifera and Solanum nigrum extract: a potential functional fruit beverage and its quality evaluation. Pak J Food Sci. 2015;25(2):58–65. [Google Scholar]
- Jogihalli P, Singh L, Sharanagat VS. Effect of microwave roasting parameters on functional and antioxidant properties of chickpea (Cicer arietinum) LWT Food Sci Technol. 2017;79:223–233. doi: 10.1016/j.lwt.2017.01.047. [DOI] [PubMed] [Google Scholar]
- Kahlon TS, Smith GE, Shao Q. In vitro binding of bile acids by kidney bean (Phaseolus vulgaris), black gram (Vigna mungo), Bengal gram (Cicer arietinum) and moth bean (Phaseolus aconitifolins) Food Chem. 2005;90(1–2):241–246. doi: 10.1016/j.foodchem.2004.03.046. [DOI] [Google Scholar]
- Meher J, Keshav A, Mazumdar B, Keshav S. Effect of blanching and thermal preservation on rheology of curry leaf puree. Food Meas. 2017;12(1):105–117. doi: 10.1007/s11694-017-9621-3. [DOI] [Google Scholar]
- Mridula D, Jain R, Singh KK. Effect of storage on quality of fortified Bengal gram sattu. J Food Sci Technol. 2010;47(1):119–123. doi: 10.1007/s13197-010-0006-4. [DOI] [PMC free article] [PubMed] [Google Scholar]
- Penna ALB, Sivieri K, Oliveira MN. Relation between quality and rheological properties of lactic beverages. J Food Eng. 2001;49(1):7–13. doi: 10.1016/S0260-8774(00)00179-5. [DOI] [Google Scholar]
- Pèrez-Cataluña A, Elizaquível P, Carrasco P, Espinosa J, Reyes D, Wacher C, Aznar R. Diversity and dynamics of lactic acid bacteria in Atole agrio, a traditional maize-based fermented beverage from South-Eastern Mexico, analysed by high throughput sequencing and culturing. Antonie Van Leeuwenhoek. 2018;111(3):385–399. doi: 10.1007/s10482-017-0960-1. [DOI] [PubMed] [Google Scholar]
- Reddy A, Norris DF, Momeni SS, Waldo B, Ruby JD. The pH of beverages in the United States. J Am Dent Assoc. 2016;147(4):255–263. doi: 10.1016/j.adaj.2015.10.019. [DOI] [PMC free article] [PubMed] [Google Scholar]
- Sanjeewa WGT, Wanasundra JPD, Pietresik Z, Shand PJ. Characterization of chickpea (Cicer arietinum L.) flours and application in low-fat pork bologna as a model system. Food Res Int. 2010;43:617–626. doi: 10.1016/j.foodres.2009.07.024. [DOI] [Google Scholar]
- Serpa-Guerra AM, Velásquez-Cock JA, Barajas-Gamboa JA, Vélez-Acosta LM, Gómez-Hoyos B, Zuluaga-Gallego R. Development of a fortified drink from the mixture of small Colombian native fruits. Dyna. 2018;85(204):185–193. doi: 10.15446/dyna.v85n204.67548. [DOI] [Google Scholar]
- Singh G, Muthukumarappan K. Influence of calcium fortification on sensory, physical and rheological characteristics of fruit yogurt. LWT Food Sci Technol. 2008;41(7):1145–1152. doi: 10.1016/j.lwt.2007.08.027. [DOI] [Google Scholar]
- Waters DM, Mauch A, Coffey A, Arendt EK, Zannini E. Lactic acid bacteria as a cell factory for the delivery of functional biomolecules and ingredients in cereal based beverages: a review. Crit Rev Food Sci Nutr. 2015;55(4):502–520. doi: 10.1080/10408398.2012.660251. [DOI] [PubMed] [Google Scholar]
- Wruss J, Waldenberger G, Huemer S, Uygun P, Lanzerstorfer P, Müller U, Höglinger O, Weghuber J. Compositional characteristics of commercial beetroot products and beetroot juice prepared from seven beetroot varieties grown in Upper Austria. J Food Compos Anal. 2015;42:46–55. doi: 10.1016/j.jfca.2015.03.005. [DOI] [Google Scholar]
- Yadav RB, Yadav BS, Kalia N. Development and storage studies on whey-based banana herbal (Mentha arvensis) beverage. Am J Food Technol. 2010;5(2):121–129. doi: 10.3923/ajft.2010.121.129. [DOI] [Google Scholar]