Abstract
This study examines the most commonly dispensed categories and individual substances of all prescribed controlled substances, including stimulants, benzodiazepines, and depressants, among US commercially insured adults.
Despite reductions in opioid prescribing in the US in recent years,1 rates of drug overdose deaths continue to increase.2 While most of these deaths involve opioids, significant increases in overdose deaths involving other prescription drugs, including stimulants, benzodiazepines, and depressants, have been reported.3 Yet, relatively little is known about the prescribing rates of nonopioid controlled substances in adults, particularly in recent years. We sought to examine trends in pharmacy dispensing of all prescribed controlled substances among US commercially insured adults over the past 15 years.
Methods
The data for this investigation came from Optum Clinformatics Data Mart database, which contains deidentified longitudinal claims data on beneficiaries of a large US employer-sponsored commercial health insurance provider and covers approximately 9 million individuals aged 19 to 64 years in any given month across all 50 states. Controlled substances and their categories were based on US Drug Enforcement Administration controlled substances schedules (II-V) and therapeutic classes, as defined by the US Drug Enforcement Administration in August 2019.4 The study was deemed exempt by the Brigham and Women’s Hospital Institutional Review Board.
Using outpatient pharmacy claims, we identified dispensing of controlled substances to individuals aged 19 to 64 years between January 1, 2004, and June 31, 2019. We excluded individuals 65 years and older because pharmacy claims for certain controlled substances in this age group were heavily influenced by coverage decisions by the Centers for Medicare & Medicaid Services and may not reflect actual dispensing rates. Monthly dispensing prevalence was estimated as the proportion of enrollees with at least 1 dispensing among all enrollees who were enrolled for at least 28 days that month. Overall, 16 categories of controlled substances were evaluated. We present trends for the 6 most commonly dispensed (as of January-June 2019) categories and the 6 most commonly dispensed individual substances. Analysis began January 2004.
Results
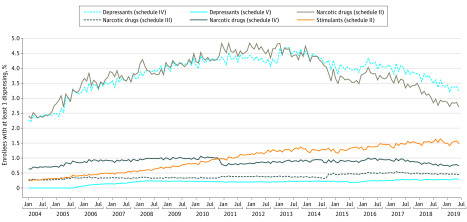
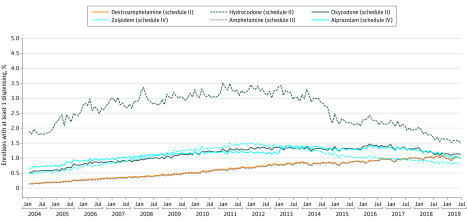
Schedule IV depressants (benzodiazepines and sleep medications zolpidem, zaleplon, and zopiclone) and schedule II narcotics were the most commonly dispensed categories of controlled substances throughout the study period (Figure 1). Dispensing of schedule II narcotics peaked in 2011 to 2012, when a mean (SD) of 4.61% (0.13%) of adults received a dispensing in a given month and has been decreasing since then, accompanied by a decrease in utilization of schedule IV depressants, albeit at lower rate. Schedule II stimulants, the third most commonly dispensed category since 2011, displayed a steady increase in dispensing from a mean (SD) monthly prevalence of 0.28% (0.02%) in 2004 to 1.51% (0.06%) in 2019 (Figure 1). Almost all the increase was driven by an increase in dispensing of amphetamines. During the first half of 2019, mean (SD) monthly dispensing of dextroamphetamine (1.00% [<0.001%]), primarily in combination with amphetamine, approached that of oxycodone (1.12% [<0.001%]) and alprazolam (1.03% [0.04%]), the 2 most commonly dispensed controlled substances after hydrocodone (1.56% [0.05%]) (Figure 2). Utilization of the other 3 categories remained relatively stable, except for a small decrease in utilization of schedule IV narcotics following propoxyphene withdrawal in late 2010 (Figure 1).
Figure 1. Dispensing Trends for Most Commonly Dispensed Categories of Controlled Substances in the US Commercially Insured Adults, January 2004 to June 2019.
Six most commonly dispensed categories (as of January 2019-June 2019) are presented. Depressants (schedule IV) contained benzodiazepines and sleep medications zaleplon, zolpidem, and zopiclone. Depressants (schedule V) contained brivaracetam, ezogabine, lacosamide, and pregabalin. Narcotic drugs (schedule III) contained codeine ≤90 mg per dosage, morphine ≤50 mg/100 mL or 100 g, both in a combination with another nonnarcotic ingredient, and buprenorphine. Stimulants (schedule II) contained amphetamine, methamphetamine, methylphenidate, lisdexamfetamine, and dextroamphetamine.
Figure 2. Dispensing Trends for Most Commonly Dispensed Controlled Substances in the US Commercially Insured Adults, January 2004 to June 2019.
Discussion
Consistent with previous reports,1 we observed a decreasing trend in dispensing of schedule II narcotics over recent years. In contrast, schedule II stimulants displayed a steady increase. While we were able to evaluate only rates of pharmacy dispensing of controlled substances, and not illicitly obtained use of these and related drugs, and our findings are based on the analysis of a single commercial insurance provider, the 5-fold rise in stimulant use that we observed over the last 15 years is concerning. Undoubtedly, some of this increase can be attributed to the increase in diagnosis of adult attention-deficit/hyperactivity disorder. Nevertheless, greater attention should be paid to stimulants as an emerging potential public health problem in light of increasing overdose deaths involving psychostimulants.3
References
- 1.Guy GP Jr, Zhang K, Bohm MK, et al. Vital signs: changes in opioid prescribing in the United States, 2006-2015. MMWR Morb Mortal Wkly Rep. 2017;66(26):697-704. doi: 10.15585/mmwr.mm6626a4 [DOI] [PMC free article] [PubMed] [Google Scholar]
- 2.Scholl L, Seth P, Kariisa M, Wilson N, Baldwin G. Drug and opioid-involved overdose deaths: United States, 2013-2017. MMWR Morb Mortal Wkly Rep. 2018;67(5152):1419-1427. doi: 10.15585/mmwr.mm675152e1 [DOI] [PMC free article] [PubMed] [Google Scholar]
- 3.Kariisa M, Scholl L, Wilson N, Seth P, Hoots B. Drug overdose deaths involving cocaine and psychostimulants with abuse potential: United States, 2003-2017. MMWR Morb Mortal Wkly Rep. 2019;68(17):388-395. doi: 10.15585/mmwr.mm6817a3 [DOI] [PMC free article] [PubMed] [Google Scholar]
- 4.US Department of Justice Drug Enforcement Administration. Controlled substance schedules Accessed August 31, 2019. https://www.deadiversion.usdoj.gov/schedules/


