

Abstract
Objective:
To detect cognitive “impairment,” neuropsychologists rely on normative data to compare patient performance to “normal” peers. However, the true normality of normative samples may be called into question given the high prevalence of preclinical proteinopathies amongst clinically normal older adults. Given its common use in memory clinics, we aimed to develop a robust California Verbal Learning Test (CVLT) normative standard reflecting only the most cognitively stable sample of older adults available.
Method:
Two hundred and twenty-eight older adults (mean age = 69.9, range = 60–89, 91% White, mean education = 17.6 years) who were clinically normal at baseline and demonstrated clinical stability on longitudinal assessment completed the CVLT at baseline. We applied a standardized algorithm to convert raw scores into normalized scaled scores and then regressed on age, sex, and education using fractional polynomial modeling.
Results:
There were significant main effects of age and sex across CVLT metrics, but not education. Means and standard deviations were higher and less variable in our robust normative data than the data used to create the CVLT-II and CVLT-3 normative standards.
Conclusions:
These norms set a higher standard for what should be considered “normal” in the spectrum of age-related memory changes and may help clinicians identify patients with memory and potential neurodegenerative changes in the earliest stages, further optimizing clinical management and clinical trial stratification. As with any standard, these robust norms are only appropriately utilized with patients that closely match the demographic profile of the individuals represented in the sample used for this study.
Keywords: Norms, older adults, demographics, cognitive aging, neuropsychology
Introduction
As the baby boomer cohort ages and life expectancy increases, the older adult population is predicted to double from 43 million in 2012 to 84 million by 2050 (Ortman, Velkoff, & Hogan, 2014). Aging is the strongest risk factor for developing cognitive and functional decline, with the incidence doubling every 5 years after age 65 (Jorm & Jolley, 1998). In fact, the current estimated cost of dementia care is $215 billion per year in the United States and is predicted to double by the year 2040 (Hurd et al., 2013). As the number of older adults across the world expands, there is a growing need for instruments that are sufficiently sensitive to detect the earliest and mildest cognitive changes in order to optimize care for our aging population.
Neuropsychologists are presented with the difficult task of differentiating early memory problems from “normal” cognitive aging. To detect such pathological changes or “impairment,” neuropsychologists rely on normative data to compare the performance of a given patient to the performance of his/her “normal” peers. Therefore, the neurologic and functional normality of the individuals represented in a normative standard is critical to derive sensitive and accurate estimates of expected performances on cognitive testing. However, the true normality of participants from whom these normative data are derived may be called into question given that over a third of seemingly clinically normal older adults have neuroimaging evidence of cerebrovascular disease and/or amyloid, raising concerns that they may have very subtle memory changes and are at increased risk of future cognitive decline (Negash et al., 2011). Including individuals like these who may be on a downward cognitive trajectory into a normative sample will introduce pathology-related variability and inherently decrease the normative standard’s sensitivity in detecting impairment.
The California Verbal Learning Test (CVLT) is among the most widely used assessments to evaluate memory in North America (Rabin, Barr, & Burton, 2005; Rabin, Paolillo, & Barr, 2016). In both the second and third editions of the CVLT (Delis, Kramer, Kaplan, & Ober, 2000, 2017), the individuals sampled to create the normative data were tested cross-sectionally, demographically matched to the most recent U.S. Censuses, and screened for self-reported neurological, psychiatric, or debilitating medical illnesses. However, there is no additional information cited in the manuals to indicate that more sensitive or objective screening tools were used to exclude individuals who may have begun to show early signs of cognitive impairment, especially in older adults who may be at greater risk of memory decline. Therefore, it is unclear that only individuals with “normal” cognition were included in the sample, particularly within their cohort of older adults.
“Robust norming” is an approach to address this problem that utilizes longitudinal data to only include individuals with the most stable, “normal” performances over time and exclude individuals who later go on to develop mild cognitive impairment (MCI) or dementia from the normative sample. In the studies that have established robust norms for other cognitive assessments using cognitively stable older adults, the new normative data commonly show higher average performances and reduced score variability compared to studies using a cross-sectional approach (De Santi et al., 2008; Fine et al., 2012); Holtzer et al., 2008; Pedraza et al., 2010; Ritchie, Frerichs, & Tuokko, 2007; Sliwinski, Lipton, Buschke, & Steward, 1996). Related to the current study, Fine et al. (2012) created robust norms for the 9-item short-form of the CVLT using an oldest old (≥85 years old) female sample and showed this same tendency of better performance and less variability compared to the Delis et al. (2000) norms within this age group. Robust normative data for the older adult age group across sexes using the 16-item CVLT are of particular interest given the even higher usage of the long form, its capacity for increased sensitivity due to more list items, learning trials, and an interference list, and the multiple process-approach data points that are attainable.
In the current study, we aimed to develop a normative standard for the CVLT in older males and females that reflected the most cognitively stable sample that we could capture. We leveraged a deeply phenotyped and longitudinally followed sample of older adults who demonstrated longitudinal stability in global cognition, on neurological exam, and on independence in daily functioning per informant report at every study visit. We hypothesized that our sample would yield higher average scores and less variability on the CVLT than is represented in the widely available normative data (De Santi et al., 2008; Delis et al., 2000, 2017; Fine et al., 2012; Holtzer et al., 2008; Pedraza et al., 2010; Ritchie, Frerichs, & Tuokko, 2007; Sliwinski, Lipton, Buschke, & Steward, 1996).
Methods
Participants
Eight hundred and thirty-one community-dwelling older adults enrolled in the University of California, San Francisco (UCSF) Memory and Aging Center Hillblom Study, a larger study of typical brain aging. This larger observational study longitudinally follows a cohort of adults to collect neurobiological and behavioral data with the aim of characterizing phenotypes of typical cognitive aging and represents a convenience sample of older adults in the Bay Area. Participants initially underwent a screening visit, informant interview, neurological examination, and neuropsychological testing, and then returned for repeated cognitive testing, neurological exam, and informant interview at subsequent annual follow up visits. The study was approved by the UCSF IRB on human research and all participants provided written, informed consent before enrolling. The current study followed the guidelines of the Helsinki declaration.
From the 831 participants, 204 who were under age 60 were excluded. An additional 237 participants were excluded for not having at least 2 visits. One hundred and fourteen participants were excluded because they were not considered to be clinically normal at any one or more time points. Clinical normality was operationally defined by a Clinical Dementia Rating (CDR, via informant interview; Morris, 1993, i.e., “Can the patient independently shop for needs?”) score of 0 at every visit to confirm independent functioning and by consensus based on clinical examination by neurologists and neuropsychologists. Performance on the CVLT-II was not used in determining clinical normality. Mini Mental Status Exam (MMSE) score of 26 or higher at every visit (Folstein et al., 1975) was also required. Furthermore, to ensure cognitive stability, we required that no participants declined more than 1 point (statistically reliable change based on the psychometric properties of the MMSE) between his/her first and last visit; an additional 48 were excluded who did not meet these latter change criterion (Figure 1). The final sample includes 228 individuals (Age: 60–69: 121, 53.1%; 70–79: 91, 40.0%; 80–89: 16, 7.0%. Education: 12–15 years: 25, 11.0%, 16 years: 53, 23.2%; 17–20: 150, 65.8%).
Figure 1.
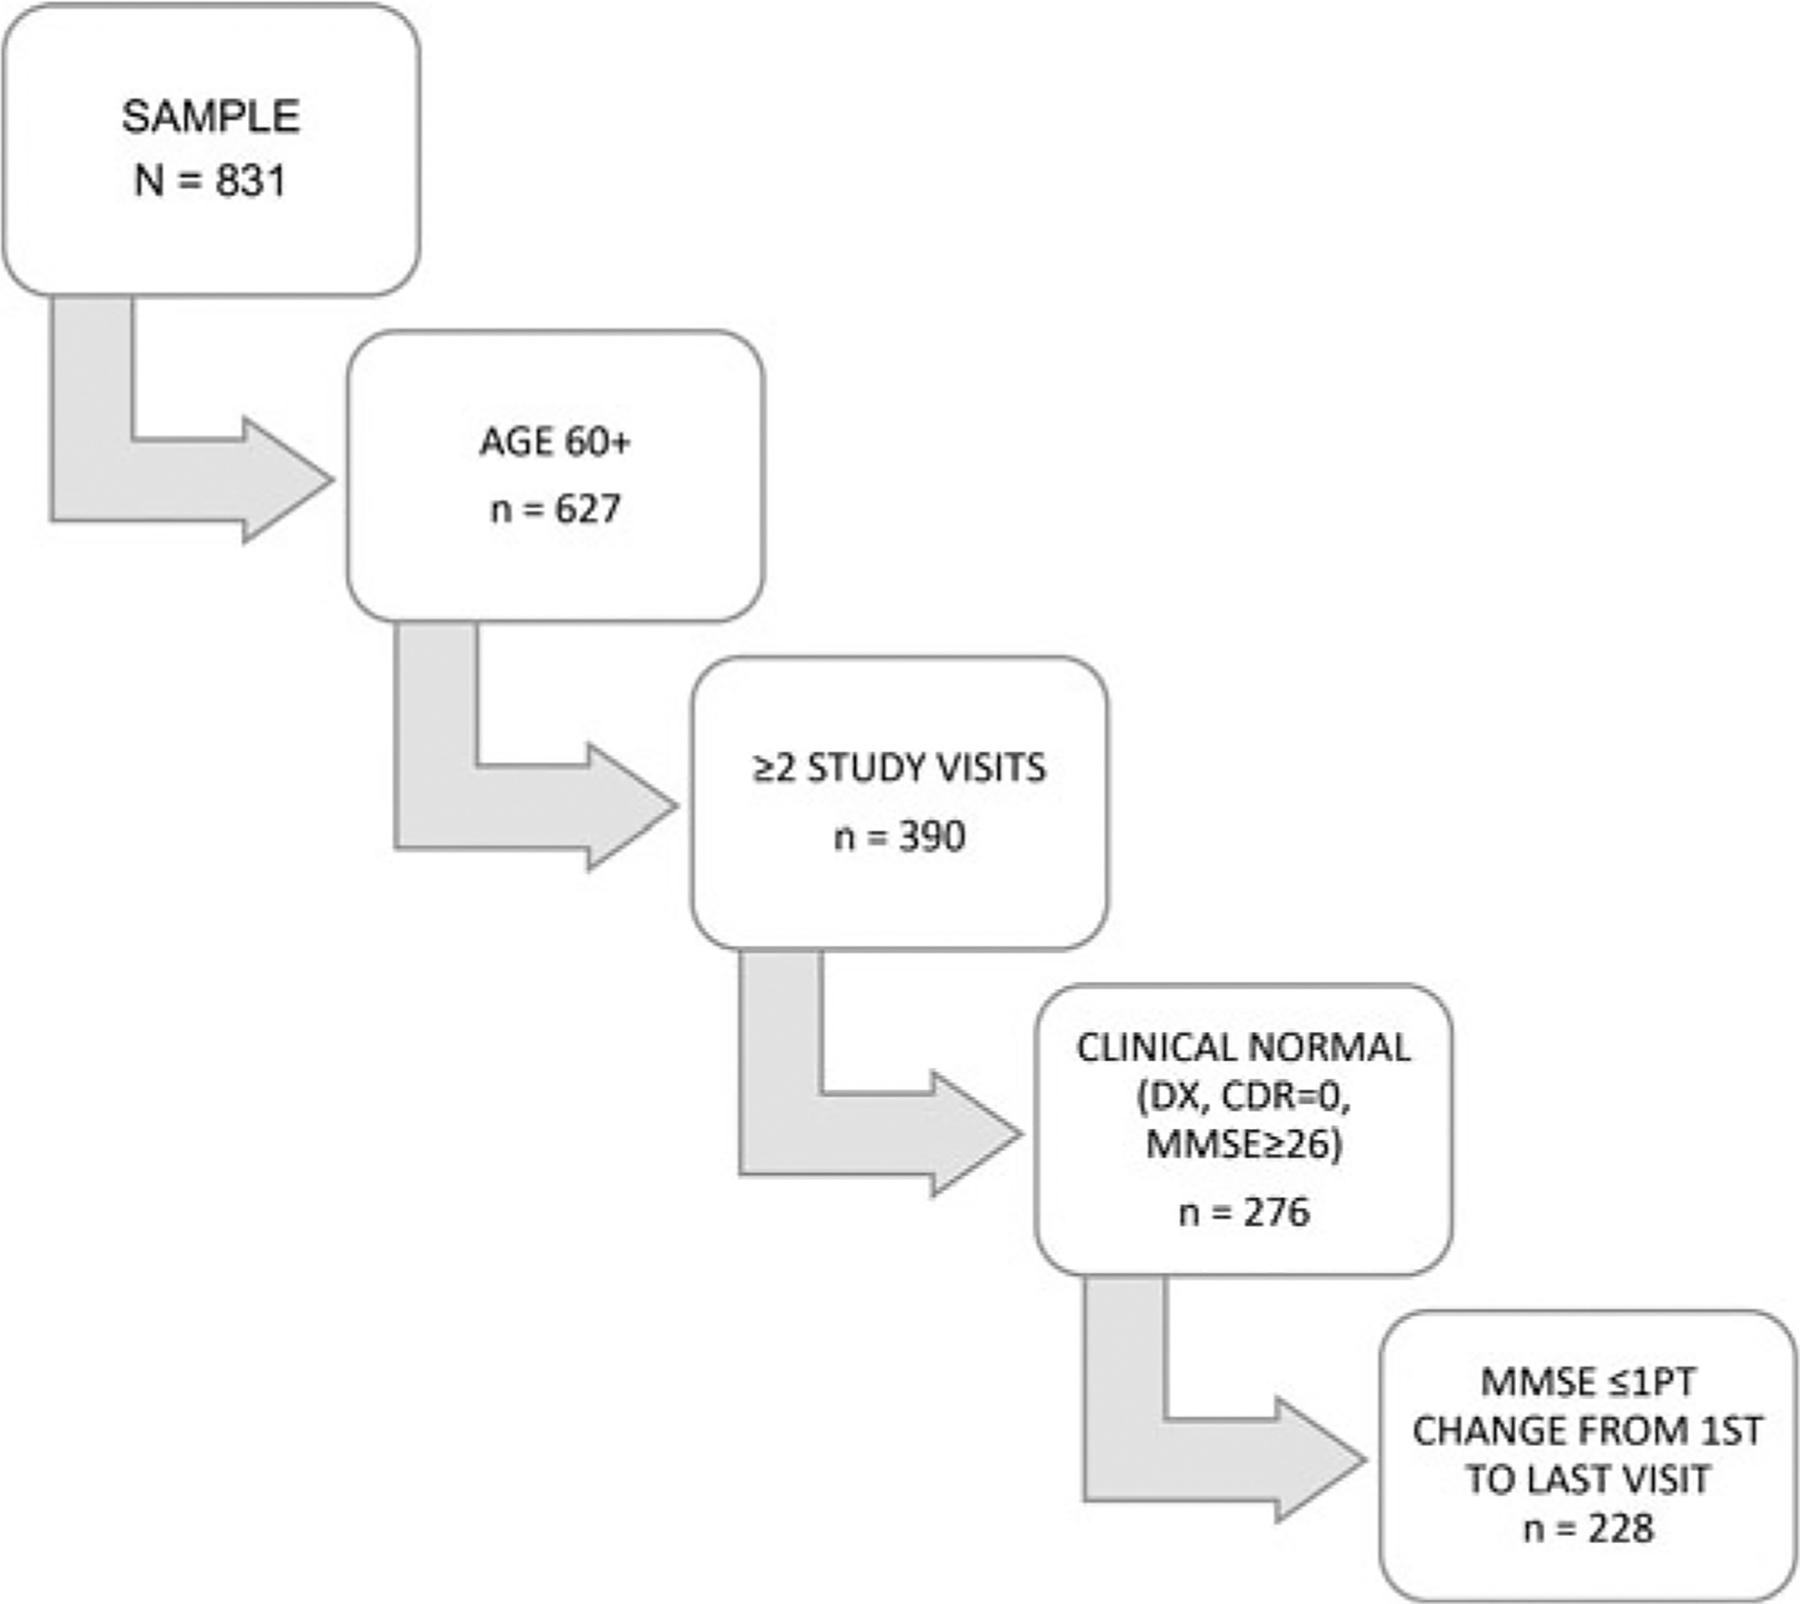
Exclusion criteria to create final sample of participants.
California verbal learning test-second edition (CVLT-II)
All participants completed the California Verbal Learning Test-second edition (CVLT-II; Delis et al., 2000) at every study visit, per standardized procedures. During the CVLT-II, participants were asked to recall words on a 16-item list after each of the five learning trials. After a distractor list, participants were again asked to recall words spontaneously (short delay free recall; SDFR) and with category cueing. Spontaneous recall (long delay free recall; LDFR) and category cueing were repeated after a 20-minute delay. Following the longer delay, participants also completed a yes/no recognition trial during which they needed to discriminate between the target words and 32 distractor words. Scores of interest for norming included number of words recalled on each of the 5 learning trials (range 0–16), total words recalled across all 5 learning trials (range 0–80), SDFR (range 0–16), LDFR (range 0–16), total words accurately identified on the recognition trial (Total Hits; range 0–16), total words inaccurately identified on the recognition trial (False Positives; range 0–32), ability to discriminate words on the list from distractor words on the recognition trial (discriminability index, analogous to the simple difference in standard deviation units between hit rate and false-positive rate; range 4 to 4), and tendency to favor “yes” or “no” responses on the recognition trial (recognition bias; range 1 to 1).
Statistical analyses
In the final normative sample, the impact of age, education, and sex on baseline CVLT performances was assessed separately via regression analyses to examine main effects of demographic variables on raw scores. Given the racial homogeneity of our sample (91% White), the impact of racial identity was not examined.
We converted the raw test scores from each participant’s baseline assessment into normalized scaled scores by obtaining their standardized quantiles and scaling them to have a mean = 10 and standard deviation = 3. Next, employing R package mfp (Ambler & Benner, 2008), the normalized scaled scores were regressed on age, sex, and education using multivariable fractional polynomials allowing for fit of nonlinear terms for variability in the outcome that was not well explained by a simple linear pattern (Royston & Altman, 1994). The residuals from these models were obtained (i.e., difference between the observed scaled score and expected scaled score for that individual’s demographics) and adjusted to achieve homogeneity of variance across all demographic characteristics using smoothing methods described previously (Casaletto et al., 2015, 2016-NIH toolbox). Since residuals may be inconsistent across different demographic groups (i.e., more variability in the observed scores in an older age group for example), this smoothing technique corrected for these residual differences so that on average, the residuals now had approximately equal variance across all demographic strata. Standardized corrected residuals were then used to form fully demographically adjusted T-scores (M = 50, SD = 10). These T-scores represent the expected performance of an individual as compared to others with the same age, sex, and education level in order to best estimate the individual’s expected cognitive performance given their demographics. To confirm the intended absence of demographic effects in these T-scores, we conducted t-test or correlations, as appropriate.
Normative look up tables were created and categorized by age (60–69, 70–79, and 80–89), years of education (12–15: high school and/or some college, 16: college degree, 17–20: graduate degree), and sex (male and female), calculated using the midpoint per bracket. It should be emphasized that these tables were created from the final regression formulas using the midpoint age and education for each sex to provide easy access and promote clinical application of the reported normative standards.
Lastly, we examined differences of mean raw scores between our “robust” normative sample and the samples used to create the CVLT-II and the CVLT-3 normative data in the age groups of interest using t-tests and Cohen’s d effect sizes (see Table 3; Delis et al., 2000, 2017). For this comparison, we made demographics as similar as possible across normative samples by only including individuals aged 60 and older with at least 16 years of education in each dataset.
Table 3.
Effect size differences of means and standard deviations of raw scores on the Total Learning, Short Delay Free Recall (SDFR), Long Delay Free Recall (LDFR), and Recognition Discriminability (D-Prime) between our new robust norms and the CVLT-II and CVLT-3 norms within comparable age and education (≥16 years) brackets.
| Robust norms (n = 203) | CVLT-II (n = 52) | Effect size | CVLT-3 (n = 82) | Effect size | |
|---|---|---|---|---|---|
| Age | M = 69.7 | M = 73.0 | - | 60–69 = 38% | - |
| SD = 5.8 | SD = 7.9 | 70–79 = 34% | |||
| Range = 60–89 | Range = 61–89 | 80–90 = 28% | |||
| Racial background | 91% White | 94.7% White | - | 84% White | - |
| Total learning | M = 52.8 | M = 43.8 | −1.3* | M = 43.8 | −0.9* |
| SD = 9.3 | SD = 11.3 | SD = 11.9 | |||
| SDFR | M = 11.6 | M = 9.0 | −0.9* | M = 9.0 | −0.8* |
| SD = 2.9 | SD = 3.1 | SD = 3.7 | |||
| LDFR | M = 12.2 | M = 9.6 | −0.9* | M = 9.9 | −0.7* |
| SD = 2.8 | SD = 3.5 | SD = 3.8 | |||
| D-Prime | M = 3.3 | M = 2.9 | −0.6* | M = 2.8 | −0.7* |
| SD = 0.7 | SD = 0.8 | SD = 0.9 |
M = mean,
SD = standard deviation,
p < .05.
Results
The final sample consisted of 228 participants, 56% of which were female, average age 69.9 years (SD = 5.8), ranging from 60 to 89. On average, education level was 17.6 years (SD = 2.0), and the large majority of participants identified as White (91%). Average number of visits was 4.8 (SD = 2.6) with an average of 5.7 years elapsing from the first to the last visit (SD = 2.9). Complete demographic information of the final sample is reported in Table 1.
Table 1.
Demographic and clinical characteristics of the final normative sample (n = 228).
| M (SD) | Range | |
|---|---|---|
| Age (Years) | 69.9 (5.8) | 60–89 |
| Education (Years) | 17.6 (2.0) | 12–20 |
| Sex | 56% female | |
| Race | White: 207 (90.8%) | |
| Asian: 8 (3.5%) | ||
| Other: 3 (1.3%) | ||
| Missing: 10 (4.4%) | ||
| Number of study visits | 4.8 (2.6) | 2–14 |
| Time elapsed between 1st and last study visit (Years) | 5.7 (2.9) | 0.9– 14.8 |
M = mean, SD = standard deviation.
To examine the effects of demographics on memory scores, we examined the raw baseline test scores before application of the norming procedures. Regression analyses for the CVLT yielded significant effects of age and sex on Total Learning, SDFR, LDFR, and Recognition d-prime (Partial R2 = 0.02–0.11); however, education had a much smaller effect (Partial R2 = 0.01–0.02; see Table 2 for full model R2 and partial R2).
Table 2.
Full model R2 and partial R2 illustrating the effects of age, gender, and education on the CVLT-II performances (raw unadjusted scores).
| n = 228 | Adj. R2 | Partial R2 |
|---|---|---|
| CVLT-II Total Learning | 0.20*** | |
| Age | 0.11*** | |
| Gender | 0.10*** | |
| Education | 0.02* | |
| CVLT-II Short delay recall | 0.09*** | |
| Age | 0.06*** | |
| Gender | 0.04** | |
| Education | 0.02* | |
| CVLT-II Long delay recall | 0.09*** | |
| Age | 0.04** | |
| Gender | 0.04** | |
| Education | 0.02 | |
| CVLT-II Recognition D-Prime | 0.06*** | |
| Age | 0.04** | |
| Gender | 0.02* | |
| Education | 0.01 |
p ≤ .05,
p ≤ .01,
p ≤ .001.
After conducting the norming models described above, fully demographically corrected T-scores were no longer significantly associated with demographic factors (age Partial R2 = 0.001–0.008, p > .90; sex Partial R2 = 0.0009–0.005, p > .90; education Partial R2 = 0.0001–0.0007, p > .90) and demonstrated a mean of T = 50 and SD = 10 for all measures, as expected. The distribution was consistent with the normal curve such that 16.7–18.4% of the sample fell below a T-score of 40 (1 SD below the mean) on Total Learning, SDFR, LDFR, Total Recognition Hits, and d-prime, also as expected.
Selecting participants in comparable age (60–89 years old) and education (≥16 years) brackets, we found overall higher and less variable Total Learning, SDFR, LDFR, and d-prime raw scores in our robust sample compared to the CVLT-II or CVLT-3 normative samples: effect sizes ranged from Cohen’s d = 0.6–1.3 (ps < .05; see Table 3).
To utilize these robust norms, users should first apply Appendix A to convert raw CVLT scores to normalized (unadjusted) scaled scores (ss). Next, the normalized scaled scores and demographic information are entered into the regression equations provided in Appendix C. Alternatively, for ease of use and convenience, the scaled scores can be converted into demographically adjusted T-scores via look-up tables available in Appendix B, which are categorized by sex, age, and education of the individual. The final T-scores are best interpreted as the individual’s memory performance compared to the expected performance based on their demographic characteristics, with M = 50 and SD = 10.
Discussion
In the current study, we aimed to create new “robust” normative data with a heightened threshold of “normality” in memory performance on the CVLT for ages 60–89. Unlike the cross-sectional approach in the widely available normative data for the CVLT, our study applied a longitudinal method to exclusively include individuals that demonstrated cognitive and functional stability across multiple time points in an attempt to reduce the likelihood that early-stage memory impairment was present in any individual within our sample. As expected and consistent with other robust norms studies (De Santi et al., 2008; Fine et al., 2012; Holtzer et al., 2008; Pedraza et al., 2010; Ritchie, Frerichs, & Tuokko, 2007; Sliwinski, Lipton, Buschke, & Steward, 1996), we found that our sample yielded higher average performances with lower variability in scores than in the samples used to create the CVLT-II and CVLT-3 norms, though homogenous demographic characteristics within our sample should be noted. Furthermore, we examined standard error and confidence intervals for all predictive values. Although the confidence interval was wider for the older age bracket and for the lower education group, all confidence intervals were within one standard deviation. As with any standard, these robust norms are only appropriately utilized with patients that closely match the demographic profile of the majority of individuals in the sample used for this study.
Using this “robust norms” technique increases the standard of what is considered “normal” performances in older adults. This suggests that among adults who demonstrate neurologic stability, memory changes with age may be a subtler phenomenon than previously thought. For instance, an 88-year-old male with 17 years of education who recalled 7 words on long delay free recall would be considered “within expectation” based on the CVLT-II standard (z = 0) and “below expectation” based on our standard (T = 38). Indeed, recent work suggests that once individuals who go on to develop MCI are removed from analyses, age may not demonstrate a significant relationship with memory (Harrington et al., 2018). Of course, however, by increasing the threshold of normality, these normative standards will, by definition, identify more people with memory impairment. It is therefore imperative that careful consideration of the aim of the clinical assessment or research study be given when selecting this (or any other) normative standard; for example, if assessing an individual who is in the earliest stages of memory changes or has high levels of premorbid functioning, our robust norms may be better suited to detect even subtle deviations from expectations. On the other hand, these norms would not be an appropriate standard, and may overestimate impairment, in someone with few years of education or low acculturation. Nonetheless, assessment tools sensitive to the earliest memory changes are critically needed for the growing aging population to support appropriate brain health monitoring and diagnosis and enable individuals to potentially benefit from emerging treatments.
Considering the effects of our norms more closely, we found that age and sex had significant main effects on memory performance as expected, whereas education did not have a main effect. This is consistent with the well-established effects of age and sex on memory; namely memory declines as a function of age and females consistently outperform males across the age range (Kramer et al., 2003; Lundervold et al., 2014; Ragland, et al., 2000; Trahan & Quintana, 1990). However, we found no significant main effect of education level, most likely due to restricted variability in our sample. Nevertheless, education level has been found to be correlated with memory performances across a variety of neuropsychological batteries including the Halstead-Reitan battery (Karzmark et al., 1984) and on the CVLT-II (Lamar et al., 2003), and was adjusted for on the CVLT-3 norms (Delis et al., 2017), all of which added to our decision to include education as a regressor in our normative dataset. Still, the relationship between education and cognitive performance has been found to vary between assessments, domains, and subsamples and may not be consistently correlated amongst tests that appear to measure the same cognitive skills (Tombaugh, Kozak, & Rees, 1999). Though a convenient proxy and easily measured, important varying factors such as socioeconomic status and quality of school system are not consistently captured by years of education and may contribute to its lack of specificity (and inconsistent findings) as a construct (Manly et al., 2002).
There are several strengths of our study that should be emphasized. Unlike other robust norms studies, our study utilized a regression-based approach (fractional polynomic models), which allows for better fit of the data (e.g., adjusts for simultaneous effects between demographics, allows for nonlinear effects, continuous modeling of demographics increases power, ensures normal distribution of final scores), compared to stratification approaches (i.e., simply reporting means and SDs within demographic strata). Our study also excluded an additional 16% of participants that evidenced meaningful cognitive decline longitudinally per MMSE scores who would have otherwise been included based on “normality,” further increasing the sensitivity of our norms. Furthermore, we provide demographically adjusted look up tables (Appendix B) so that our norms are convenient and highly accessible for clinicians. These tables aim to enhance the usability of the robust normative data and were calculated through application of the final normative equations using demographic midpoints (not by a stratification approach). However, for the most accurate estimation of performance based on the unique demographics of an individual, direct application of the regression equations is recommended.
Though our approach has several strengths, our study is also not without limitations. These data are largely composed of highly educated, White individuals from the Bay Area and may not necessarily be representative of the more diverse aging population across the U.S., or other countries. There is a need to develop more robust normative data for individuals from a diverse range of racial identifications and educational attainment. However, it is notable that our norms are not particularly discrepant from the CVLT robust normative data provided by Harrington et al. (2017) with a sample that had a mean education level of 12.5years. For example, average performance on Total Learning is 52.25 (SD = 9.26) and average performance on LDFR is 12.05 (SD = 2.78). Given this apparent comparability, it is possible that education simply becomes a less relevant factor when studying older adults who remain cognitively stable for prolonged periods of time (“robust” aging). Nevertheless, these robust norms are highly appropriate for use with patients who are well-represented by our study sample.
Similarly, there may be a potential risk of misestimating performance of individuals within the 80- to 89-year-old age range based on our relatively smaller sample size for this age group. However, fractional polynomial modeling allows for continuous modeling across the age range, integrating all available data for a more powerful fit, and does not solely rely on data from individuals with the exact age. Additionally, though there are benefits to increased sensitivity identifying impaired memory scores, such as possible early detection of memory change, there may be a downside as well. Increasing the threshold of normality may pose a higher risk for false positives in which clinicians could overestimate impairment in older adults and create needless distress or even inappropriate treatment for patients. Therefore, we encourage clinicians who utilize our norms to interpret results within the context of the individual and consider how closely his/her demographical background match those of our sample.
In conclusion, our data argue that memory performance may be higher and more stable in the aging population than previously assumed. With more accurate means of detecting impaired memory functioning at the earliest onset, our data provide clinicians and researchers with a more sensitive tool to identify at-risk older adults who would benefit most from advancing clinical trials and behavioral interventions.
Acknowledgments
This study was supported by NIH-NIA grants K23AG058752 (PI: Casaletto), L30AG057123 (PI: Casaletto),1R01AG032289 (PI: Joel Kramer), and R01AG048234 (PI: Joel Kramer). Our work was also supported by Larry L. Hillblom Network Grant (PI: Joel Kramer; 2014-A-004-NET) and Fellowship Grant (PI: Casaletto; 2017-A-004-FEL). We also thank Abraham Sprague for his help in creating the normative tables.
Appendix A. Raw score to scaled score (ss) conversion table
| ss | T1 | T2 | T3 | T4 | T5 | T1–T5 Total | SDFR | LDFR | Total Hits | False Positives | ss |
|---|---|---|---|---|---|---|---|---|---|---|---|
| 19 | 15–16 | - | - | - | - | 78–80 | - | - | - | - | 19 |
| 18 | 12–14 | 16 | - | - | - | 72–77 | - | - | - | - | 18 |
| 17 | - | 15 | - | - | - | 71 | - | - | - | - | 17 |
| 16 | 11 | 14 | 16 | - | - | 69–70 | 16 | - | - | - | 16 |
| 15 | 10 | - | 15 | 16 | 16 | 66–68 | - | 16 | - | - | 15 |
| 14 | 9 | 13 | - | 15 | - | 63–65 | 15 | - | - | - | 14 |
| 13 | 8 | 12 | 14 | - | 15 | 61–62 | - | 15 | 16 | 0 | 13 |
| 12 | 7 | 11 | 13 | 14 | - | 58–60 | 14 | 14 | - | - | 12 |
| 11 | - | 10 | 12 | 13 | 14 | 54–57 | 13 | 13 | - | - | 11 |
| 10 | 6 | - | - | 12 | 13 | 52–53 | 12 | 12 | 15 | 1 | 10 |
| 9 | - | 9 | 11 | - | - | 49–51 | 11 | 11 | - | - | 9 |
| 8 | 5 | 8 | 10 | 11 | 12 | 45–48 | 10 | 10 | 14 | 2 | 8 |
| 7 | - | 7 | 9 | 10 | 11 | 41–44 | 9 | 9 | - | 3 | 7 |
| 6 | 4 | - | 8 | 9 | 10 | 37–40 | 8 | 8 | 13 | 4 | 6 |
| 5 | - | 6 | 7 | - | 9 | 35–36 | 7 | 7 | 12 | 5–6 | 5 |
| 4 | 3 | 5 | 6 | 7–8 | 8 | 33–34 | 6 | 6 | 11 | 7–9 | 4 |
| 3 | - | - | 5 | 6 | 7 | 28–32 | 4–5 | 5 | 10 | 10–12 | 3 |
| 2 | 2 | 2–4 | 2–4 | 2–5 | 4–6 | 8–27 | 2–3 | 2–4 | - | 13–16 | 2 |
| 1 | 0–1 | 0–1 | 0–1 | 0–1 | 0–3 | 0–7 | 0–1 | 0–1 | 3–9 | 17–29 | 1 |
| 0 | - | - | - | - | - | - | - | - | 0–2 | 30–36 | 0 |
| ss | D-Prime | Bias | ss |
|---|---|---|---|
| 19 | 4.8458–5 | 0.9335–1 | 19 |
| 18 | 4.6646–4.8457 | 0.7988–0.9334 | 18 |
| 17 | 4.4834–4.6645 | 0.7402–0.7987 | 17 |
| 16 | 4.3021 −4.4833 | 0.666–0.7401 | 16 |
| 15 | 4.1209–4.302 | 0.5121 −0.6659 | 15 |
| 14 | 3.953–4.1208 | 0.4444–0.512 | 14 |
| 13 | 3.8031 −3.9529 | 0.3171 −0.4443 | 13 |
| 12 | 3.7057–3.803 | 0.2139–0.317 | 12 |
| 11 | 3.5033–3.7056 | 0.1553–0.2138 | 11 |
| 10 | 3.2611 −3.5032 | 0.14–0.1552 | 10 |
| 9 | 2.9305–3.261 | 0.044–0.1399 | 9 |
| 8 | 2.7227–2.9304 | −0.0406 to −0.0439 | 8 |
| 7 | 2.4357–2.7226 | −0.1588 to −0.0407 | 7 |
| 6 | 1.9962–2.4356 | −0.2677 to −0.1589 | 6 |
| 5 | 1.6025–1.9961 | −0.4264 to −0.2678 | 5 |
| 4 | 1.4274–1.6024 | −0.4987 to −0.4265 | 4 |
| 3 | 1.306–1.4273 | −0.766 to −0.4988 | 3 |
| 2 | 1.0732–1.3059 | −0.9547 to −0.7661 | 2 |
| 1 | −5 to 1.0731 | −1 to −0.9548 | 1 |
| 0 | - | - | 0 |
ss = scaled score; T1 = Trial 1; T1–T5 Total = Trial 1–5 Total; SDFR = short delay free recall; LDFR = long delay free recall.
Appendix B. Scaled score to demographically-corrected T-score conversion tables.
Sex: Male
Education: 12–15 years
Age: 60–69 years
| Scaled score | T1 | T2 | T3 | T4 | T5 | T1–T5 Total | SDFR | LDFR | Total hits | False positives | d-prime | Bias |
|---|---|---|---|---|---|---|---|---|---|---|---|---|
| 19 | 82 | - | - | - | - | 96 | - | - | - | - | 82 | 83 |
| 18 | 79 | 89 | - | - | - | 91 | - | - | - | - | 78 | 79 |
| 17 | - | 85 | - | - | - | 87 | - | - | - | - | 75 | 76 |
| 16 | 72 | 80 | 79 | - | - | 82 | 85 | - | - | - | 72 | 73 |
| 15 | 69 | - | 75 | 78 | 72 | 78 | - | 71 | - | - | 68 | 70 |
| 14 | 66 | 72 | - | 73 | - | 73 | 75 | - | - | - | 65 | 66 |
| 13 | 62 | 68 | 67 | - | 64 | 68 | - | 64 | 59 | 64 | 62 | 63 |
| 12 | 59 | 63 | 63 | 63 | - | 64 | 65 | 60 | - | - | 58 | 60 |
| 11 | - | 59 | 59 | 58 | 56 | 59 | 61 | 56 | - | - | 55 | 56 |
| 10 | 53 | - | - | 54 | 52 | 55 | 56 | 53 | 49 | 54 | 52 | 53 |
| 9 | - | 50 | 51 | - | - | 50 | 51 | 49 | - | - | 48 | 50 |
| 8 | 46 | 46 | 47 | 44 | 44 | 46 | 46 | 45 | 43 | 48 | 45 | 47 |
| 7 | - | 48 | 43 | 39 | 40 | 41 | 41 | 41 | - | 44 | 42 | 43 |
| 6 | 40 | - | 39 | 35 | 36 | 36 | 37 | 38 | 36 | 41 | 38 | 40 |
| 5 | - | 33 | 35 | - | 32 | 32 | 32 | 34 | 33 | 38 | 35 | 37 |
| 4 | 34 | 29 | 31 | 25 | 28 | 27 | 27 | 30 | 30 | 34 | 32 | 33 |
| 3 | - | - | 27 | 20 | 24 | 23 | 22 | 26 | 27 | 31 | 29 | 30 |
| 2 | 27 | 21 | 23 | 16 | 20 | 18 | 17 | 23 | - | 28 | 25 | 27 |
| 1 | 24 | 16 | 19 | 11 | 16 | 14 | 12 | 19 | 20 | 25 | 22 | 24 |
| 0 | - | - | - | - | - | - | - | - | 17 | 21 | - | - |
T1= Trial 1; T1–T5 Total = Trials 1–5 Total; SDFR = short delay free recall, LDFR = long delay free recall.
Sex: Male
Education: 12–15 years
Age: 70–79 years
| Scaled score | T1 | T2 | T3 | T4 | T5 | T1–T5 Total | SDFR | LDFR | Total hits | False positives | d-prime | Bias |
|---|---|---|---|---|---|---|---|---|---|---|---|---|
| 19 | 85 | - | - | - | - | 98 | - | - | - | - | 85 | 78 |
| 18 | 82 | 90 | - | - | - | 94 | - | - | - | - | 81 | 75 |
| 17 | - | 86 | - | - | - | 90 | - | - | - | - | 78 | 73 |
| 16 | 76 | 82 | 83 | - | - | 85 | 92 | - | - | - | 75 | 70 |
| 15 | 72 | - | 79 | 79 | 76 | 81 | - | 76 | - | - | 71 | 67 |
| 14 | 69 | 74 | - | 75 | - | 77 | 82 | - | - | - | 68 | 64 |
| 13 | 66 | 70 | 71 | - | 69 | 73 | - | 69 | 61 | 66 | 65 | 61 |
| 12 | 63 | 67 | 68 | 67 | - | 69 | 72 | 65 | - | - | 62 | 58 |
| 11 | - | 63 | 64 | 63 | 61 | 65 | 67 | 61 | - | - | 58 | 56 |
| 10 | 56 | - | - | 58 | 57 | 61 | 62 | 57 | 52 | 56 | 55 | 53 |
| 9 | - | 55 | 56 | - | - | 57 | 57 | 53 | - | - | 52 | 50 |
| 8 | 50 | 51 | 52 | 50 | 50 | 53 | 53 | 49 | 46 | 50 | 48 | 47 |
| 7 | - | 47 | 48 | 46 | 46 | 49 | 48 | 45 | - | 47 | 45 | 44 |
| 6 | 43 | - | 44 | 41 | 43 | 44 | 43 | 41 | 40 | 44 | 42 | 42 |
| 5 | - | 40 | 41 | - | 39 | 40 | 38 | 37 | 37 | 41 | 39 | 39 |
| 4 | 37 | 36 | 37 | 33 | 35 | 36 | 33 | 34 | 34 | 38 | 35 | 36 |
| 3 | - | - | 33 | 29 | 32 | 32 | 28 | 30 | 31 | 34 | 32 | 33 |
| 2 | 30 | 28 | 29 | 25 | 28 | 28 | 23 | 26 | - | 31 | 29 | 30 |
| 1 | 27 | 24 | 25 | 20 | 24 | 24 | 18 | 22 | 25 | 28 | 25 | 27 |
| 0 | - | - | - | - | - | - | - | - | 22 | 25 | - | - |
Sex: Male
Education: 12–15 years
Age: 80–89 years
| Scaled score | T1 | T2 | T3 | T4 | T5 | T1-T5 Total | SDFR | LDFR | Total hits | False positives | d-prime | Bias |
|---|---|---|---|---|---|---|---|---|---|---|---|---|
| 19 | 89 | - | - | - | - | 99 | - | - | - | - | 88 | 75 |
| 18 | 86 | 90 | - | - | - | 96 | - | - | - | - | 84 | 72 |
| 17 | - | 87 | - | - | - | 92 | - | - | - | - | 81 | 70 |
| 16 | 79 | 83 | 87 | - | - | 88 | 99 | - | - | - | 78 | 67 |
| 15 | 76 | - | 83 | 81 | 79 | 84 | - | 82 | - | - | 75 | 65 |
| 14 | 73 | 76 | - | 77 | - | 81 | 89 | - | - | - | 71 | 62 |
| 13 | 69 | 73 | 76 | - | 72 | 77 | - | 74 | 62 | 68 | 68 | 60 |
| 12 | 66 | 69 | 72 | 69 | - | 73 | 79 | 69 | - | - | 65 | 57 |
| 11 | - | 66 | 68 | 66 | 65 | 70 | 74 | 65 | - | - | 61 | 55 |
| 10 | 59 | - | - | 62 | 62 | 66 | 69 | 61 | 54 | 58 | 58 | 53 |
| 9 | - | 59 | 61 | - | - | 62 | 64 | 57 | - | - | 55 | 50 |
| 8 | 53 | 55 | 57 | 54 | 55 | 58 | 59 | 53 | 49 | 52 | 52 | 48 |
| 7 | - | 52 | 53 | 51 | 52 | 55 | 54 | 49 | - | 49 | 48 | 45 |
| 6 | 46 | - | 50 | 47 | 48 | 51 | 49 | 45 | 43 | 46 | 45 | 43 |
| 5 | - | 45 | 46 | - | 45 | 47 | 44 | 41 | 40 | 43 | 42 | 40 |
| 4 | 40 | 41 | 42 | 39 | 41 | 44 | 39 | 37 | 38 | 40 | 39 | 38 |
| 3 | - | - | 38 | 36 | 38 | 40 | 34 | 33 | 35 | 37 | 35 | 35 |
| 2 | 33 | 35 | 35 | 32 | 35 | 36 | 29 | 29 | - | 34 | 32 | 33 |
| 1 | 30 | 31 | 31 | 28 | 31 | 32 | 24 | 25 | 30 | 31 | 29 | 30 |
| 0 | - | - | - | - | - | - | - | - | 27 | 28 | - | - |
Sex: Male
Education: 16 years
Age: 60–69 years
| Scaled score | T1 | T2 | T3 | T4 | T5 | T1–T5 Total | SDFR | LDFR | Total hits | False positives | d-prime | Bias |
|---|---|---|---|---|---|---|---|---|---|---|---|---|
| 19 | 80 | - | - | - | - | 89 | - | - | - | - | 81 | 84 |
| 18 | 77 | 83 | - | - | - | 85 | - | - | - | - | 77 | 80 |
| 17 | - | 79 | - | - | - | 81 | - | - | - | - | 74 | 77 |
| 16 | 71 | 76 | 75 | - | - | 77 | 77 | - | - | - | 71 | 73 |
| 15 | 68 | - | 72 | 73 | 69 | 73 | - | 69 | - | - | 67 | 70 |
| 14 | 64 | 68 | - | 69 | - | 69 | 69 | - | - | - | 64 | 66 |
| 13 | 61 | 64 | 64 | - | 61 | 64 | - | 62 | 59 | 62 | 61 | 62 |
| 12 | 58 | 60 | 60 | 61 | - | 60 | 61 | 58 | - | - | 57 | 59 |
| 11 | - | 56 | 56 | 56 | 54 | 56 | 57 | 55 | - | - | 54 | 55 |
| 10 | 51 | - | - | 52 | 51 | 52 | 53 | 51 | 49 | 52 | 51 | 52 |
| 9 | - | 49 | 49 | - | - | 48 | 49 | 47 | - | - | 47 | 48 |
| 8 | 45 | 45 | 45 | 44 | 43 | 44 | 45 | 44 | 42 | 46 | 44 | 45 |
| 7 | - | 41 | 41 | 39 | 40 | 40 | 41 | 40 | - | 42 | 41 | 41 |
| 6 | 38 | - | 38 | 35 | 36 | 36 | 37 | 37 | 36 | 39 | 37 | 38 |
| 5 | - | 33 | 34 | - | 32 | 32 | 33 | 33 | 32 | 36 | 34 | 34 |
| 4 | 32 | 30 | 30 | 26 | 29 | 28 | 29 | 29 | 29 | 32 | 31 | 31 |
| 3 | - | - | 26 | 22 | 25 | 24 | 25 | 26 | 26 | 29 | 27 | 27 |
| 2 | 25 | 22 | 22 | 18 | 22 | 19 | 21 | 22 | - | 25 | 24 | 24 |
| 1 | 22 | 18 | 19 | 14 | 18 | 15 | 17 | 18 | 19 | 22 | 21 | 20 |
| 0 | - | - | - | - | - | - | - | - | 16 | 19 | - | - |
Sex: Male
Education: 16 years
Age: 70–79 years
| Scaled score | T1 | T2 | T3 | T4 | T5 | T1–T5 Total | SDFR | LDFR | Total hits | False positives | d-prime | Bias |
|---|---|---|---|---|---|---|---|---|---|---|---|---|
| 19 | 84 | - | - | - | - | 91 | - | - | - | - | 84 | 79 |
| 18 | 81 | 84 | - | - | - | 88 | - | - | - | - | 80 | 76 |
| 17 | - | 81 | - | - | - | 84 | - | - | - | - | 77 | 73 |
| 16 | 74 | 77 | 79 | - | - | 80 | 83 | - | - | - | 74 | 70 |
| 15 | 71 | - | 76 | 76 | 72 | 77 | - | 74 | - | - | 70 | 67 |
| 14 | 68 | 70 | - | 72 | - | 73 | 75 | - | - | - | 67 | 64 |
| 13 | 64 | 67 | 68 | - | 66 | 69 | - | 66 | 61 | 64 | 64 | 61 |
| 12 | 61 | 64 | 65 | 64 | - | 65 | 66 | 63 | - | - | 61 | 58 |
| 11 | - | 60 | 61 | 60 | 59 | 62 | 62 | 59 | - | - | 57 | 55 |
| 10 | 55 | - | - | 56 | 56 | 58 | 58 | 55 | 52 | 55 | 54 | 52 |
| 9 | - | 53 | 54 | - | - | 54 | 54 | 51 | - | - | 51 | 49 |
| 8 | 48 | 50 | 50 | 49 | 49 | 51 | 50 | 48 | 46 | 48 | 47 | 46 |
| 7 | - | 46 | 47 | 45 | 45 | 47 | 46 | 44 | - | 45 | 44 | 43 |
| 6 | 42 | - | 43 | 41 | 42 | 43 | 42 | 40 | 40 | 42 | 41 | 40 |
| 5 | - | 39 | 39 | - | 39 | 39 | 38 | 36 | 36 | 39 | 37 | 37 |
| 4 | 35 | 36 | 36 | 33 | 35 | 36 | 34 | 32 | 33 | 35 | 34 | 34 |
| 3 | - | - | 32 | 30 | 32 | 32 | 30 | 29 | 30 | 32 | 31 | 31 |
| 2 | 29 | 29 | 28 | 26 | 29 | 28 | 26 | 25 | - | 29 | 27 | 28 |
| 1 | 25 | 25 | 25 | 22 | 25 | 25 | 22 | 21 | 24 | 26 | 24 | 25 |
| 0 | - | - | - | - | - | - | - | - | 21 | 23 | - | - |
Sex: Male
Education: 16 years
Age: 80–89 years
| Scaled score | T1 | T2 | T3 | T4 | T5 | T1–T5 Total | SDFR | LDFR | Total hits | False positives | d-prime | Bias |
|---|---|---|---|---|---|---|---|---|---|---|---|---|
| 19 | 88 | - | - | - | - | 93 | - | - | - | - | 87 | 75 |
| 18 | 84 | 85 | - | - | - | 90 | - | - | - | - | 83 | 72 |
| 17 | - | 82 | - | - | - | 87 | - | - | - | - | 80 | 70 |
| 16 | 78 | 79 | 83 | - | - | 83 | 89 | - | - | - | 77 | 67 |
| 15 | 74 | - | 80 | 77 | 76 | 80 | - | 79 | - | - | 74 | 65 |
| 14 | 71 | 73 | - | 74 | - | 76 | 80 | - | - | - | 70 | 62 |
| 13 | 68 | 69 | 73 | - | 69 | 73 | - | 71 | 62 | 66 | 67 | 59 |
| 12 | 65 | 66 | 69 | 67 | - | 70 | 72 | 67 | - | - | 64 | 57 |
| 11 | - | 63 | 66 | 63 | 63 | 66 | 68 | 63 | - | - | 60 | 54 |
| 10 | 58 | - | - | 60 | 60 | 63 | 64 | 59 | 54 | 57 | 57 | 52 |
| 9 | - | 57 | 59 | - | - | 59 | 60 | 55 | - | - | 54 | 49 |
| 8 | 51 | 54 | 55 | 53 | 54 | 56 | 54 | 52 | 48 | 51 | 51 | 46 |
| 7 | - | 50 | 52 | 50 | 50 | 53 | 51 | 48 | - | 48 | 47 | 44 |
| 6 | 45 | - | 48 | 46 | 47 | 59 | 47 | 44 | 43 | 45 | 44 | 41 |
| 5 | - | 44 | 44 | - | 44 | 46 | 43 | 40 | 40 | 42 | 41 | 39 |
| 4 | 38 | 41 | 41 | 39 | 41 | 42 | 39 | 36 | 37 | 38 | 37 | 36 |
| 3 | - | - | 37 | 36 | 38 | 39 | 35 | 32 | 34 | 35 | 34 | 34 |
| 2 | 32 | 34 | 34 | 32 | 35 | 36 | 31 | 28 | - | 32 | 31 | 31 |
| 1 | 28 | 31 | 30 | 29 | 32 | 32 | 27 | 24 | 29 | 29 | 28 | 28 |
| 0 | - | - | - | - | - | - | - | - | 26 | 26 | - | - |
Sex: Male
Education: 17–20 years
Age: 60–69 years
| Scaled score | T1 | T2 | T3 | T4 | T5 | T1–T5 Total | SDFR | LDFR | Total hits | False positives | d-prime | Bias |
|---|---|---|---|---|---|---|---|---|---|---|---|---|
| 19 | 79 | - | - | - | - | 84 | - | - | - | - | 80 | 85 |
| 18 | 76 | 79 | - | - | - | 80 | - | - | - | - | 76 | 81 |
| 17 | - | 75 | - | - | - | 76 | - | - | - | - | 73 | 77 |
| 16 | 69 | 72 | 72 | - | - | 72 | 71 | - | - | - | 70 | 73 |
| 15 | 66 | - | 69 | 70 | 66 | 69 | - | 67 | - | - | 66 | 69 |
| 14 | 63 | 65 | - | 66 | - | 65 | 65 | - | - | - | 63 | 66 |
| 13 | 60 | 61 | 62 | - | 59 | 61 | - | 60 | 59 | 61 | 60 | 62 |
| 12 | 56 | 58 | 58 | 59 | - | 58 | 58 | 57 | - | - | 56 | 58 |
| 11 | - | 54 | 54 | 55 | 53 | 54 | 54 | 53 | - | - | 53 | 54 |
| 10 | 50 | - | - | 51 | 49 | 50 | 51 | 49 | 49 | 50 | 49 | 50 |
| 9 | - | 47 | 47 | - | - | 46 | 47 | 46 | - | - | 46 | 47 |
| 8 | 43 | 44 | 44 | 43 | 43 | 43 | 44 | 42 | 42 | 44 | 43 | 43 |
| 7 | - | 40 | 40 | 39 | 39 | 39 | 40 | 39 | - | 40 | 39 | 39 |
| 6 | 37 | - | 37 | 35 | 36 | 35 | 37 | 35 | 35 | 37 | 36 | 35 |
| 5 | - | 33 | 33 | - | 33 | 32 | 33 | 32 | 31 | 33 | 33 | 31 |
| 4 | 30 | 30 | 29 | 27 | 30 | 28 | 30 | 28 | 28 | 30 | 29 | 28 |
| 3 | - | - | 26 | 24 | 26 | 24 | 27 | 25 | 24 | 26 | 26 | 24 |
| 2 | 24 | 23 | 22 | 20 | 23 | 20 | 23 | 21 | - | 23 | 23 | 20 |
| 1 | 20 | 19 | 19 | 16 | 20 | 17 | 20 | 18 | 17 | 19 | 19 | 16 |
| 0 | - | - | - | - | - | - | - | - | 14 | 16 | - | - |
Sex: Male
Education: 17–20 years
Age: 70–79 years
| Scaled score | T1 | T2 | T3 | T4 | T5 | T1–T5 Total | SDFR | LDFR | Total hits | False positives | d-prime | Bias |
|---|---|---|---|---|---|---|---|---|---|---|---|---|
| 19 | 83 | - | - | - | - | 86 | - | - | - | - | 83 | 79 |
| 18 | 79 | 80 | - | - | - | 83 | - | - | - | - | 79 | 76 |
| 17 | - | 77 | - | - | - | 79 | - | - | - | - | 76 | 73 |
| 16 | 73 | 74 | 76 | - | - | 76 | 76 | - | - | - | 73 | 70 |
| 15 | 70 | - | 73 | 72 | 69 | 73 | - | 72 | - | - | 69 | 66 |
| 14 | 66 | 67 | - | 69 | - | 69 | 69 | - | - | - | 66 | 63 |
| 13 | 63 | 64 | 66 | - | 63 | 66 | - | 64 | 61 | 63 | 63 | 60 |
| 12 | 60 | 61 | 62 | 62 | - | 62 | 62 | 61 | - | - | 59 | 57 |
| 11 | - | 58 | 59 | 58 | 57 | 59 | 59 | 57 | - | - | 56 | 54 |
| 10 | 53 | - | - | 55 | 54 | 56 | 55 | 53 | 52 | 53 | 53 | 51 |
| 9 | - | 51 | 52 | - | - | 52 | 52 | 50 | - | - | 49 | 47 |
| 8 | 47 | 48 | 49 | 48 | 48 | 49 | 48 | 46 | 45 | 46 | 46 | 44 |
| 7 | - | 45 | 45 | 44 | 45 | 45 | 45 | 42 | - | 43 | 43 | 41 |
| 6 | 40 | - | 42 | 41 | 42 | 42 | 41 | 39 | 39 | 40 | 39 | 38 |
| 5 | - | 39 | 38 | - | 39 | 39 | 38 | 35 | 36 | 36 | 36 | 35 |
| 4 | 33 | 35 | 35 | 34 | 35 | 35 | 34 | 31 | 33 | 33 | 33 | 31 |
| 3 | - | - | 31 | 30 | 32 | 32 | 31 | 28 | 29 | 30 | 30 | 28 |
| 2 | 27 | 29 | 28 | 27 | 29 | 28 | 27 | 24 | - | 27 | 26 | 25 |
| 1 | 24 | 26 | 24 | 23 | 26 | 25 | 24 | 21 | 23 | 23 | 23 | 22 |
| 0 | - | - | - | - | - | - | - | - | 20 | 20 | - | - |
Sex: Male
Education: 17–20 years
Age: 80–89 years
| Scaled score | T1 | T2 | T3 | T4 | T5 | T1–T5 Total | SDFR | LDFR | Total hits | False positives | d-prime | Bias |
|---|---|---|---|---|---|---|---|---|---|---|---|---|
| 19 | 86 | - | - | - | - | 88 | - | - | - | - | 86 | 75 |
| 18 | 83 | 81 | - | - | - | 85 | - | - | - | - | 82 | 72 |
| 17 | - | 78 | - | - | - | 82 | - | - | - | - | 79 | 70 |
| 16 | 76 | 75 | 80 | - | - | 79 | 81 | - | - | - | 76 | 67 |
| 15 | 73 | - | 77 | 74 | 73 | 76 | - | 76 | - | - | 73 | 64 |
| 14 | 70 | 70 | - | 71 | - | 73 | 74 | - | - | - | 69 | 61 |
| 13 | 66 | 67 | 70 | - | 67 | 70 | - | 69 | 63 | 65 | 66 | 59 |
| 12 | 63 | 64 | 67 | 65 | - | 66 | 67 | 65 | - | - | 63 | 56 |
| 11 | - | 61 | 63 | 61 | 61 | 63 | 64 | 61 | - | - | 59 | 53 |
| 10 | 57 | - | - | 58 | 58 | 60 | 60 | 57 | 54 | 55 | 56 | 51 |
| 9 | - | 55 | 57 | - | - | 57 | 57 | 54 | - | - | 53 | 48 |
| 8 | 50 | 52 | 53 | 52 | 52 | 54 | 53 | 50 | 48 | 49 | 49 | 45 |
| 7 | - | 49 | 50 | 49 | 49 | 51 | 49 | 46 | - | 46 | 46 | 42 |
| 6 | 43 | - | 47 | 45 | 46 | 48 | 46 | 42 | 42 | 43 | 43 | 40 |
| 5 | - | 43 | 43 | - | 44 | 45 | 42 | 39 | 39 | 39 | 40 | 37 |
| 4 | 37 | 40 | 40 | 39 | 41 | 41 | 39 | 35 | 36 | 36 | 36 | 34 |
| 3 | - | - | 37 | 36 | 38 | 38 | 35 | 31 | 34 | 33 | 33 | 32 |
| 2 | 30 | 34 | 33 | 33 | 35 | 35 | 32 | 27 | - | 30 | 30 | 29 |
| 1 | 27 | 31 | 30 | 30 | 32 | 32 | 28 | 23 | 28 | 27 | 26 | 26 |
| 0 | - | - | - | - | - | - | - | - | 25 | 24 | - | - |
Sex: Female
Education: 12–15 years
Age: 60–69 years
| Scaled score | T1 | T2 | T3 | T4 | T5 | T1–T5 Total | SDFR | LDFR | Total hits | False positives | d-prime | Bias |
|---|---|---|---|---|---|---|---|---|---|---|---|---|
| 19 | 80 | - | - | - | - | 90 | - | - | - | - | 80 | 81 |
| 18 | 77 | 87 | - | - | - | 85 | - | - | - | - | 76 | 78 |
| 17 | - | 82 | - | - | - | 81 | - | - | - | - | 73 | 75 |
| 16 | 70 | 77 | 71 | - | - | 76 | 75 | - | - | - | 70 | 71 |
| 15 | 66 | - | 67 | 69 | 70 | 71 | - | 67 | - | - | 66 | 68 |
| 14 | 63 | 67 | - | 64 | - | 66 | 66 | - | - | - | 63 | 65 |
| 13 | 60 | 62 | 59 | - | 61 | 61 | - | 59 | 58 | 60 | 59 | 61 |
| 12 | 56 | 57 | 55 | 55 | - | 56 | 58 | 56 | - | - | 56 | 58 |
| 11 | - | 52 | 51 | 50 | 52 | 51 | 54 | 52 | - | - | 52 | 55 |
| 10 | 49 | - | - | 45 | 47 | 46 | 50 | 48 | 48 | 50 | 49 | 51 |
| 9 | - | 42 | 43 | - | - | 42 | 46 | 44 | - | - | 45 | 48 |
| 8 | 42 | 38 | 39 | 36 | 38 | 37 | 42 | 41 | 41 | 43 | 42 | 45 |
| 7 | - | 33 | 35 | 31 | 33 | 32 | 38 | 37 | - | 40 | 39 | 41 |
| 6 | 35 | - | 31 | 27 | 29 | 27 | 33 | 33 | 34 | 37 | 35 | 38 |
| 5 | - | 23 | 27 | - | 24 | 22 | 29 | 30 | 30 | 33 | 32 | 35 |
| 4 | 28 | 18 | 23 | 17 | 20 | 17 | 25 | 26 | 27 | 30 | 28 | 31 |
| 3 | - | - | 19 | 13 | 15 | 12 | 21 | 22 | 23 | 27 | 25 | 28 |
| 2 | 21 | 8 | 15 | 8 | 10 | 7 | 17 | 19 | - | 23 | 21 | 25 |
| 1 | 18 | 3 | 11 | 3 | 6 | 2 | 13 | 15 | 16 | 20 | 18 | 21 |
| 0 | - | - | - | - | - | - | - | - | 13 | 16 | - | - |
Sex: Female
Education: 12–15 years
Age: 70–79 years
| Scaled score | T1 | T2 | T3 | T4 | T5 | T1–T5 Total | SDFR | LDFR | Total hits | False positives | d-prime | Bias |
|---|---|---|---|---|---|---|---|---|---|---|---|---|
| 19 | 84 | - | - | - | - | 93 | - | - | - | - | 83 | 77 |
| 18 | 81 | 88 | - | - | - | 89 | - | - | - | - | 80 | 74 |
| 17 | - | 83 | - | - | - | 84 | - | - | - | - | 76 | 71 |
| 16 | 74 | 79 | 76 | - | - | 80 | 80 | - | - | - | 73 | 68 |
| 15 | 70 | - | 72 | 71 | 75 | 76 | - | 71 | - | - | 69 | 65 |
| 14 | 67 | 70 | - | 67 | - | 71 | 72 | - | - | - | 66 | 63 |
| 13 | 63 | 66 | 64 | - | 66 | 67 | - | 64 | 60 | 62 | 63 | 60 |
| 12 | 60 | 62 | 60 | 59 | - | 62 | 64 | 60 | - | - | 59 | 57 |
| 11 | - | 57 | 56 | 55 | 58 | 58 | 60 | 56 | - | - | 56 | 54 |
| 10 | 53 | - | - | 51 | 54 | 54 | 55 | 52 | 51 | 53 | 52 | 51 |
| 9 | - | 49 | 49 | - | - | 49 | 51 | 48 | - | - | 49 | 48 |
| 8 | 46 | 44 | 45 | 43 | 45 | 45 | 47 | 45 | 44 | 46 | 45 | 46 |
| 7 | - | 40 | 41 | 38 | 41 | 41 | 43 | 41 | - | 43 | 42 | 43 |
| 6 | 39 | - | 37 | 34 | 37 | 36 | 39 | 37 | 38 | 40 | 39 | 40 |
| 5 | - | 31 | 33 | - | 33 | 32 | 34 | 33 | 35 | 36 | 35 | 37 |
| 4 | 32 | 27 | 29 | 26 | 28 | 28 | 30 | 29 | 32 | 33 | 32 | 34 |
| 3 | - | - | 26 | 22 | 24 | 23 | 26 | 25 | 28 | 30 | 28 | 31 |
| 2 | 25 | 18 | 22 | 18 | 20 | 19 | 22 | 22 | - | 27 | 25 | 29 |
| 1 | 21 | 14 | 18 | 14 | 16 | 15 | 18 | 18 | 22 | 24 | 22 | 26 |
| 0 | - | - | - | - | - | - | - | - | 19 | 20 | - | - |
Sex: Female
Education: 12–15 years
Age: 80–89 years
| Scaled score | T1 | T2 | T3 | T4 | T5 | T1–T5 Total | SDFR | LDFR | Total hits | False positives | d-prime | Bias |
|---|---|---|---|---|---|---|---|---|---|---|---|---|
| 19 | 88 | - | - | - | - | 95 | - | - | - | - | 86 | 74 |
| 18 | 84 | 89 | - | - | - | 91 | - | - | - | - | 83 | 71 |
| 17 | - | 85 | - | - | - | 87 | - | - | - | - | 79 | 69 |
| 16 | 77 | 81 | 80 | - | - | 83 | 86 | - | - | - | 76 | 66 |
| 15 | 74 | - | 76 | 74 | 78 | 79 | - | 76 | - | - | 72 | 64 |
| 14 | 70 | 73 | - | 70 | - | 75 | 78 | - | - | - | 69 | 61 |
| 13 | 67 | 69 | 69 | - | 71 | 72 | - | 68 | 62 | 64 | 66 | 59 |
| 12 | 63 | 65 | 65 | 63 | - | 68 | 70 | 64 | - | - | 62 | 56 |
| 11 | - | 61 | 61 | 59 | 63 | 64 | 65 | 60 | - | - | 59 | 54 |
| 10 | 56 | - | - | 55 | 59 | 60 | 61 | 56 | 53 | 55 | 56 | 51 |
| 9 | - | 54 | 54 | - | - | 56 | 57 | 52 | - | - | 52 | 49 |
| 8 | 49 | 50 | 50 | 48 | 51 | 52 | 53 | 49 | 47 | 49 | 49 | 46 |
| 7 | - | 46 | 46 | 44 | 47 | 48 | 48 | 45 | - | 46 | 46 | 44 |
| 6 | 42 | - | 43 | 40 | 44 | 44 | 44 | 41 | 41 | 43 | 42 | 41 |
| 5 | - | 38 | 39 | - | 40 | 40 | 40 | 37 | 39 | 39 | 39 | 39 |
| 4 | 35 | 34 | 35 | 33 | 36 | 36 | 36 | 33 | 36 | 36 | 35 | 36 |
| 3 | - | - | 32 | 29 | 32 | 32 | 31 | 29 | 33 | 33 | 32 | 34 |
| 2 | 28 | 26 | 28 | 26 | 28 | 28 | 27 | 25 | - | 30 | 29 | 31 |
| 1 | 25 | 22 | 24 | 22 | 24 | 25 | 23 | 21 | 27 | 27 | 25 | 29 |
| 0 | - | - | - | - | - | - | - | - | 24 | 24 | - | - |
Sex: Female
Education: 16 years
Age: 60–69 years
| Scaled score | T1 | T2 | T3 | T4 | T5 | T1–T5 Total | SDFR | LDFR | Total hits | False positives | d-prime | Bias |
|---|---|---|---|---|---|---|---|---|---|---|---|---|
| 19 | 79 | - | - | - | - | 84 | - | - | - | - | 79 | 82 |
| 18 | 75 | 81 | - | - | - | 79 | - | - | - | - | 75 | 79 |
| 17 | - | 76 | - | - | - | 75 | - | - | - | - | 72 | 75 |
| 16 | 68 | 72 | 68 | - | - | 71 | 69 | - | - | - | 68 | 71 |
| 15 | 65 | - | 65 | 66 | 66 | 66 | - | 65 | - | - | 65 | 68 |
| 14 | 62 | 63 | - | 61 | - | 62 | 62 | - | - | - | 62 | 64 |
| 13 | 58 | 59 | 57 | - | 58 | 58 | - | 57 | 59 | 58 | 58 | 61 |
| 12 | 55 | 54 | 53 | 53 | - | 53 | 55 | 54 | - | - | 55 | 57 |
| 11 | - | 50 | 49 | 49 | 50 | 49 | 52 | 50 | - | - | 51 | 54 |
| 10 | 48 | - | - | 45 | 46 | 45 | 48 | 47 | 48 | 48 | 48 | 50 |
| 9 | - | 41 | 42 | - | - | 40 | 45 | 43 | - | - | 44 | 46 |
| 8 | 41 | 37 | 38 | 36 | 38 | 36 | 41 | 40 | 40 | 41 | 41 | 43 |
| 7 | - | 33 | 34 | 32 | 34 | 32 | 38 | 36 | - | 38 | 37 | 39 |
| 6 | 34 | - | 30 | 28 | 30 | 27 | 34 | 32 | 33 | 34 | 34 | 36 |
| 5 | - | 24 | 27 | - | 25 | 23 | 31 | 29 | 29 | 31 | 30 | 32 |
| 4 | 27 | 20 | 23 | 19 | 21 | 19 | 27 | 25 | 25 | 27 | 27 | 28 |
| 3 | - | - | 19 | 15 | 17 | 14 | 23 | 22 | 22 | 24 | 24 | 25 |
| 2 | 20 | 11 | 15 | 11 | 13 | 10 | 20 | 18 | - | 21 | 20 | 21 |
| 1 | 16 | 7 | 12 | 7 | 9 | 6 | 16 | 14 | 14 | 17 | 17 | 18 |
| 0 | - | - | - | - | - | - | - | - | 11 | 14 | - | - |
Sex: Female
Education: 16 years
Age: 70–79 years
| Scaled score | T1 | T2 | T3 | T4 | T5 | T1–T5 Total | SDFR | LDFR | Total hits | False positives | d-prime | Bias |
|---|---|---|---|---|---|---|---|---|---|---|---|---|
| 19 | 83 | - | - | - | - | 87 | - | - | - | - | 82 | 77 |
| 18 | 79 | 82 | - | - | - | 83 | - | - | - | - | 79 | 74 |
| 17 | - | 78 | - | - | - | 79 | - | - | - | - | 75 | 71 |
| 16 | 72 | 74 | 73 | - | - | 75 | 74 | - | - | - | 72 | 68 |
| 15 | 69 | - | 69 | 68 | 71 | 71 | - | 69 | - | - | 68 | 65 |
| 14 | 65 | 67 | - | 65 | - | 67 | 67 | - | - | - | 65 | 62 |
| 13 | 62 | 63 | 62 | - | 63 | 63 | - | 62 | 61 | 61 | 61 | 59 |
| 12 | 58 | 59 | 58 | 57 | - | 59 | 60 | 58 | - | - | 58 | 56 |
| 11 | - | 55 | 54 | 53 | 56 | 55 | 56 | 54 | - | - | 55 | 53 |
| 10 | 51 | - | - | 50 | 52 | 51 | 53 | 50 | 51 | 51 | 51 | 50 |
| 9 | - | 47 | 47 | - | - | 48 | 49 | 47 | - | - | 48 | 47 |
| 8 | 44 | 43 | 43 | 42 | 44 | 44 | 46 | 43 | 44 | 44 | 44 | 44 |
| 7 | - | 39 | 40 | 38 | 41 | 40 | 42 | 39 | - | 41 | 41 | 41 |
| 6 | 37 | - | 36 | 35 | 37 | 36 | 39 | 36 | 37 | 38 | 37 | 38 |
| 5 | - | 31 | 33 | - | 33 | 32 | 35 | 32 | 34 | 34 | 34 | 35 |
| 4 | 30 | 28 | 29 | 27 | 29 | 28 | 31 | 28 | 31 | 31 | 31 | 32 |
| 3 | - | - | 25 | 23 | 26 | 24 | 28 | 25 | 27 | 28 | 27 | 29 |
| 2 | 23 | 20 | 22 | 20 | 22 | 20 | 24 | 21 | - | 24 | 24 | 26 |
| 1 | 19 | 16 | 18 | 16 | 18 | 16 | 21 | 17 | 21 | 21 | 20 | 23 |
| 0 | - | - | - | - | - | - | - | - | 17 | 18 | - | - |
Sex: Female
Education: 16 years
Age: 80–89 years
| Scaled score | T1 | T2 | T3 | T4 | T5 | T1–T5 Total | SDFR | LDFR | Total hits | False positives | d-prime | Bias |
|---|---|---|---|---|---|---|---|---|---|---|---|---|
| 19 | 87 | - | - | - | - | 89 | - | - | - | - | 85 | 74 |
| 18 | 83 | 83 | - | - | - | 86 | - | - | - | - | 82 | 71 |
| 17 | - | 80 | - | - | - | 82 | - | - | - | - | 78 | 68 |
| 16 | 76 | 76 | 77 | - | - | 78 | 79 | - | - | - | 75 | 66 |
| 15 | 72 | - | 73 | 71 | 74 | 75 | - | 74 | - | - | 71 | 63 |
| 14 | 69 | 69 | - | 67 | - | 71 | 72 | - | - | - | 68 | 61 |
| 13 | 65 | 66 | 66 | - | 67 | 68 | - | 66 | 62 | 63 | 65 | 58 |
| 12 | 62 | 62 | 63 | 61 | - | 64 | 65 | 62 | - | - | 61 | 55 |
| 11 | - | 59 | 59 | 57 | 60 | 61 | 61 | 58 | - | - | 58 | 53 |
| 10 | 55 | - | - | 54 | 57 | 57 | 58 | 55 | 53 | 53 | 55 | 50 |
| 9 | - | 52 | 52 | - | - | 54 | 54 | 51 | - | - | 51 | 48 |
| 8 | 48 | 48 | 48 | 47 | 50 | 50 | 50 | 47 | 47 | 47 | 48 | 45 |
| 7 | - | 45 | 45 | 44 | 46 | 46 | 47 | 43 | - | 44 | 44 | 42 |
| 6 | 41 | - | 41 | 40 | 43 | 43 | 43 | 39 | 41 | 41 | 41 | 40 |
| 5 | - | 38 | 38 | - | 40 | 39 | 40 | 35 | 38 | 37 | 38 | 37 |
| 4 | 33 | 34 | 34 | 33 | 36 | 36 | 36 | 32 | 35 | 34 | 34 | 35 |
| 3 | - | - | 31 | 30 | 33 | 32 | 32 | 28 | 32 | 31 | 31 | 32 |
| 2 | 26 | 27 | 27 | 27 | 29 | 29 | 29 | 24 | - | 28 | 27 | 29 |
| 1 | 23 | 23 | 24 | 23 | 26 | 25 | 25 | 20 | 26 | 25 | 24 | 27 |
| 0 | - | - | - | - | - | - | - | - | 23 | 22 | - | - |
Sex: Female
Education: 17–20 years
Age: 60–69 years
| Scaled score | T1 | T2 | T3 | T4 | T5 | T1–T5 Total | SDFR | LDFR | Total hits | False positives | d-prime | Bias |
|---|---|---|---|---|---|---|---|---|---|---|---|---|
| 19 | 78 | - | - | - | - | 78 | - | - | - | - | 78 | 83 |
| 18 | 74 | 76 | - | - | - | 74 | - | - | - | - | 74 | 79 |
| 17 | - | 72 | - | - | - | 71 | - | - | - | - | 71 | 75 |
| 16 | 67 | 68 | 66 | - | - | 67 | 65 | - | - | - | 67 | 71 |
| 15 | 63 | - | 62 | 63 | 63 | 63 | - | 63 | - | - | 64 | 68 |
| 14 | 60 | 60 | - | 59 | - | 59 | 59 | - | - | - | 60 | 64 |
| 13 | 56 | 56 | 55 | - | 56 | 55 | - | 56 | 59 | 57 | 57 | 60 |
| 12 | 53 | 52 | 51 | 52 | - | 51 | 53 | 52 | - | - | 54 | 56 |
| 11 | - | 48 | 48 | 48 | 49 | 47 | 50 | 49 | - | - | 50 | 52 |
| 10 | 46 | - | - | 44 | 45 | 43 | 47 | 45 | 47 | 46 | 47 | 48 |
| 9 | - | 41 | 41 | - | - | 39 | 44 | 42 | - | - | 43 | 44 |
| 8 | 39 | 37 | 37 | 36 | 38 | 35 | 41 | 38 | 40 | 39 | 40 | 41 |
| 7 | - | 33 | 33 | 33 | 34 | 31 | 38 | 35 | - | 35 | 36 | 37 |
| 6 | 32 | - | 30 | 29 | 30 | 28 | 35 | 31 | 32 | 32 | 33 | 33 |
| 5 | - | 25 | 26 | - | 27 | 24 | 31 | 28 | 28 | 28 | 29 | 29 |
| 4 | 25 | 21 | 23 | 21 | 23 | 20 | 28 | 24 | 24 | 25 | 26 | 25 |
| 3 | - | - | 19 | 17 | 19 | 16 | 25 | 21 | 20 | 21 | 22 | 21 |
| 2 | 18 | 13 | 16 | 14 | 15 | 12 | 22 | 17 | - | 18 | 19 | 18 |
| 1 | 14 | 9 | 12 | 10 | 12 | 8 | 19 | 14 | 13 | 14 | 15 | 14 |
| 0 | - | - | - | - | - | - | - | - | 9 | 11 | - | - |
Sex: Female
Education: 17–20 years
Age: 70–79 years
| Scaled score | T1 | T2 | T3 | T4 | T5 | T1–T5 Total | SDFR | LDFR | Total hits | False positives | d-prime | Bias |
|---|---|---|---|---|---|---|---|---|---|---|---|---|
| 19 | 81 | - | - | - | - | 82 | - | - | - | - | 81 | 78 |
| 18 | 78 | 78 | - | - | - | 78 | - | - | - | - | 78 | 74 |
| 17 | - | 74 | - | - | - | 74 | - | - | - | - | 74 | 71 |
| 16 | 71 | 70 | 70 | - | - | 71 | 70 | - | - | - | 71 | 68 |
| 15 | 67 | - | 66 | 66 | 68 | 67 | - | 67 | - | - | 67 | 65 |
| 14 | 64 | 63 | - | 62 | - | 64 | 63 | - | - | - | 64 | 62 |
| 13 | 60 | 60 | 59 | - | 61 | 60 | - | 60 | 61 | 59 | 60 | 58 |
| 12 | 57 | 56 | 56 | 56 | - | 57 | 57 | 56 | - | - | 57 | 55 |
| 11 | - | 53 | 53 | 52 | 54 | 53 | 54 | 53 | - | - | 53 | 52 |
| 10 | 49 | - | - | 49 | 50 | 50 | 51 | 49 | 50 | 49 | 50 | 49 |
| 9 | - | 46 | 46 | - | - | 46 | 48 | 45 | - | - | 47 | 46 |
| 8 | 42 | 42 | 42 | 42 | 44 | 42 | 45 | 42 | 44 | 42 | 43 | 42 |
| 7 | - | 39 | 39 | 38 | 40 | 39 | 42 | 38 | - | 39 | 40 | 39 |
| 6 | 35 | - | 35 | 35 | 37 | 35 | 38 | 35 | 37 | 35 | 36 | 36 |
| 5 | - | 32 | 32 | - | 33 | 32 | 35 | 31 | 33 | 32 | 33 | 33 |
| 4 | 28 | 28 | 28 | 28 | 30 | 28 | 32 | 27 | 30 | 29 | 29 | 29 |
| 3 | - | - | 25 | 25 | 27 | 25 | 29 | 24 | 26 | 25 | 26 | 26 |
| 2 | 21 | 21 | 21 | 21 | 23 | 21 | 26 | 20 | - | 22 | 22 | 23 |
| 1 | 17 | 18 | 18 | 18 | 20 | 18 | 23 | 17 | 19 | 18 | 19 | 20 |
| 0 | - | - | - | - | - | - | - | - | 16 | 15 | - | - |
Sex: Female
Education: 17–20 years
Age: 80–89 years
| Scaled score | T1 | T2 | T3 | T4 | T5 | T1–T5 Total | SDFR | LDFR | Total hits | False positives | d-prime | Bias |
|---|---|---|---|---|---|---|---|---|---|---|---|---|
| 19 | 85 | - | - | - | - | 84 | - | - | - | - | 84 | 74 |
| 18 | 82 | 79 | - | - | - | 81 | - | - | - | - | 81 | 71 |
| 17 | - | 76 | - | - | - | 78 | - | - | - | - | 77 | 68 |
| 16 | 75 | 73 | 74 | - | - | 74 | 74 | - | - | - | 74 | 66 |
| 15 | 71 | - | 70 | 68 | 71 | 71 | - | 71 | - | - | 70 | 63 |
| 14 | 67 | 66 | - | 65 | - | 68 | 68 | - | - | - | 67 | 60 |
| 13 | 64 | 63 | 64 | - | 65 | 65 | - | 64 | 63 | 61 | 64 | 57 |
| 12 | 60 | 60 | 60 | 59 | - | 61 | 61 | 60 | - | - | 60 | 55 |
| 11 | - | 57 | 57 | 56 | 58 | 58 | 58 | 57 | - | - | 57 | 52 |
| 10 | 53 | - | - | 53 | 55 | 55 | 55 | 53 | 53 | 51 | 53 | 49 |
| 9 | - | 50 | 50 | - | - | 52 | 52 | 49 | - | - | 50 | 46 |
| 8 | 46 | 47 | 47 | 46 | 49 | 48 | 49 | 45 | 47 | 45 | 47 | 44 |
| 7 | - | 44 | 44 | 43 | 46 | 45 | 46 | 42 | - | 42 | 43 | 41 |
| 6 | 39 | - | 40 | 40 | 42 | 42 | 42 | 38 | 40 | 38 | 40 | 38 |
| 5 | - | 37 | 37 | - | 39 | 39 | 39 | 34 | 37 | 35 | 36 | 35 |
| 4 | 32 | 34 | 34 | 34 | 36 | 35 | 36 | 30 | 34 | 32 | 33 | 33 |
| 3 | - | - | 30 | 31 | 33 | 32 | 33 | 27 | 31 | 29 | 30 | 30 |
| 2 | 24 | 27 | 27 | 27 | 30 | 29 | 30 | 23 | - | 26 | 26 | 27 |
| 1 | 21 | 24 | 24 | 24 | 26 | 25 | 27 | 19 | 25 | 22 | 23 | 24 |
| 0 | - | - | - | - | - | - | - | - | 21 | 19 | - | - |
Appendix C. Final equations to convert normalized scaled scores into demographically adjusted T-scores. Appropriate for ages 60–89 and education levels 12–20 years. To use, insert scaled score, age, education, and sex for the given individual into the equation of the desired CVLT metric. Use 0 for male, 1 for female.
| CVLT Trial 1 | 50 + 10 * {[(CVLT T1 scaled score) − (13.22 – 10.20*(age/100) + 1.88*(edu/10) + 1.11*sex)] / [2.72 − 0.16*(age/100) −0.08*(edu/10) −0.18*sex]} / 1.24 |
| CVLT Trial 2 | 50 + 10 * {[(CVLT T2 scaled score) − (14.93 – 13.50*(age/100) + 2.00*(edu/10) + 1.67*sex)] / [−0.66 + 1.97*(age/100) +0.97*(edu/10) −0.24*sex]} / 1.19 |
| CVLT Trial 3 | 50 + 10 * {[(CVLT T3 scaled score) − (15.62 – 14.80*(age/100) + 2.05*(edu/10) + 1.90*sex)] / [0.89 + 0.57*(age/100) +0.54*(edu/10) +0.02*sex]} / 1.24 |
| CVLT Trial 4 | 50 + 10 * {[(CVLT T4 scaled score) − (14.86 – 12.00*(age/100) + 1.40*(edu/10) + 1.81*sex)] / [−0.60 + 2.29*(age/100) +0.68*(edu/10) +0.07*sex]} / 1.22 |
| CVLT Trial 5 | 50 + 10 * {[(CVLT T5 scaled score) − (18.18 – 17.14*(age/100) + 1.75*(edu/10) + 1.21*sex)] / [0.05 + 0.65*(age/100) +1.10*(edu/10) −0.21*sex]} / 1.22 |
| CVLT Trials 1–5 Total | 50 + 10 * {[(CVLT Tot scaled score) − (16.75 – 16.18*(age/100) + 2.02*(edu/10) + 1.78*sex)] / [−0.67 + 2.04*(age/100) +0.82*(edu/10) −0.11*sex]} / 1.24 |
| CVLT SDFR | 50 + 10 * {[(SDFR scaled score) − (14.70 – 13.19*(age/100) + 1.98*(edu/10) + 1.23*sex)] / [0.09 – 0.28*(age/100) +1.30*(edu/10) +0.28*sex]} / 1.25 |
| CVLT LDFR | 50 + 10 * {[(LDFR scaled score) − (13.80 – 10.57*(age/100) + 1.74*(edu/10) + 1.21 *sex)] / [2.25 – 0.74*(age/100) +0.27*(edu/10) +0.03*sex]} / 1.25 |
| CVLT Recognition Hits | 50 + 10 * {[(Hits scaled score) − (15.47 – 8.48*(age/100) +0.20*(edu/10) + 0.38*sex)] / [1.59 + 2.30*(age/100) −0.41*(edu/10) −0.22*sex]} / 1.23 |
| CVLT False Positive Total | 50 + 10 * {[(FP tot scaled score) − (10.73 – 7.79*(age/100) + 2.28*(edu/10)+ 1.25*sex)] / [2.19 + 1.12*(age/100) −0.26*(edu/10) −0.06*sex]} / 1.19 |
| CVLT d-Prime | 50 + 10 * {[(D Prime scaled score) − (14.10 – 9.92*(age/100) + 1.35*(edu/10) + 0.84*sex)] / [2.36 + 0.21*(age/100) - 0.05*(edu/10) −0.08*sex]} / 1.24 |
| CVLT Bias | 50 + 10 * {[(Bias scaled score) − (7.13 – 0.47*(age/100) + 1.65*(edu/10) + 0.55*sex)] / [0.60 + 4.01*(age/100) −0.63*(edu/10) −0.03*sex]} / 1.29 |
CVLT = California Verbal Learning Test; SDFR = short delay free recall; LDFR = long delay free recall.
Footnotes
Disclosure statement
No potential conflict of interest was reported by the authors.
References
- Ambler G, & Benner A (2008). mfp: Multivariable fractional polynomials. Retrieved from http://stat.ethz.ch/CRAN/. [Google Scholar]
- Casaletto KB, Umlauf A, Marquine M, Mungas D, Beaumont J, Gershon R, … Heaton RK (2016). Demographically-corrected normative standards for the Spanish version of the NIH toolbox cognition battery. Journal of the International Neuropsychological Society, 21, 1–12. [DOI] [PMC free article] [PubMed] [Google Scholar]
- Casaletto KB, Umlauf A, Beaumont J, Gershon R, Slotkin J, Akshoomoff N, & Heaton RK (2015). Demographically corrected normative standards for the English version of the NIH toolbox cognition battery. Journal of the International Neuropsychological Society, 21(5), 378–391. doi: 10.1017/S1355617715000351 [DOI] [PMC free article] [PubMed] [Google Scholar]
- De Santi S, Pirraglia E, Barr W, Babb J, Williams S, Rogers K, … de Leon MJ (2008). Robust and conventional neuropsychological norms: Diagnosis and prediction of age-related cognitive decline. Neuropsychology, 22(4), 469–484. doi: 10.1037/0894-4105.22.4.469 [DOI] [PMC free article] [PubMed] [Google Scholar]
- Delis DC, Kramer JH, Kaplan E, & Ober BA (2000). California Verbal Learning Test-II (Second Edition). San Antonio, TX: The Psychological Corporation. [Google Scholar]
- Delis DC, Kramer JH, Kaplan E, & Ober BA (2017). California Verbal Learning Test-3 (Third Edition). San Antonio, TX: The Psychological Corporation. [Google Scholar]
- Fine EM, Kramer JH, Lui LY, & Yaffe K and the Study of Osteoporotic Fractures (SOF) Research Group (2012). Normative data in women age 85 and older: Verbal fluency, digit span, and the CVLT-II short form. Clinical Neuropsychology, 26(1), 18–30. doi: 10.1080/13854046.2011.639310 [DOI] [PMC free article] [PubMed] [Google Scholar]
- Folstein MF, Folstein SE, McHugh PR, & Fanjiang G (1975). Mini-mental state examination. Mental Measurements Yearbook with Tests in Print, EBSCOhost, (accessed July 11, 2018). [Google Scholar]
- Harrington KD, Lim YY, Ames D, Hassenstab J, Rainey-Smith S, Robertson J, … Maruff P (2017). Using robust normative data to investigate the neuropsychology of cognitive aging. Archives of Clinical Neuropsychology, 32(2), 142–154. doi: 10.1093/arclin/acw106 [DOI] [PubMed] [Google Scholar]
- Harrington KD, Schembri A, Lim YY, Dang C, Ames D, Hassenstab J, … Maruff P (2018). Estimates of age-related memory decline are inflated by unrecognized Alzheimer’s disease. Neurobiology of Aging, 70, 170–179. doi: 10.1016/j.neurobiolaging.2018.06.005 [DOI] [PubMed] [Google Scholar]
- Holtzer R, Goldin Y, Zimmerman M, Katz M, Buschke H, & Lipton RB (2008). Robust norms for selected neuropsychological tests in older adults. Archives of Clinical Neuropsychology, 23(5), 531–541. doi: 10.1016/j.acn.2008.05.004 [DOI] [PMC free article] [PubMed] [Google Scholar]
- Hurd MD, Martorell P, & Langa KM (2013). Monetary costs of dementia in the United States. The New England Journal of Medicine, 369(5), 489–490. doi: 10.1056/NEJMc1305541 [DOI] [PubMed] [Google Scholar]
- Jorm AF, & Jolley D (1998). The incidence of dementia: A meta-analysis. Neurology, 51(3), 728–733. [DOI] [PubMed] [Google Scholar]
- Karzmark P, Heaton RK, Grant I, & Matthews CG (1984). Use of demographic variable to predict overall level of performance on the Halstead-Reitan battery. Journal of Consulting and Clinical Psychology, 52(4), 663–665. doi: 10.1037//0022-006X.52.4.663 [DOI] [PubMed] [Google Scholar]
- Kramer JH, Yaffe K, Lengenfelder J, & Delis DC (2003). Age and gender interactions on verbal memory performance. Journal of the International Neuropsychological Society, 9(1), 97–102. doi: 10.1017/S1355617703910113 [DOI] [PubMed] [Google Scholar]
- Lamar M, Resnick SM, & Zonderman AB (2003). Longitudinal changes in verbal memory in older adults: Distinguishing the effects of age from repeat testing. Neurology, 60(1), 82–86. doi: 10.1212/WNL.60.1.82 [DOI] [PubMed] [Google Scholar]
- Lundervold AJ, Wollschlager D, & Wehling E (2014). Age and sex related changes in episodic memory function in middle aged and older adults. Scandinavian Journal of Psychology, 55(3), 225–232. doi: 10.1111/sjop.12114 [DOI] [PMC free article] [PubMed] [Google Scholar]
- Negash S, Bennett DA, Wilson RS, Schneider JA, & Arnold SE (2011). Cognition and neuropathology in aging: Multidimensional perspectives from the rush religious orders study and rush memory and aging project. Current Alzheimer Research, 8(4), 336–340. doi: 10.2174/156720511795745302 [DOI] [PMC free article] [PubMed] [Google Scholar]
- Manly JJ, Jacobs DM, Touradji P, Small SA, & Stern Y (2002). Reading level attenuates differences in neuropsychological test performance between African American and White elders. Journal of the International Neuropsychological Society, 8(3), 341–348. doi: 10.1017/S1355617702813157 [DOI] [PubMed] [Google Scholar]
- Morris JC (1993). The Clinical Dementia Rating (CDR): Current version and scoring rules. Neurology, 43(11), 2412–2414. doi: 10.1212/WNL.43.11.2412-a [DOI] [PubMed] [Google Scholar]
- Ortman JM, Velkoff VA, & Hogan H (2014). An aging nation: The older population in the United States. Washington, DC: US Census Bureau; 2014; Available at http://www.census.gov/prod/2014pubs/p25-1140.pdf. [Google Scholar]
- Pedraza O, Lucas JA, Smith GE, Petersen RC, Graff-Radford NR, & Ivnik RJ (2010). Robust and expanded norms for the Dementia Rating Scale. Archives of Clinical Neuropsychology, 25(5), 347–358. doi: 10.1093/arclin/acq030 [DOI] [PMC free article] [PubMed] [Google Scholar]
- Rabin LA, Barr WB, & Burton LA (2005). Assessment practices of clinical neuropsychologists in the United States and Canada: A survey of INS, NAN, and APA Division 40 members. Archives of Clinical Neuropsychology, 20(1), 33–65. doi: 10.1016/j.acn.2004.02.005 [DOI] [PubMed] [Google Scholar]
- Rabin LA, Paolillo E, & Barr WB (2016). Stability in test-usage practices of clinical neuropsychologists in the United States and Canada over a 10-year period: A follow-up survey of INS and NAN members. Archives of Clinical Neuropsychology, 31(3), 206–230. doi: 10.1093/arclin/acw007 [DOI] [PubMed] [Google Scholar]
- Ragland JD, Coleman AR, Gur RC, Glahn DC, & Gur RE (2000). Sex differences in brain-behavior relationships between verbal episodic memory and resting regional cerebral blood flow. Neuropsychologia, 38(4), 451–461. doi: 10.1016/S0028-3932(99)00086-X [DOI] [PMC free article] [PubMed] [Google Scholar]
- Ritchie L, Frerichs R, & Tuokko H (2007). Effective normative samples for the detection of cognitive impairment in older adults. The Clinical Neuropsychologist, 21(6), 863–874. doi: 10.1080/13854040701557239 [DOI] [PubMed] [Google Scholar]
- Royston P, & Altman D (1994). Regression using fractional polynomials of continuous covariates. Applied Statistics, 43(3), 429–467. doi: 10.2307/2986270 [DOI] [Google Scholar]
- Sliwinski M, Lipton RB, Buschke H, & Steward W (1996). The effects of preclinical dementia on estimates of normal cognitive functioning in aging. Journal of Gerontology: Psychological Sciences, 51, 217–225. [DOI] [PubMed] [Google Scholar]
- Tombaugh TN, Kozak J, & Rees L (1999). Normative data stratified by age and education for two measures of verbal fluency: FAS and animal naming. Archives of Clinical Neuropsychology, 14(2), 167–177. doi: 10.1016/S0887-6177(97)00095-4 [DOI] [PubMed] [Google Scholar]
- Trahan DE, & Quintana JW (1990). Analysis of gender effects upon verbal and visual memory performance in adults. Archives of Clinical Neuropsychology, 5(4), 325–334. doi: 10.1093/arclin/5.4.325 [DOI] [PubMed] [Google Scholar]