

Abstract
Background:
Hemodynamic patterns have been associated with cerebral aneurysm instability. For patient-specific computational fluid dynamics (CFD) simulations, the inflow rates of a patient are typically not known. The aim of this study was to analyze the influence of inter- and intra-patient variations of cerebral blood flow on the computed hemodynamics through CFD simulations and to incorporate these variations into statistical models for aneurysm rupture prediction.
Methods:
Image data of 1,820 aneurysms were used for patient-specific steady CFD simulations with nine different inflow rates per case, capturing inter- and intra-patient flow variations. Based on the computed flow fields, 17 hemodynamic parameters were calculated and compared for the different flow conditions. Next, statistical models for aneurysm rupture were trained in 1,571 of the aneurysms including hemodynamic parameters capturing the flow-variations either by defining hemodynamic “response variables” (model A) or repeatedly randomly selecting flow conditions by patients (model B) as well as morphological and patient-specific variables. Both models were evaluated in the remaining 249 cases.
Results:
All hemodynamic parameters were significantly different for the varying flow conditions (p<0.001). Both the flow-independent “response” model A and the flow-dependent model B performed well with areas under the receiver operating characteristic curve of 0.8182 and 0.8174±0.0045, respectively.
Conclusions:
The influence of inter- and intra-patient flow variations on computed hemodynamics can be taken into account in multivariate aneurysm rupture prediction models achieving a good predictive performance. Such models can be applied to CFD data independent of the specific inflow boundary conditions.
Keywords: Cerebral aneurysm, Risk factors, Hemodynamics, Computational Fluid Dynamics, Rupture, Prediction
Introduction
Cerebral aneurysm rupture leading to subarachnoid hemorrhage is associated with high morbidity, mortality, and a large economic burden [18, 22]. To prevent a future rupture of an unruptured aneurysm, different treatment options exist. However, the risks that are associated with endovascular or surgical treatment and its complications typically outweigh the natural aneurysm rupture risk of – on average – about one percent per patient and year [13, 23]. Consequently, treatment decisions of incidental aneurysms, which are diagnosed more frequently due to an increased use of medical imaging technologies [12], are challenging.
For improved treatment decisions, a thorough understanding of the mechanisms leading to aneurysm growth and rupture is necessary. While a plethora of risk factors have been suggested in previous studies [14], these mechanisms are not yet fully understood. Hemodynamics are believed to play an important role through biomechanical signaling mechanisms [3]. A statistical model based on different risk factors could potentially be used to assist physicians in their treatment decisions. However, the models that include hemodynamic parameters are typically based on relatively small sample sizes of less than 250 cases and have not been externally evaluated so that they are limited in their applicability to other than the populations that were used for model development [1, 26]. Furthermore, boundary conditions to determine the hemodynamics are generally unknown for the very patient so that instead generic models are applied and the variability of patient flow is often simply disregarded.
We recently developed an aneurysm rupture probability model based on a large data set of 1631 aneurysms that achieved a good performance both in its internal validation and external validation with 249 cases of patients from two different patient cohorts [7, 8]. The model included morphological, patient-related, anatomical, and hemodynamic variables. For characterizing an aneurysm’s hemodynamic environment, patient-specific computational fluid dynamics (CFD) simulations were performed based on 3D images. While the images are fully patient-specific, inflow and outflow boundary conditions for the CFD simulations are typically not available so that flows obtained from other subjects are generally used. For the model [7] we scaled these flows to a patient’s specific area of the vessel where the boundary conditions were imposed using an empirical law derived from PC-MR measurements obtained in healthy subjects. Yet, the patient’s specific inflow could vary from these flow conditions. Furthermore, even if patient-specific measurements are available, the flow conditions change over the course of a day, e.g. due to exercise [21], which is not taken into account by one-time measurements.
The aim of this study was therefore an assessment of the influence of altered inflow conditions of the CFD simulations on the computed hemodynamics and the development of a strategy for incorporating these flow-dependencies into a multivariate statistical model for rupture prediction that is robust with respect to inflow variabilities. For this purpose, flow variations were divided into inter- and intra-patient variations, of which the range was defined based on flow measurements in patients and healthy subjects [10, 11, 21].
Methods
Patient and image data
For this study, cross-sectional data of 1,820 cerebral aneurysms (543 ruptured) in 1,245 patients were used. Data included patient information as well as three-dimensional rotational angiography (3DRA) images of the cerebral vasculature. Consistent with our previous studies, data of 1571 aneurysms, which had been obtained from hospitals located mainly in the USA, were used for model training (a subset of the data used in [7]) and data of 249 aneurysms of two European hospitals for model evaluation (see [8] for details). An overview of both patient populations is given in Tab. 1.
Table 1.
Description of patient populations of data used for model training and evaluation
| Training data | Test data | ||
|---|---|---|---|
| Number of patients | 1,042 | 203 | |
| Gender | 790 F, 252 M | 144 F, 59 M | |
| Age (mean ± sd) | 56.26±13.78 | 54.68±13.61 | |
| Number of aneurysms (ruptured/unruptured) | 1571 (477 R, 1094 U) | 249 (66 R, 183 U) | |
| Patients with multiple aneurysms | 327 | 35 | |
| Distribution by location | ACA | 54 (3.44%) 20R/34U | 5 (2.00%) 2R/3U |
| ACOM | 214 (13.62%) 140R/74U | 45 (18.07%) 23R/22U | |
| BA | 104 (0.07%) 35R/69U | 14 (5.62%) 7R/7U | |
| ICA | 612 (38.96%) 61R/551U | 77 (30.92%) 5R/72U | |
| MCA | 304 (19.35%) 82R/222U | 71 (28.51%) 14R/57U | |
| PCOM | 247 (15.72%) 123R/124U | 33 (13.25%) 14R/57U | |
| VA | 36 (2.29%) 16R/20U | 4 (1.61%) 1R/3U | |
Flow data
To define a range of inflow boundary conditions, we used data from flow measurements in patients and healthy volunteers. For the internal carotid artery (ICA), we used Doppler ultrasound data of measurements in 136 older patients (patients without cerebral aneurysms) from Durka et al. [10] and 2D cine phase-contrast (PC) magnet resonance imaging (MRI) data of 17 healthy volunteers from Ford et al. [11] (see Fig. 1, left). To these data, we fitted a curve describing the area (A) – flow (Q) relationship with Q=kAn, resulting in values of kICA=14.90 and nICA=0.85. Based on this mean flow, next, a possible “inter-patient” range was defined by adding and subtracting a standard-deviation (also based on a fit) to this mean flow. The “inter-patient” mean flow and defined range relative to the ICA’s cross-sectional area are shown in Fig. 1 by solid and dotted lines, respectively.
Fig. 1.

Flow measurement data obtained from Durka et al. [10] and Ford et al. [11] for the ICA (left) and from Ford et al. [11] for the VA (right). The solid line represents the flow-area relationship fitted to the data. The dotted lines depict the defined range for inter-patient variations
For the vertebral artery (VA), we used the PC-MRI data of Ford et al. [11] measured in VAs of the same 17 subjects (see Fig. 1, right). As for the ICA, we fitted a flow-area relationship resulting in values of kVA=31.96 and nVA=1.64. The range was then chosen by adding and subtracting a percentage based on the mean and standard deviations for the measured flows reported in [11] to/from the fitted mean flow1 (dotted lines in Fig. 1, right).
Hemodynamic modeling
For characterizing an aneurysm’s hemodynamic environment, steady-state CFD simulations were performed since it has previously been shown for several hemodynamic variables that their values averaged over the cardiac cycle (e.g. mean wall shear stress (WSS)) can be approximated using steady-state simulations [16]. For the CFD simulations, the aneurysm and surrounding vasculature were segmented from the 3DRA image with a threshold-based approach. Next, computational meshes with a maximum element size of 0.02 cm were automatically generated for numerically solving the steady incompressible Navier-Stokes equations with an in-house finite element solver. Blood was modeled as a Newtonian fluid with a density of 1.0 g/cm3 and a viscosity of 0.04 Poise. Details of the solver and generation of the computational models can be found in [2, 7].
Inflow boundary conditions were imposed at the ICA for aneurysms located at the anterior circulation, at the VA for posterior circulation aneurysms, and at more distal vessels if the ICA or VA were not visible in the 3DRA image. For defining the inflow rate, we first selected a range of possible flow rates depending on the inflow vessel cross-sectional area based on flow measurements in human subjects described above (“inter-patient range”). From such defined area-dependent inter-patient flow ranges, three flow rates were selected (mean, minimum, and maximum values, see Fig. 1 in the Online Suppl. Material for examples). Next, for each of these three “baseline”-flows, an intra-patient flow range was specified. Based on measurements of Sato et al. [21], the flow rate in the ICA increases to up to 18.4% for a medium to high level of exercise, for the VA, the increase was reported with 39.5%. Thus for each baseline-flow, two additional flow rates were selected based on an increase of 9.2% and 18.4% (ICA) and 18.75% and 39.5% (VA). Fig. 2 illustrates the resulting nine flow conditions: three baseline-flows resulting from the inter-patient variations flow rate and for each of them two additional flow rates given by changes of the blood flow in the ICA/VA within the patient (due to exercise).
Fig. 2.

Schematic illustrations of flow variables defined for each hemodynamic parameter. Based on the nine CFD simulations for nine different inflow boundary conditions (blue dots), “mean responses” were defined as the mean of the slopes m1,m2,m3 of the three fitted lines to capture the response of the hemodynamic parameter to intra-patient flow variations. To characterize the deviation from a perfectly linear flow-parameter relationship over the whole range of inter- and intra-patient flows, R2 of a linear fit to the nine points (light green line) was computed. For the flow-dependent hemodynamic parameters (for models B), the baseline values from each of the three inter-patient variations were used
For imposing boundary conditions at arteries other than the ICA or VA, the area of the ICA (or VA) was estimated to apply the area-flow relationships described above, before imposing a certain percentage of the ICA-/VA-flow as inflows for the selected artery.
Outlet boundary conditions were imposed as pressure and flow outlets, where the flows were based on flow division related to the area of the outlets by a power law.
Definition of hemodynamic parameters
Based on the computed flow fields for each of the nine CFD simulations, 17 hemodynamic parameters were computed to characterize the flows in terms of complexity, surface forces, and flow concentration. Tab. 2 lists the 17 parameters, details can be found in [7] and the references therein. For each hemodynamic parameter, we defined three types of variables illustrated in Fig. 2: First, we considered the three baseline values as one flow-dependent variable. Second, we were interested in capturing the “response” of a hemodynamic parameter for intra-patient flow variations. For this purpose, we fitted linear models to the three computed “intra-patient” flow values and then calculated the average of the three fitted slopes (m1, m2, m3 in Fig. 2) as the “mean response”. Finally, to characterize the deviation from a perfectly linear flow-parameter relationship over the whole range of inter- and intra-patient flows, R2 of a linear fit to the nine points (light green line in Fig. 2) was computed and considered as the third type of hemodynamic variable (“response linearity”). For a perfectly linear relation, R2 would take a value of one since a linear line could be fitted without any errors to the flow-parameter data, whereas for nonlinear relations, R2 would be less than one.
Table 2.
Definitions of variables included in the models and coefficients for the fitted flow-independent model (model A). The column “response” refers for the hemodynamic to the type of response-variable (see Fig. 2)
| Variable | Type | Definition | Response | Coefficient |
|---|---|---|---|---|
| age | Patient | Patient age | / | −0.0180 |
| sex.F | Patient | Female patient | / | −0.1869 |
| sex.M | Patient | Male patient | / | 0.1869 |
| Avol | Shape | Aneurysm volume | / | 0 |
| Asize | Shape | Aneurysm size = max. distance between any two points on the aneurysm surface | / | 0 |
| Aarea | Shape | Aneurysm area | / | 0 |
| Nsize | Shape | Max. distance between any two points on the neck surface | / | 0 |
| Narea | Shape | Area of the neck surface | / | −0.4993 |
| depth | Shape | / | 0 | |
| AR | Shape | Aspect ratio = aneurysm depth/neck diameter | / | 0 |
| Aheight | Shape | Max. normal distance of all points on aneurysm dome from aneurysm neck | / | 0 |
| Awidth | Shape | Max. diameter of aneurysm slices parallel to aneurysm neck | / | −1.1558 |
| HWR | Shape | Height to width ratio = aneurysm height/aneurysm width | / | 0.3583 |
| Ndiam | Shape | Equivalent diameter of neck = 4*area/perimeter | / | 0 |
| Aspect | Shape | Aspect ratio 2 = aneurysm height/neck diameter | / | 0 |
| BF | Shape | Bottle neck factor = aneurysm width/neck diameter | / | 0 |
| BL | Shape | Bulge location = Distance of plane with largest diameter from neck/height | / | 0.1624 |
| Vdiam | Shape | Vessel diameter: diameter of nearest vessel from aneurysm neck | / | −1.714 |
| SizeR | Shape | Size ratio = aneurysm size/vessel diameter | / | 0 |
| VOR | Shape | Volume to ostium ratio = Aneurysm volume/Area of neck | / | −0.0841 |
| CR | Shape | Convexity ratio = aneurysm volume/volume of aneurysm’s convex hull | / | 0 |
| IPR | Shape | Isoperimetric ratio | / | 0 |
| EI | Shape | Ellipticity inde | / | 0 |
| NSI | Shape | Non-sphericity index | / | 5.4401 |
| GAA | Shape | Area weighted average of Gaussian aneurysm surface curvature | / | −0.0050 |
| MAA | Shape | Area weighted average of mean curvature | / | 0 |
| GLN | Shape | L2-Norm of Gaussian curvature | / | 0 |
| MLN | Shape | L2-Norm of mean aneurysm surface curvature | / | 6.3289 |
| ICI | Hemod. | Inflow concentration index | Linearity | −0.0068 |
| Mean | 0.2211 | |||
| Q | Hemod. | Mean inflow rate into aneurysm | Linearity | −1.0297 |
| Mean | 0 | |||
| KE | Hemod. | Mean kinetic energy | Linearity | 0 |
| Mean | 0.0004 | |||
| SR | Hemod. | Mean shear rate | Linearity | 0 |
| Mean | 0 | |||
| VE | Hemod. | Mean velocity | Linearity | 0 |
| Mean | 0 | |||
| VO | Hemod. | Mean vorticity | Linearity | 0 |
| Mean | 0 | |||
| VD | Hemod. | Mean viscous dissipation | Linearity | 0 |
| Mean | 0 | |||
| WSSmax | Hemod. | Maximum wall shear stress | Linearity | 0 |
| Mean | 0 | |||
| WSSmin | Hemod. | Minimum wall shear stress | Linearity | −0.2260 |
| Mean | 0 | |||
| WSSmean | Hemod. | Mean wall shear stress | Linearity | 0 |
| Mean | 0 | |||
| LSA | Hemod. | Low shear area | Linearity | −0.3474 |
| Mean | 0 | |||
| SCI | Hemod. | Shear concentration index | Linearity | −0.1698 |
| Mean | 0 | |||
| WSSves | Hemod. | Mean wall shear stress in parent vessel | Linearity | 13.7839 |
| Mean | 0.0056 | |||
| WSSnorm | Hemod. | Normalized WSS = WSSmean/WSSves | Linearity | 0 |
| Mean | 0 | |||
| MWSSnorm | Hemod. | Maximum normalized WSS = WSSmax/WSSves | Linearity | −0.0165 |
| Mean | 0.0104 | |||
| corelen | Hemod. | Vortex core line length (characterizes flow complexity) | Linearity | 0.1294 |
| Mean | 0 | |||
| Vmax | Hemod. | Peak velocity | Linearity | 0 |
| Mean | 0.0010 | |||
| position.ACA | Location | Anterior cerebral artery | / | 0.3429 |
| position.ACOM | Location | Anterior communicating artery | / | 1.2983 |
| position.BA-DIST-PROX | Location | Basilar artery other than tip | / | −0.1379 |
| position.BA-TIP | Location | Tip of basilar artery | / | 0.4223 |
| position.ICA-ACHOR | Location | Internal carotid artery - anterior choroidal | / | −0.3199 |
| position.ICA-BIF | Location | Internal carotid artery bifurcation | / | −0.3582 |
| position.ICA-CAV | Location | Cavernous internal carotid artery | / | −1.1614 |
| position.ICA-OPH | Location | Internal carotid artery - ophthalmic | / | −0.7665 |
| position.ICA-SHYP | Location | Superior hypophyseal segment internal carotid artery | / | −0.1910 |
| position.MCA-BIF | Location | Middle cerebral artery bifurcation | / | 0.1154 |
| position.MCA-DIST-PROX | Location | Middle cerebral artery other than bifurcation | / | −0.8805 |
| position.PCOM | Location | Posterior communicating artery | / | 0.9078 |
| position.VA | Location | Vertebral artery | / | 0.7287 |
Statistical analysis and modeling
First, we assessed the changes of hemodynamic variables for the three different (baseline) flow conditions by a paired Wilcoxon test using the data of all 1,820 aneurysms.
Next, we aimed at developing statistical models for rupture prediction including morphological, patient-related and anatomical information as well as hemodynamic parameters taking the variations due to differences in flow-conditions into account. Morphological parameters were obtained based on automated shape characterizations of each aneurysm (see [7] and references therein) and are shown in Tab. 2. Furthermore, we included patient gender and age as well as aneurysm location in the cerebral vasculature as features.
To incorporate the flow variations of the hemodynamic parameters into the models, we implemented two alternative approaches. First, we trained a model that captured the response of the parameters (by including the “mean response” and “linearity” variables) and thus were by-definition flow-independent (model A, all included variables are shown in Tab. 2). Second, we trained models including the flow-dependent hemodynamic baseline variables randomly selecting the patient’s flow conditions. The second approach was repeated 120 times so that in total 120 flow-dependent models were trained (models B).
All the models were trained on the data of the 1,571 training aneurysms using logistic group lasso regression [15], where the regularization parameter was selected based on ten-fold cross-validation. Lasso regression has the advantage of allowing for variable selection since – depending on the magnitude of the tuning parameter – coefficients of certain variables are set to zero so that these variables drop out of the model.
Model evaluation
All the models were evaluated in terms of area under the receiver operating characteristic curve (AUC) when applying the models to the 249 test cases. For models B, the flow condition in the test data was again randomly chosen by patient. Confidence intervals of the AUCs were determined based on the asymptotically exact method of DeLong et al. [5] implemented in the pROC R-package [19].
We further compared the predicted probabilities and rupture status classification for the 120 fitted models B when holding the inflow constant (medium inflow rate) as well as for one representative model of models B with varied inflow boundary conditions. For classification of an aneurysm as ruptured, three different probability thresholds of 0.3, 0.5, and 0.7 were applied.
All statistical analyses were performed with code written in the R-language [17].
Results
All hemodynamic variables changed significantly for the different flow conditions (p<0.001 for all variables). As expected, variables that increased in value for increasing inflows included inflow into the aneurysm, inflow concentration, kinetic energy, shear rate, mean and maximum velocity, viscous dissipation, vorticity, vortex core line length (corelen) and all wall shear stress parameters except for the low shear area (LSA), which significantly decreased for increasing flows. Fig. 3 shows the boxplots of the values for the different flow conditions for four variables as examples. The mean values for all variables for the different flow conditions are shown in Tab. 1 in the Online Suppl. Material.
Fig. 3.

Boxplots for four selected hemodynamic parameters for varying (inter-patient) flow conditions. For the vortex core line length (corelen) the values are shown in cm, for the mean velocity (VE) in cm/s
The model based on hemodynamic response variables (i.e. independent from inflow boundary conditions choice) combined with morphological, patient-related and aneurysm information (model A) achieved an AUC of 0.8182 in the test data (CI [0.7607 – 0.8756]). For the 120 fitted models based on repeated random selection of the inflow condition (flow-dependent model B) and evaluated with randomly picking inflow conditions in the test data, the mean AUC was similar with 0.8174 (standard deviation of 0.0045). The performances of the two models were slightly reduced compared to their performance in the training data, where they had AUCs of 0.8536, CI [0.8328 – 0.8743], for model A and 0.8515 ± 0.0021 for model B.
Variables that were retained in the process of model fitting for model A were patient age and gender, aneurysm location, as well as nine morphological variables, nine hemodynamic parameters characterizing the behavior of the response in terms of deviation from a perfectly linear change, and five mean response hemodynamic variables (see Tab. 2). For the 120 variations of model B, the variables that were most frequently retained (included in >=95 % of the models) were patient age and gender, aneurysm location, aneurysm neck area, width, height-to-width ratio, bulge-location, parent vessel diameter, volume-toostium ratio, non-sphericity index, Gaussian and mean surface curvatures, as well as the three hemodynamic parameters maximum velocity, LSA, and inflow concentration.
When comparing the predictions of the 120 models B for the test data and medium inflow boundary conditions, the maximum difference of probabilities between any two of the 120 models ranged in the test data between 0.01 (probabilities of 0.018 and 0.0313 for that case) and 0.26 (probabilities of 0.091 and 0.349). The average range was 0.08±0.05. Fig. 4 shows the ranges of predicted probabilities for all aneurysms from the test data. The majority of the cases (95% confidence interval (CI)) had a range of predicted probabilities of < 0.19. Boxplots of predicted probabilities for the different models as well as different inflow boundary conditions of the two cases with the smallest and largest change in predicted probabilities, respectively, are shown in Fig. 5. In the training data, the average range for the different models was similar (0.08±0.05). While in the most extreme case, the probabilities ranged between 0.002 and 0.69, for the majority of the training cases (95% CI), the range in predicted probabilities was, similar to the test data, <0.2. Figs. 3 and 4 in the Suppl. Material show the ranges of predicted probabilities as well as boxplots of probabilities for the two training cases with largest and smallest changes in probabilities for the different models.
Fig. 4.

Mid points vs. 0.5 x length of intervals of predicted probabilities from models B for all cases from the test data (interval range = value on x-axis ± value on y-axis). The solid, dashed, and dotted lines indicate the 0.9, 0.95, and 0.99 confidence interval (CI) of half of the interval length, respectively. For most of the test cases (95 % CI), the range of predicted probabilities was < 0.19
Fig. 5.

Boxplots of the predicted probabilities from models B for different flow conditions for two example cases from the test data with minimum (left) and maximum (right) ranges of predicted probabilities for the 120 models B. The flows of the two cases are illustrated in Fig. 7 (smallest range, case b, unruptured), and Fig. 2 in the Online Suppl. Material (largest range, case e, unruptured)
When considering the minimum and maximum predicted probability of the different models for each case, the predicted rupture status based on classification thresholds of 0.3, 0.5, and 0.7, changed for 28 (11.24 %), 25 (10.04 %), and 14 (5.62%) test cases (see Tab. 3).
Table 3.
Number of cases in test data with changes in predicted rupture status based on the two different models B with largest differences in predicted probabilities (left column) as well as low vs. high inflows for a fixed model B (right column)
| Threshold | Number of cases w/changed prediction (%) | |
|---|---|---|
| Different models (flow fixed) | Different flows (model fixed) | |
| 0.3 | 28 (11.24) | 12 (4.82) |
| 0.5 | 25 (10.04) | 10 (4.02) |
| 0.7 | 14 (5.62) | 2 (0.8) |
With respect to the influence of the boundary conditions on the predicted probabilities, the mean and maximum change for low vs. high inflows (when selecting one of the 120 models for this analysis), were 0.02±0.02 and 0.09, respectively. For thresholds of 0.3, 0.5, and 0.7, the predictions changed for 12 (4.82%), 10 (4.02%), and 2 (0.8%) cases depending on the inflow boundary condition (see Tab. 3).
Discussion
A common critique of aneurysm risk assessment studies based on hemodynamics is the use of boundary conditions for the CFD simulations that are not patient-specific. Our results show that although – as one would expect – the hemodynamic parameters change significantly for altered flow conditions, the predictions of a multivariate model are overall accurate and comparable independent of the specific flow condition used for model training or model evaluation. Furthermore, a similarly good predictive performance can be achieved when using flow-independent hemodynamic variables that characterize the response of the variable with respect to altered flow conditions due to normal diurnal changes in a patient’s flows.
Hemodynamic parameters change with inflow conditions
We found that all hemodynamic parameters changed significantly for altered inflow rates (within the inter-subject variability range). Previously, Morales et al. [16] found an increase of aneurysm mean and maximum wall shear stress as well as pressure for increasing flow rates for unsteady CFD simulations, which is consistent with our results. Whereas in [16] only the effect of inflow rate was assessed while keeping the inflow wave form constant, other studies have evaluated the influence of wave form variations and found significant changes of magnitudes of oscillatory shear index (OSI) [20, 24]. Since we performed steady simulations neglecting the pulsatile character of blood flow, assessment the influence of flow waveforms on the computed parameters was not part of this study.
To define possible flow ranges for each CFD simulation, we used ranges of patient data taken from the literature. For imposing boundary conditions at the ICA, the majority of flow data were obtained from older patients (mean age of 73 ± 13 years) [10]. Thus, for younger, healthy subjects, different flow-area relationships might have been observed. At the same time, measurements from an older patient cohort are likely more representative than data from younger subjects for aneurysm patients (with mean ages of 55 and 56 years in our two cohorts). With respect to intra-patient flow variations, we used reported data for flow measurements under exercise. In practice, a patient’s variation of cerebral blood flow during the day is more complex and also influenced by the cerebral autoregulation. While our model of inter- and intra-patient flow variations is thus based on simplifications, it provides an approach for addressing the problem of uncertainty in inflow boundary conditions for CFD simulations and the resulting computed hemodynamics.
Models that are robust with respect to inflow conditions achieve good predictive performance
The two trained models were able to discriminate well between ruptured and unruptured aneurysms with (mean) AUCs of 0.82 for both the flow-dependent “random” and flow-independent “response” model. The performance of these two models was thus similar to the one of a previously developed rupture probability model, where the hemodynamic parameters had been obtained by unsteady CFD simulations for one fixed inflow condition (although scaled with respect to the area of the inlet vessel) [7]. Despite a similar overall performance of the three models, the predictions for a single aneurysm could vary for each of them. Therefore, we also compared the discriminatory abilities of the three models for each aneurysm by computing an “individual AUC” (iAUC) for each case. The iAUC was defined for ruptured aneurysms as the relative number of unruptured aneurysms that had a lower assigned probability of being ruptured than the considered ruptured aneurysm and vice-versa. Such a measure is independent of a specific threshold for classification of an aneurysm as ruptured or unruptured. Q-Q plots of the distributions for each of the iAUCs were largely similar between model A and B and the previously trained model [7] (model C). Quantiles in the middle-upper range were slightly different between the compared distributions (for identical distributions, all points would lie on the 45° line, see Fig. 6). Still, overall, the Q-Q plots indicated a comparable discriminatory ability of the models for each aneurysm.The models presented in this study did not include variables characterizing the time-dependent behavior of the aneurysmal flow (e.g. oscillatory shear index). Our findings suggest that missing information by omitting these parameters can be compensated by the other variables, resulting in a similar performance.
Fig. 6.

Q-Q plots for comparisons of distributions of iAUCs in test data of model A vs. model C and model B vs. model C (for model B, one of the 120 fitted models was used for this illustration). For identical distributions, all circles would lie on the 45° line
At the same time, the confidence intervals for the AUCs of the models were relatively large, indicating that more data might be needed for a more precise estimation of the models’ performance.
Aneurysms hemodynamics, geometry, and location contribute to the overall rupture risk
An increased aneurysm rupture risk has previously been associated with both a less regular aneurysm shape and an adverse hemodynamic environment described by higher and more complex flows [6, 9]. Figs. 7 and 8 illustrate these associations with four aneurysms and relate them to the predictions based on the three models (model A, B, and the previously developed model [7], model C). The selected inflow boundary conditions for the four cases are shown in Fig. 1 in the Suppl. Material.
Fig. 7.
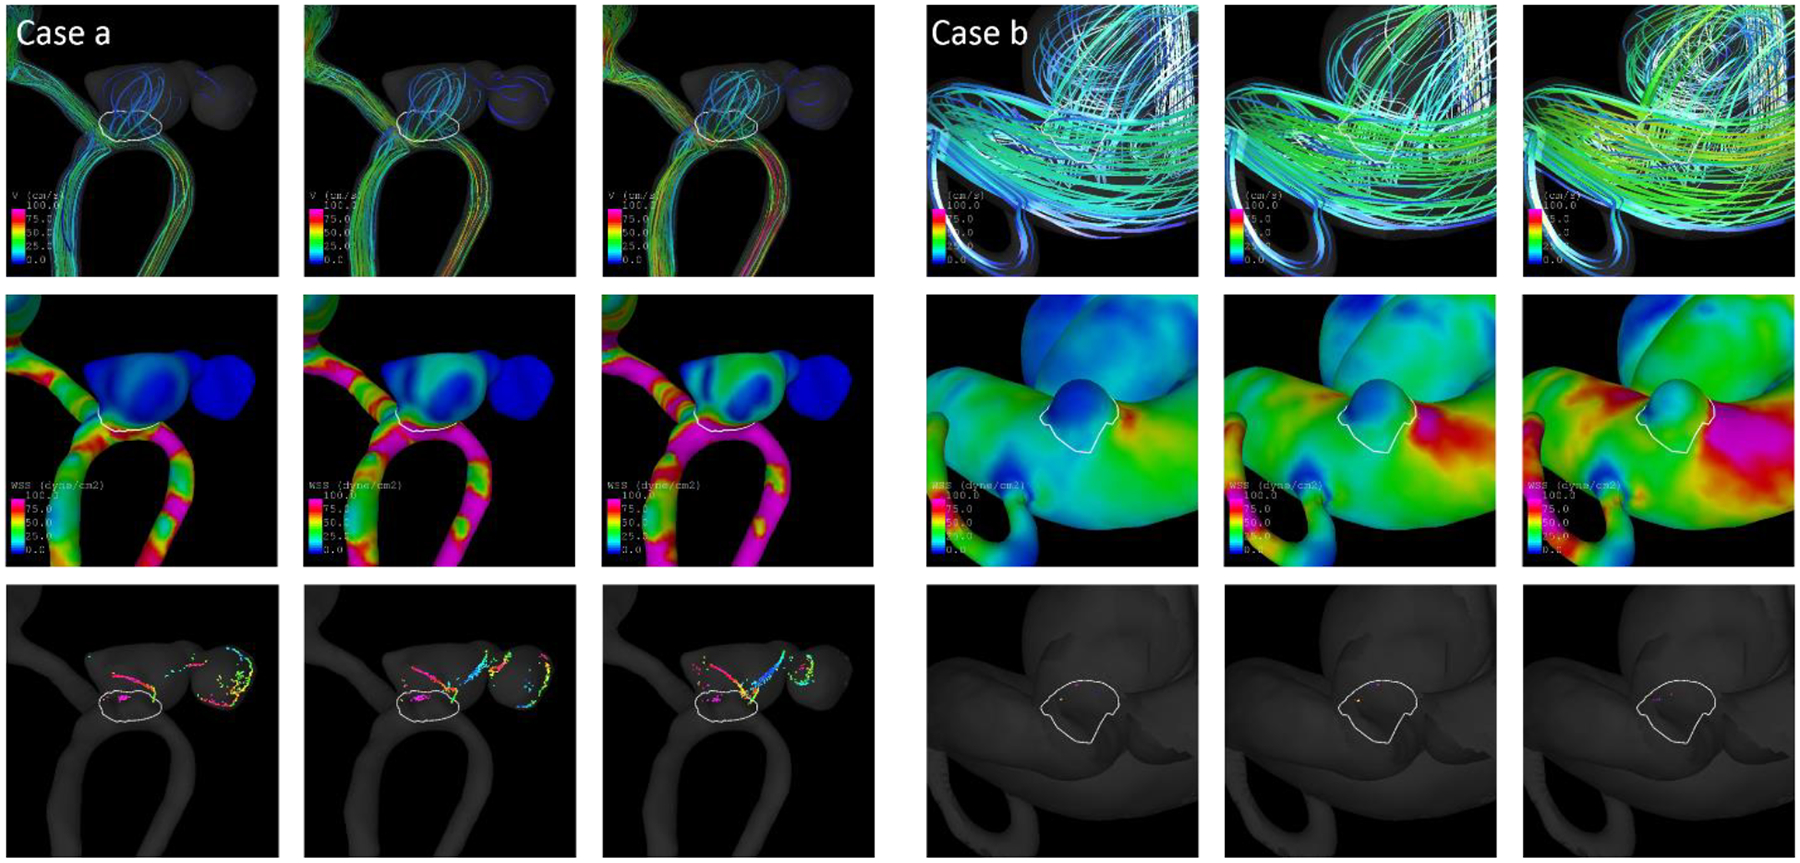
Streamlines (top), WSS distribution (middle), and vortex core lines (bottom) for low, medium, and high inflow boundary conditions (from left to right) for a ruptured (left) and an unruptured aneurysm (right) that were correctly classified by the models
Fig. 8.

Streamlines (top), WSS distribution (middle), and vortex core lines (bottom for low, medium, and high inflow boundary conditions (from left to right) for a ruptured (left) and an unruptured aneurysm (right) that were incorrectly classified by the models
Fig. 7 shows two example aneurysms from the test data for which the predicted probabilities were consistent with the actual rupture status. The aneurysm on the left (case a) is a ruptured anterior communicating artery (ACOM) aneurysm. Based on both model A and C, it had a predicted probability of being ruptured of 0.91. For models B, the predicted probabilities were 0.92 ± 0.01, 0.92 ± 0.01, and 0.92 ± 0.01 when applying the model to the low, medium, and high flow data from that case, respectively (see Tab. 4). The streamlines, wall shear stress distribution, and vortex core lines show an increasing and more complex flow for increasing inflows (from left to right). Despite these changes, the predictions of all models were similar and consistent with the rupture status. To assess the contributions of hemodynamics and geometry to the rupture risk separately, models using only hemodynamic (flow-dependent) and only geometric variables were fitted based on the training data and evaluated on the four illustrative test cases. For the ACOM aneurysm, the probabilities of the hemodynamics-only model ranged between 0.33 and 0.49 (depending on which of the 120 models was evaluated and for which of the three flow conditions). The geometry-only model assigned a probability of 0.89. Thus, for this case geometry seemed to contribute more to the high rupture risk than the relatively low and simple flows as shown by the WSS distribution and core lines.
Table 4.
Characteristics of cases illustrated in Figs. 7 and 8. ProbA, ProbB, and ProbC refer to the assigned probabilities by model A, B (when applied to the aneurysm’s low, medium, and high flow data), and C. Asize=aneurysm size
| Case | Location | Rupture Status | Asize | ProbA | ProbB | ProbC | ||
|---|---|---|---|---|---|---|---|---|
| Low | Medium | High | ||||||
| a | ACOM | R | 1.0383 | 0.9076 | 0.9151 ± 0.0141 | 0.9162 ± 0.0132 | 0.9224 ± 0.0127 | 0.9121 |
| b | ICA-OPH | U | 0.2510 | 0.0204 | 0.0229 ± 0.0029 | 0.0240 ± 0.0029 | 0.0251 ± 0.0030 | 0.0218 |
| c | MCA-BIF | R | 1.4913 | 0.1402 | 0.1138 ± 0.0252 | 0.1267 ± 0.0260 | 0.1511 ± 0.0253 | 0.1034 |
| d | PCOM | U | 0.9193 | 0.8021 | 0.8052 ±0.0166 | 0.8263 ± 0.0171 | 0.8476 ± 0.0203 | 0.8050 |
For case b, an unruptured ICA-ophthalmic aneurysm, the assigned probabilities were less than 0.03 for all models A, B, and C and the geometry-only model, indicating a low-risk for this aneurysm, which was consistent with the rupture status. The maximum probability for the hemodynamic model was 0.18, which was largely higher, but still suggested a low risk. The aneurysm had a very simple, spherical shape, and overall low flows (except for a region near the neck), which explains the low predicted probabilities.
Fig. 8 shows two cases for which the predicted probabilities were not in agreement with the rupture status. Case c was a relatively large middle cerebral artery (MCA)-bifurcation aneurysm with a simple shape and low predicted probabilities for models A, B, and C (<0.16) and the geometry-only model (0.08) despite being ruptured. Hence, this case was misclassified by the models, potentially related to the relatively simple geometry and low-risk location. For the hemodynamic-only models, the probabilities ranged between 0.31 and 0.62, with the highest probability when applying the model to the aneurysm’s high flow data. Consistently, the high-flow scenario showed relatively complex flows with many vortices and large core lines. Hence in this case, the hemodynamic-only model predicted the rupture status more accurately than the other ones including geometric, location, and patient-related information.
The posterior communicating artery (PCOM) aneurysm, case d, demonstrated an interesting case with high and complex flows as well as an irregular shape, but an unruptured rupture status. In agreement with the hemodynamic and morphological characteristics, all models assigned high predicted probabilities of >0.8, the geometry-only model a probability of 0.81, and for the hemodynamic-only model probabilities between 0.42 and 0.70. The rupture-like characteristics and high predicted probabilities thus suggest that case d was a high-risk aneurysm and potentially close to the event of rupture. Unfortunately, follow-up data of the patient were not available to assess this assumption.
Overall, the four examples show that for the evaluation of an aneurysm’s rupture risk, it is important to take different characteristics into account. At the same time, it is important to note that the geometry-only and hemodynamic-only model had a significantly lower performance compared to model A (AUCs of 0.75, CI [0.69 – 0.82], and 0.7126 ± 0.0113 vs. 0.82, p=0.007 for geometry-only vs. model A). Both “submodels” thus yield important information about the contribution of hemodynamics and morphology to the rupture risk, but in the end, these separate predictions are less precise than the overall model so that they should not been used by themselves for rupture prediction. On the other hand, models B performed well independent of the selected flow condition for the test case, indicating that for rupture prediction the selected flow conditions for the CFD simulations are not critical for an accurate assessment in terms of predicted probabilities.
Clinical implications
Our results show that for incorporating inter- and intra-patient cerebral flow-variations into multivariate prediction models including hemodynamic variables for aneurysm rupture (status) prediction, two options exist that yield good performances. First, variables that capture the changes of hemodynamics for intra-patient flow variations (“mean response variables”) and the overall behavior for intra- and inter-patient variations combined (“linearity variables”) can be included into the model, which is then by definition flow independent. The flow-independence is a major advantage of this model, resulting in a single predicted probability that – based on the model’s performance in the external evaluation of this study – accurately reflects the aneurysm rupture status. On the other hand, this model requires nine CFD simulations for each aneurysm and includes variables that are less-intuitive in their interpretation, which could be disadvantageous for an application in the clinic.
The second approach includes random selection of flow-conditions (within the physiological range) by patient for model training. Our results suggest that such a model achieves a good predictive performance independent of the particular flow that is used for applying the model to a new case. Importantly, we found that the predicted probabilities did not change largely for the different inflow boundary conditions (on average the difference between the probabilities based on high and low flow conditions was 0.02). Furthermore, for less than 5% of all test cases, the predicted rupture status changed based on the flow condition for all three thresholds that were applied.
In practice, this implies, first, that only one CFD simulation is needed (although more can be performed and evaluated to get an idea of the robustness of the predictions) and, second, patient-specific flow-conditions can be applied – if available – for using the model. The latter has the advantage that if a physician is interested in the patient’s actual hemodynamics and the patient’s flow has been measured, these data can be used for the CFD simulations and also for applying the statistical model. Whether such predictions could also be more precise in the end needs to be assessed in future. Furthermore, if CFDdata are already available, the model based on randomly selected flow conditions is applicable as long as the inflow boundary conditions have been applied within the physiological range.
When using models B for risk assessment, the predicted probabilities can change depending on which of the repeatedly fitted models is used as well as on the applied inflow. To address this aspect, one could use all 120 models and all three flow conditions to compute the 360 predicted probabilities and, e.g. assess these probabilities based on boxplots as shown in Fig. 5 to get a more complete evaluation of the rupture risk. At the same time, our results indicate that also just considering one flow condition and mean predicted probabilities from the models might be sufficient given that the predicted rupture statuses change only for a few cases even when comparing the most extreme predictions of all models, and overall similar predicted probabilities for the different models and flow conditions.
In the end, both approaches for the statistical models achieved a similar performance. Which of the two is more suitable in a clinical setting could depend on the physician’s preference and available resources and data (e.g. patient-specific flow measurements).
The previously developed model based on unsteady CFD simulations achieved a good performance in the external data [8]. However, the effect of varying boundary conditions was not assessed when evaluating the model. Since the model was based on time-variant inflows, also the impact of the inflow waveform on the computed hemodynamics and model predictions should be assessed, which is planned for future work. Models based on time-variant hemodynamics capture additional information about the aneurysm hemodynamics, which could be advantageous for rupture risk assessment. At the same time, our results suggest that neglecting the time-dependent flow variations resulting from the cardiac cycle does not reduce the predictive performance of the model. For an application in the clinic such time-independent (steady) simulations do have the advantages of a largely reduced computational time (the nine CFD simulations for each of the 1,820 cases for this study were run in approx. three days in total).
The four exemplary cases presented in Figs. 7 and 8 show that considering a combination of hemodynamics and morphological information is important for aneurysm rupture assessment. Consistent with the importance of a combination of variables from different domains, all the fitted models (except for geometry-/hemodynamics-only models) retained variables from all of them. In practice, this modelbased risk prediction as well as the assessment of hemodynamics/morphology could also be combined with a similarity-based approach for identification of aneurysms with similar hemodynamic, morphological, and anatomical characteristics for a new case (as described in [8]).
When considering the presented statistical models for aneurysm rupture risk assessment, it is important to keep in mind that these models have been developed using cross-sectional data. They predict the current aneurysm rupture status rather than the future rupture risk. However, based on the assumption that rupture-prone aneurysms resemble those that have already ruptured [7, 25], such a model could also be used for rupture risk assessment. While previous findings support this assumption [4], in the end, an evaluation of the models with longitudinal data is necessary, which is planned for future work. Irrespective of this limitation, our current study shows that – once evaluated or re-trained with longitudinal data – the problem of patient-specific inflow boundary conditions can be addressed for statistical models for aneurysm rupture risk assessment.
Conclusion
Statistical models including hemodynamic variables obtained from CFD simulations for aneurysm rupture prediction can achieve a good predictive performance when incorporating the influence of inter- and intra-patient variations in cerebral blood flow on the characterized hemodynamics into the model. These models can be applied to CFD data independent of the specific inflow boundary conditions resulting – depending on the approach - in similar or flow-independent predicted probabilities. For aneurysm rupture risk assessment, it is important to take different aspects, i.e. hemodynamics, morphology, and aneurysm location into account.
Supplementary Material
Acknowledgements
Part of the data used for evaluation of the models (AneuX data) was collected starting in 2006 in the context of the EU project @neurIST and SystemsX.ch initiative AneuX evaluated by the Swiss National Science Foundation. The data is hosted by the Swiss Bioinformatics Institute in the context of the Aneurysm Data Bank. The authors would like to thank Sandrine Morel, Vitor Mendes Pereira, Daniel Rüfenacht, Karl Schaller, and Norman Juchler for helping with data collection, cleansing, harmonization, and processing. The authors would further like to acknowledge Michael J. Durka and Anne M. Robertson for providing flow data from ultrasound measurements in patient populations for this study.
Funding This research was supported, in part, by a grant from the National Institutes of Neurological Disorders and Stroke (NIH-NINDS), Grant #R01NS097457. SH and PB were supported by SystemsX.ch project AneuX evaluated by the Swiss National Science Foundation.
Footnotes
The flow range for the VA was defined as , with Qsd and Qmean as reported in [11] and Qmean_fitted the flow fitted based on the relationship Q = 31.96A1.64
Conflict of Interest The authors declare that they have no conflict of interest.
Ethical approval All procedures performed in studies involving human participants were in accordance with the ethical standards of the institutional and/or national research committee and with the 1964 Helsinki declaration and its later amendments or comparable ethical standards. For this type of study formal consent is not required.
References
- 1.Bisbal J, Engelbrecht G, Villa-Uriol M-C, Frangi AF (2011) Prediction of Cerebral Aneurysm Rupture Using Hemodynamic, Morphologic and Clinical Features: A Data Mining Approach In: Hameurlain A, Liddle SW, Schewe K-D, Zhou X (eds) Database and Expert Systems Applications. Springer Berlin Heidelberg, Berlin, Heidelberg, pp 59–73 [Google Scholar]
- 2.Cebral JR, Castro MA, Appanaboyina S, Putman CM, Millan D, Frangi AF (2005) Efficient pipeline for image-based patient-specific analysis of cerebral aneurysm hemodynamics: Technique and sensitivity. IEEE Trans Med Imag 24:457–467 [DOI] [PubMed] [Google Scholar]
- 3.Cebral JR, Raschi M (2013) Suggested connections between risk factors of intracranial aneurysms: a review. Ann Biomed Eng 41:1366–83. doi: 10.1007/s10439-012-0723-0 [DOI] [PMC free article] [PubMed] [Google Scholar]
- 4.Chung BJ, Mut F, Putman C, Hamzei-Sichani F, Brinjikji W, Kallmes DF, Cebral JR (2018) Identification of hostile hemodynamics and geometries of cerebral aneurysms: a case-control study. doi: 10.3174/ajnr.A5764 [DOI] [PMC free article] [PubMed]
- 5.DeLong E, DeLong D, Clarke-Pearson D (1988) Comparing the areas under two or more correlated receiver operating characteristic curves: a nonparametric approach. Biometrics 44:837–845. doi: 10.2307/2531595 [DOI] [PubMed] [Google Scholar]
- 6.Detmer FJ, Chung BJ, Jimenez C, Hamzei-Sichani F, Kallmes D, Putman C, Cebral JR (2019) Associations of hemodynamics, morphology, and patient characteristics with aneurysm rupture stratified by aneurysm location. Neuroradiology 61:275–284. doi: 10.1007/s00234-018-2135-9 [DOI] [PMC free article] [PubMed] [Google Scholar]
- 7.Detmer FJ, Chung BJ, Mut F, Slawski M, Hamzei-Sichani F, Putman C, Jiménez C, Cebral JR (2018) Development and internal validation of an aneurysm rupture probability model based on patient characteristics and aneurysm location, morphology, and hemodynamics. Int J Comput Assist Radiol Surg. doi: 10.1007/s11548-018-1837-0 [DOI] [PMC free article] [PubMed] [Google Scholar]
- 8.Detmer FJ, Fajardo-Jiménez D, Mut F, Juchler N, Hirsch S, Pereira VM, Bijlenga P, Cebral JR (2018) External validation of cerebral aneurysm rupture probability model with data from two patient cohorts. Acta Neurochirurgica 160:2425–2434. doi: 10.1007/s00701-018-3712-8 [DOI] [PMC free article] [PubMed] [Google Scholar]
- 9.Dhar S, Tremmel M, Mocco J, Kim M, Yamamoto J, Siddiqui AH, Hopkins LN, Meng H (2008) Morphology parameters for intracranial aneurysm rupture risk assessment. Neurosurgery 63:185–197 [DOI] [PMC free article] [PubMed] [Google Scholar]
- 10.Durka MJ, Wong IH, Kallmes DF, Pasalic D, Mut F, Jagani M, Blanco PJ, Cebral JR, Robertson AM (2018) A data-driven approach for addressing the lack of flow waveform data in studies of cerebral arterial flow in older adults. Physiological Measurement 39:015006. doi: 10.1088/1361-6579/aa9f46 [DOI] [PMC free article] [PubMed] [Google Scholar]
- 11.Ford MD, Alperin N, Lee SH, Holdsworth DW, Steinman DA (2005) Characterization of volumetric flow rate waveforms in the normal internal carotid and vertebral arteries. Physiol Meas 26:477–488 [DOI] [PubMed] [Google Scholar]
- 12.Gabriel RA, Kim H, Sidney S, McCulloch CE, Singh V, Johnston SC, Ko NU, Achrol AS, Zaroff JG, Young WL (2010) Ten-Year Detection Rate of Brain Arteriovenous Malformations in a Large, Multiethnic, Defined Population. Stroke 41:21–26. doi: 10.1161/STROKEAHA.109.566018 [DOI] [PMC free article] [PubMed] [Google Scholar]
- 13.Juvela S, Poussa K, Lehto H, Porras M (2013) Natural history of unruptured intracranial aneurysms: a long-term follow-up study. Stroke 44:2414–21. doi: 10.1161/strokeaha.113.001838 [DOI] [PubMed] [Google Scholar]
- 14.Kleinloog R, de Mul N, Verweij BH, Post JA, Rinkel GJE, Ruigrok YM (2017) Risk Factors for Intracranial Aneurysm Rupture: A Systematic Review. Neurosurgery. doi: 10.1093/neuros/nyx238 [DOI] [PubMed] [Google Scholar]
- 15.Meier L, Van De Geer S, Bühlmann P (2008) The group lasso for logistic regression: Group Lasso for Logistic Regression. J R Stat Soc Series B Stat Methodol 70:53–71. doi: 10.1111/j.14679868.2007.00627.x [DOI] [Google Scholar]
- 16.Morales HG, Bonnefous O (2015) Unraveling the relationship between arterial flow and intraaneurysmal hemodynamics. J Biomech 48:585–591. doi: 10.1016/j.jbiomech.2015.01.016 [DOI] [PubMed] [Google Scholar]
- 17.R Core Team (2017) R: a language and environment for statistical computing. Version 3.3.3 R Foundation for Statistical Computing, Vienna: https://www.R-project.org/. Accessed July 2019 [Google Scholar]
- 18.Rivero-Arias O, Gray A, Wolstenholme J (2010) Burden of disease and costs of aneurysmal subarachnoid haemorrhage (aSAH) in the United Kingdom. Cost Eff Resour Alloc 8:6. doi: 10.1186/14787547-8-6 [DOI] [PMC free article] [PubMed] [Google Scholar]
- 19.Robin X, Turck N, Hainard A, Tiberti N, Lisacek F, Sanchez J-C, Müller M (2011) pROC: an opensource package for R and S+ to analyze and compare ROC curves. BMC Bioinformatics 12:77. [DOI] [PMC free article] [PubMed] [Google Scholar]
- 20.Sarrami-Foroushani A, Lassila T, Gooya A, Geers AJ, Frangi AF (2016) Uncertainty quantification of wall shear stress in intracranial aneurysms using a data-driven statistical model of systemic blood flow variability. J Biomech 49:3815–3823. doi: 10.1016/j.jbiomech.2016.10.005 [DOI] [PubMed] [Google Scholar]
- 21.Sato K, Sadamoto T (2010) Different blood flow responses to dynamic exercise between internal carotid and vertebral arteries in women. Journal of Applied Physiology 109:864–869. doi: 10.1152/japplphysiol.01359.2009 [DOI] [PubMed] [Google Scholar]
- 22.Wang G, Zhang Z, Ayala C, Dunet DO, Fang J, George MG (2014) Costs of Hospitalization for Stroke Patients Aged 18–64 Years in the United States. J Stroke Cerebrovasc Dis 23:861–868. doi: 10.1016/j.jstrokecerebrovasdis.2013.07.017 [DOI] [PMC free article] [PubMed] [Google Scholar]
- 23.Wiebers DO, Whisnant JP, Huston J, Meissner I, Brown RD, Piepgras DG, Forbes GS, Thielen K, Nichols D, O’Fallon WM, Peacock J, Jaeger L, Kassell NF, Kongable-Beckman GL, Torner JC (2003) Unruptured intracranial aneurysms: natural history, clinical outcome, and risks of surgical and endovascular treatment. Lancet 362:103–10 [DOI] [PubMed] [Google Scholar]
- 24.Xiang J, Siddiqui AH, Meng H (2014) The effect of inlet waveforms on computational hemodynamics of patient-specific intracranial aneurysms. J Biomech 47:3882–3890. doi: 10.1016/j.jbiomech.2014.09.034 [DOI] [PMC free article] [PubMed] [Google Scholar]
- 25.Xiang J, Yu J, Choi H, Dolan Fox JM, Snyder KV, Levy EI, Siddiqui AH, Meng H (2015) Rupture Resemblance Score (RRS): toward risk stratification of unruptured intracranial aneurysms using hemodynamic–morphological discriminants. Journal of NeuroInterventional Surgery 7:490–495. doi: 10.1136/neurintsurg-2014-011218 [DOI] [PMC free article] [PubMed] [Google Scholar]
- 26.Xiang J, Yu J, Snyder KV, Levy EI, Siddiqui AH, Meng H (2016) Hemodynamic-morphological discriminant models for intracranial aneurysm rupture remain stable with increasing sample size. J Neurointerv Surg 8:104–110. doi: 10.1136/neurintsurg-2014-011477 [DOI] [PMC free article] [PubMed] [Google Scholar]
Associated Data
This section collects any data citations, data availability statements, or supplementary materials included in this article.