

Abstract
Weighted burden pathway analysis was applied to whole exome sequence data for 2045 schizophrenic subjects and 2045 controls. Overall, there was a statistically significant excess of pathways with more rare, functional variants in cases than controls. Among the highest ranked were pathways relating to histone modification, as well neuron differentiation and membrane and vesicle function. This bolsters the evidence from previous studies that histone modification pathways may be important in the aetiology of schizophrenia.
Keywords: Schizophrenia, association, pathway analysis, histone modification
Introduction
A previous pathway analysis based on SNP results from GWAS data for schizophrenia, major depression and bipolar disorder implicated neuronal, immune and histone pathways, with histone methylation being the most strongly associated (The Network and Pathway Analysis Subgroup of the Psychiatric Genomics Consortium 2015). In a study of de novo variants in schizophrenia, two unrelated cases were found to have de novo loss of function variants in SETD1A, which encodes for a component of a histone methyltransferase complex, and a subsequent study has discovered further loss of function variants in this gene in subjects with schizophrenia and in subjects with intellectual disability (Takata, Xu et al. 2014; Singh, Kurki et al. 2016).
In previously reported studies, Swedish subjects with schizophrenia and matched controls underwent whole exome sequencing but gene-wise burden tests did not produce any individually significant results for dominant or recessive effects (Purcell, Moran et al. 2014) (Curtis 2015). However, it was reported that there was an excess of variants in particular gene sets including voltage-gated calcium ion channels and the signalling complex formed by the activity-regulated cytoskeleton-associated scaffold protein (ARC) of the postsynaptic density (Purcell, Moran et al. 2014).
The present study aimed to examine a comprehensive set of pathways with no a priori selection in order to determine if any appeared to be enriched for rare, putatively functional variants among cases as opposed to controls.
Methods
The data analysed consisted of whole exome sequence data downloaded from dbGaP for 2545 controls and 2545 cases of schizophrenia from Sweden. This dataset is almost the same as that used previously except that the original study did not include a small number of cases and controls so that the published totals differ slightly (Purcell, Moran et al. 2014). Version hg19 of the reference human genome sequence and RefSeq genes were used to select variants on a gene-wise basis and to annotate them.
A number of quality control processes were applied to exclude some variants from analysis. As described originally (Purcell, Moran et al. 2014), genotypes were called with the Picard/BWA/GATK pipeline which assigns a “PASS” to variants called with a high degree of confidence and which also assigns a genotype quality score to each genotype at an individual level. Variants were excluded if they did not have a PASS in the information field and individual genotype calls were excluded if they had a quality score less than 30. Preliminary analyses revealed that even when these measures had been applied some variants would throw up obviously erroneous results such as having a marked excess of homozygotes in both cases and controls or having implausibly large differences in allele frequency between cases and controls. Such spurious results tended to occur for indels and for variants for which a substantial proportion of genotype calls did not have a high quality score (even after the low scoring genotypes were excluded). Hence it was decided that indel calls were unreliable and attention was restricted to substitutions, to which the following additional quality control measures were applied: variants were excluded if there were more than 100 genotypes missing or of low quality in either cohort or if the heterozygote count was smaller than both homozygote counts in both cohorts.
Weighted burden analyses were carried out as previously described using the SCOREASSOC program (Curtis 2012) (Curtis and UK10K Consortium 2015). Each variant is assigned a weight determined by its rarity and by its predicted functional effect. The rarity weight is allocated using a parabolic function such that very rare variants have a weight of 10 compared with a weight of 1 for common variants with minor allele frequency (MAF) equal to 0.5. Functional weights are assigned arbitrarily so that variant types deemed more likely to have a functional effect are assigned higher weights in an approach similar to that recently suggested for dealing with de novo mutations (Jiang, Han et al. 2015). Stop gain mutations are allocated a weight of 20. Non-synonymous and Kozak sequence variants are assigned a weight of 10. Stop loss, 3’ and 5’ UTR and splice site variants are assigned a weight of 5. Synonymous and intronic variants are assigned a weight of 3. Intergenic variants are assigned a weight of 1. The weight according to rarity is then multiplied by the weight according to function, so that for example an extremely rare stop variant would be assigned an overall weight of 200 while a common intergenic variant would be assigned an overall weight of 1. The previously reported gene-based analyses were applied to two sets of variants, either all variants or else only nonsynonymous or stop variants with MAF<0.1. In order to minimise multiple testing issues, for the pathway analysis reported here only the latter set of variants was used. Among these, the stop variants would be weighted more highly than nonsynonymous variants and very rare variants would be weighted more highly than those which were less rare.
Variants for each gene were input into SCOREASSOC, which sums the overall weights for the variants possessed by each subject to produce a score for that subject. It then performs a t test comparing scores for cases and controls to test whether cases tend to have an excess of rare, functional variants. The result of this weighted burden test is summarised as a signed log p (SLP), which is the logarithm base 10 of the two-tailed p value, given a positive sign if the mean score is higher for cases than controls.
In order to carry out pathway analysis, the 1454 “all GO gene sets, gene symbols” pathways were downloaded from the Molecular Signatures Database at http://www.broadinstitute.org/gsea/msigdb/collections.jsp (Subramanian, Tamayo et al. 2005). For each pathway, the scores for each constituent gene of the pathway as output by SCOREASSOC were summed to produce a total score for each subject for that pathway. Then a t test was performed to compare total scores between cases and controls and the results expressed an SLP. Although the scores were obtained on a gene-wise basis, this approach to pathway analysis, which was proposed in the original SCOREASSOC paper (Curtis 2012), actually considers all variants within the pathway simultaneously rather than using summary statistics from genes and then combining them. This means that the test is not expected to be biased by genes with different sizes or having different numbers of variants and overall the test statistic should follow the asymptotic distribution if the null hypothesis is true and there is no difference in variant burden for the pathway between cases and controls. On the other hand, the pathways are not independent of each other as the same gene can appear in more than one. Thus, although one can specify the probability for the SLP for a particular pathway to exceed a given threshold one cannot state the probability for a certain number of the 1454 pathways to exceed a threshold. The fact that the pathways are not independent means that a Bonferroni correction for a single p value might be conservative whereas using a binomial distribution to assess the significance of an observed number of pathways exceeding a threshold might be anti-conservative.
In order to address this issue, permutation testing was used. An SLP was obtained for each pathway and then an additional 9,999 simulated datasets were obtained by permuting the subject phenotypes and all the SLPs for all pathways were recalculated. Thus, if for example 17 pathways produced an SLP over 2 in the real dataset and 49 of the simulated datasets also yielded 17 or more pathways with an SLP over 2 then one could declare that the real dataset was in the highest 50 out of 10,000 and one could declare that there was an excess of pathways with SLP over 2 with an empirical p value of 50/1000=0.005 (North, Curtis et al. 2002). This approach provided an experiment-wide statistical significance for an excess of pathways in which rare, functional variants were commoner among cases than controls. Carrying out these simulations also confirmed that for each individual pathway the asymptotic p values obtained corresponded very closely with empirical p value for that pathway.
Care was taken to minimise problems related to multiple testing, so that only a single set of pathway definitions was used and only a single method of analysis was applied.
Results
As shown in Figure 1, a Q:Q plot of the SLPs revealed that pathways in which the numbers of variants were higher in controls than in cases, i.e. those with negative SLPs, exactly followed the expected distribution. However for the pathways with positive SLPs the gradient was steeper, suggesting an excess of variants among cases in a large number of pathways.
Figure 1.
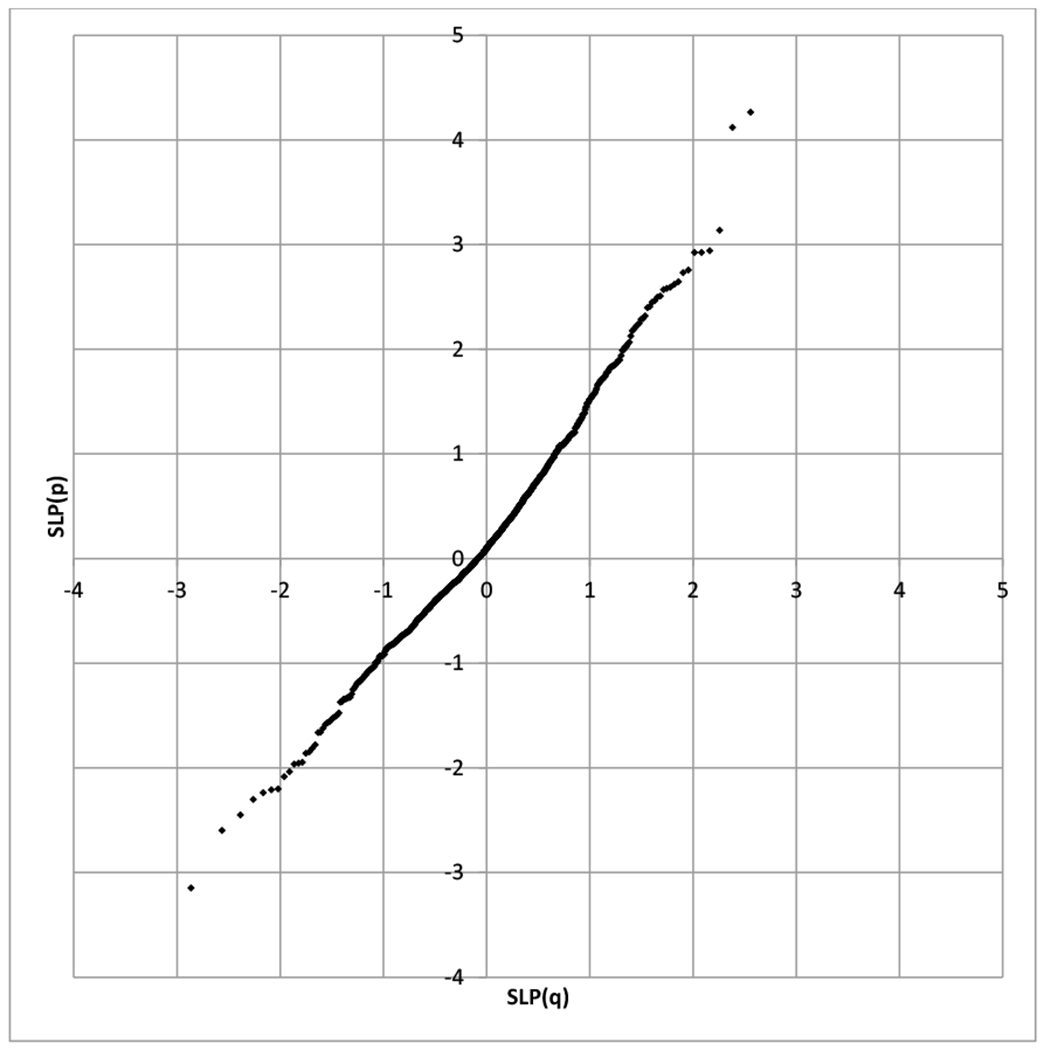
Q:Q plots for SLPs obtained from the pathway analyses compared to values expected under null hypothesis. Positive SLPs indicate an excess of rare, functional variants in SZ cases, negative SLPs indicate an excess in controls.
The 50 pathways with the highest SLPs are shown in Table 1, along with contributing genes having an SLP>1.3 (equivalent to gene-wise p<0.05). 2 pathways have SLP higher than 4, 3 have SLP higher than 3 and 22 have SLP higher than 2. The permutation testing revealed the expected values for these figures to be 0.07, 0.7 and 7.3 with experiment-wide statistical significance of 0.014, 0.16 and 0.03 respectively. Thus, there is overall a significant excess of pathways with high SLPs and it is likely that at least some of the higher ranked pathways indicate a true biological effect.
Table 1.
Table showing the most 50 most highly ranked GO pathways out of 1454 tested. For each pathway is shown the signed log10 p value (SLP) for a weighted burden test which tests for an excess of rare, functional variants in 2045 schizophrenia cases versus 2045 controls. Also shown is a list of all contributing genes individually having SLP>1.3, equivalent to a gene-wise p value of 0.05.
| Pathway name | SLP | Number of genes | Contributing gene (SLP) for genes with gene-wiseSLP>1.3 |
|---|---|---|---|
| CELL CYCLE ARREST | 4.26 | 57 | KAT2B (2.41), PPP2R3B (2.16), EIF4G2 (1.5), TBRG4 (1.35), TP53 (1.6) |
| HETEROCYCLE METABOLIC PROCESS | 4.12 | 27 | COX10 (2.98), ALDH1L1 (1.35) |
| COVALENT CHROMATIN MODIFICATION | 3.14 | 25 | NSD1 (1.86), HELLS (1.88) |
| HISTONE MODIFICATION | 2.94 | 24 | NSD1 (1.86) |
| MEMBRANE ORGANIZATION AND BIOGENESIS | 2.92 | 135 | SNAP23 (1.74), TP53 (1.6), NECAP2 (1.37), ASGR1 (1.89), MSR1 (1.98), AGRN (1.41), SNX1 (2.25), PICALM (1.52) |
| NEGATIVE REGULATION OF TRANSCRIPTION FROM RNA POLYMERASE II PROMOTER | 2.92 | 84 | DNMT1 (2.42), PHF21A (1.42), JAZF1 (1.84), VHL (1.31), NSD1 (1.86), PAWR (1.54) |
| NEGATIVE REGULATION OF CELL CYCLE | 2.76 | 79 | KAT2B (2.41), PPP2R3B (2.16), EIF4G2 (1.5), TBRG4 (1.35), TP53 (1.6) |
| REGULATION OF SECRETION | 2.73 | 40 | NLRP12 (1.55), SRGN (1.48), SNCAIP (1.36) |
| PROTEIN SERINE THREONINE PHOSPHATASE COMPLEX | 2.64 | 10 | PPP2R3B (2.16) |
| PROTEIN N TERMINUS BINDING | 2.62 | 38 | NCOA3 (2.19), TP53 (1.6) |
| NEGATIVE REGULATION OF RNA METABOLIC PROCESS | 2.59 | 132 | PHF21A (1.42), VHL (1.31), NSD1 (1.86), PAWR (1.54), DNMT1 (2.42), JAZF1 (1.84), HELLS (1.88), ZHX3 (1.76) |
| NEGATIVE REGULATION OF TRANSCRIPTION DNA DEPENDENT | 2.58 | 130 | PHF21A (1.42), VHL (1.31), NSD1 (1.86), PAWR (1.54), DNMT1 (2.42), JAZF1 (1.84), HELLS (1.88), ZHX3 (1.76) |
| NEGATIVE REGULATION OF BIOLOGICAL PROCESS | 2.57 | 677 | KAT2B (2.41), ERCC1 (1.5), EIF4G2 (1.5), NOL3 (1.88), DNMT1 (2.42), CFLAR (1.46), SRGN (1.48), ELK3 (1.73), EMP3 (1.83), PTHLH (1.34), CBX4 (1.44), PTCH1 (1.35), PHF21A (1.42), BCL3 (1.41), SEMA4D (1.34), JAZF1 (1.84), TBRG4 (1.35), VHL (1.31), GPNMB (1.33), WARS (3.48), PAWR (1.54), FABP6 (1.46), HELLS (1.88), NLRP12 (1.55), TMPRSS6 (1.31), RTKN (2.63), NSD1 (1.86), TP53 (1.6), PPP2R3B (2.16), ADAMTS1 (1.7), ZHX3 (1.76) |
| HELICASE ACTIVITY | 2.51 | 51 | CHD1 (2.01), RUVBL1 (1.5), DDX20 (2.7), DDX18 (2.02) |
| REGIONALIZATION | 2.5 | 15 | PTCH1 (1.35), T (1.47) |
| BIOGENIC AMINE METABOLIC PROCESS | 2.46 | 17 | SNCAIP (1.36) |
| FEEDING BEHAVIOR | 2.45 | 24 | FYN (2.52) |
| CLATHRIN COATED VESICLE | 2.41 | 37 | NECAP2 (1.37) |
| ATP DEPENDENT HELICASE ACTIVITY | 2.4 | 27 | DDX20 (2.7), CHD1 (2.01), DDX18 (2.02) |
| PIGMENT METABOLIC PROCESS | 2.32 | 18 | COX10 (2.98) |
| RECEPTOR MEDIATED ENDOCYTOSIS | 2.29 | 33 | PICALM (1.52), ASGR1 (1.89), MSR1 (1.98) |
| PROTEIN PHOSPHATASE TYPE 2A REGULATOR ACTIVITY | 2.28 | 14 | PPP2R3B (2.16) |
| HEME METABOLIC PROCESS | 2.25 | 11 | COX10 (2.98) |
| NEGATIVE REGULATION OF CELLULAR PROCESS | 2.23 | 646 | KAT2B (2.41), ERCC1 (1.5), EIF4G2 (1.5), NOL3 (1.88), DNMT1 (2.42), CFLAR (1.46), ELK3 (1.73), EMP3 (1.83), PTHLH (1.34), CBX4 (1.44), PHF21A (1.42), BCL3 (1.41), SEMA4D (1.34), JAZF1 (1.84), TBRG4 (1.35), VHL (1.31), GPNMB (1.33), WARS (3.48), PAWR (1.54), FABP6 (1.46), HELLS (1.88), NLRP12 (1.55), RTKN (2.63), NSD1 (1.86), TP53 (1.6), PPP2R3B (2.16), ADAMTS1 (1.7), ZHX3 (1.76) |
| PIGMENT BIOSYNTHETIC PROCESS | 2.21 | 17 | COX10 (2.98) |
| STEROID HORMONE RECEPTOR BINDING | 2.19 | 10 | NSD1 (1.86) |
| CHROMATIN MODIFICATION | 2.17 | 55 | HELLS (1.88), NSD1 (1.86) |
| HEME BIOSYNTHETIC PROCESS | 2.13 | 10 | COX10 (2.98) |
| RESPONSE TO OTHER ORGANISM | 2.07 | 83 | BCL3 (1.41), FOSL1 (1.31) |
| GROWTH FACTOR ACTIVITY | 2.05 | 55 | |
| VITAMIN TRANSPORT | 2.02 | 13 | SLC19A1 (1.59), CUBN (2.24) |
| NEURON DIFFERENTIATION | 2.02 | 76 | AGRN (1.41), FARP2 (1.8), CDK5 (1.49), MDGA2 (1.47) |
| RNA HELICASE ACTIVITY | 1.99 | 24 | DDX20 (2.7), DDX18 (2.02) |
| NEGATIVE REGULATION OF TRANSLATION | 1.99 | 23 | BCL3 (1.41), NLRP12 (1.55) |
| COFACTOR BIOSYNTHETIC PROCESS | 1.94 | 21 | COX10 (2.98) |
| HORMONE RECEPTOR BINDING | 1.89 | 83 | NSD1 (1.86), MED14 (1.34) |
| GENERATION OF NEURONS | 1.89 | 29 | AGRN (1.41), FARP2 (1.8), CDK5 (1.49), MDGA2 (1.47) |
| PHOSPHATASE REGULATOR ACTIVITY | 1.87 | 16 | PPP2R3B (2.16) |
| OXIDOREDUCTASE ACTIVITY ACTING ON THE ALDEHYDE OR OXO GROUP OF DONORS NAD OR NADP AS ACCEPTOR | 1.87 | 26 | ALDH4A1 (1.99) |
| NEUROPEPTIDE BINDING | 1.86 | 23 | NMBR (1.6) |
| NUCLEAR HORMONE RECEPTOR BINDING | 1.85 | 28 | NSD1 (1.86), MED14 (1.34) |
| RESPONSE TO NUTRIENT LEVELS | 1.84 | 47 | TP53 (1.6) |
| COATED VESICLE | 1.84 | 29 | COPE (1.41), NECAP2 (1.37) |
| PROTEIN PHOSPHATASE BINDING | 1.83 | 10 | |
| RESPONSE TO VIRUS | 1.82 | 50 | BCL3 (1.41), FOSL1 (1.31) |
| COFACTOR METABOLIC PROCESS | 1.81 | 54 | ACOT12 (1.31), COX10 (2.98), ALDH1L1 (1.35) |
| AMINO ACID DERIVATIVE METABOLIC PROCESS | 1.78 | 24 | SNCAIP (1.36) |
| NUCLEAR CHROMATIN | 1.78 | 14 | H2AFY2 (1.62) |
| MORPHOGENESIS OF AN EPITHELIUM | 1.77 | 16 | KRT3 (3.52) |
| HISTONE METHYLTRANSFERASE ACTIVITY | 1.74 | 11 | NSD1 (1.86), SUZ12 (1.59) |
For each pathway are listed any genes which individually produced an SLP>1.3. Of course, other genes will have contributed to the overall score for the pathway and the results do not allow for certainty as whether any individual gene or pathway is definitely implicated. It should also be noted that some of these genes are shared between pathways, for example NSD1, HELLS, PHF21A and PAWR. This interdependency of pathways was accounted for in the permutation testing and does not invalidate the reported p values.
Discussion
This study analysed a comprehensive set of pathways with no a priori attempt to focus on those which might be assumed to have increased relevance to schizophrenia aetiology. The method used is not expected to be biased by factors such as gene size or variant density and the conformation with the asymptotic distribution and the results of permutation analysis support the validity of the approach. Rather than dichotomising variants simply into those which are used and those which are discarded, the approach allows a broader range of variants to be included and then assigns them differential weights.
It is of note that a number of the highly ranked pathways are related to histone modification and transcription regulation. Others involve vesicle function, endocytosis and neuronal generation and differentiation. Although one case and no control were noted to have a stop mutation in SETD1A, this gene was not included in any of the pathway definitions and so did not contribute to these results. Thus this pathway analysis can be considered as independent of other reports suggesting that histone modification processes may have an important role in the aetiology of schizophrenia.
Intriguingly, a recent report demonstrates that histone turnover has a critical role in a variety of neuronal functions, including both synaptic development and activity dependent transcription (Maze, Wenderski et al.). This suggests the possibility that disruption of normal histone processing might plausibly give rise to neuropsychiatric syndromes, including schizophrenia. Given the cumulative weight of evidence now emerging from different sources, it seems that further research could usefully focus in this area.
Acknowledgments
The datasets used for the analysis described in this manuscript were obtained from dbGaP at http://www.ncbi.nlm.nih.gov/gap through dbGaP accession number 28209-1. Samples used for data analysis were provided by the Swedish Cohort Collection supported by the NIMH grant R01MH077139, the Sylvan C. Herman Foundation, the Stanley Medical Research Institute and The Swedish Research Council (grants 2009-4959 and 2011-4659). Support for the exome sequencing was provided by the NIMH Grand Opportunity grant RCMH089905, the Sylvan C. Herman Foundation, a grant from the Stanley Medical Research Institute and multiple gifts to the Stanley Center for Psychiatric Research at the Broad Institute of MIT and Harvard. The Molecular Signatures Database is funded by National Cancer Institute, National Institutes of Health, National Institute of General Medical Sciences. Warren Emmett advised on the selection of pathways.
Footnotes
Conflict of interest
The author declares he has no conflict of interest.
References
- Curtis D (2012). “A rapid method for combined analysis of common and rare variants at the level of a region, gene, or pathway.” Adv Appl Bioinform Chem 5: 1. [DOI] [PMC free article] [PubMed] [Google Scholar]
- Curtis D (2015). “Investigation of Recessive Effects in Schizophrenia Using Next-Generation Exome Sequence Data.” Ann Hum Genet. [DOI] [PubMed] [Google Scholar]
- Curtis D and UK10K Consortium (2015). “Practical experience of the application of a weighted burden test to whole exome sequence data for obesity and schizophrenia.” Ann Hum Genet. [DOI] [PMC free article] [PubMed] [Google Scholar]
- Jiang Y, Han Y, et al. (2015). “Incorporating Functional Information in Tests of Excess De Novo Mutational Load.” Am J Hum Genet 97(2): 272–83. [DOI] [PMC free article] [PubMed] [Google Scholar]
- Maze I, Wenderski W, et al. “Critical Role of Histone Turnover in Neuronal Transcription and Plasticity.” Neuron 87(1): 77–94. [DOI] [PMC free article] [PubMed] [Google Scholar]
- North BV, Curtis D, et al. (2002). “A note on the calculation of empirical P values from Monte Carlo procedures.” Am J Hum Genet 71(2): 439–41. [DOI] [PMC free article] [PubMed] [Google Scholar]
- Purcell SM, Moran JL, et al. (2014). “A polygenic burden of rare disruptive mutations in schizophrenia.” Nature. [DOI] [PMC free article] [PubMed] [Google Scholar]
- Singh T, Kurki M, et al. (2016). “Rare SETD1A loss-of-function variants are associated with schizophrenia and developmental disorders.” Nature Neuroscience. [DOI] [PMC free article] [PubMed] [Google Scholar]
- Subramanian A, Tamayo P, et al. (2005). “Gene set enrichment analysis: a knowledge-based approach for interpreting genome-wide expression profiles.” Proc Natl Acad Sci U S A 102(43): 15545–50. [DOI] [PMC free article] [PubMed] [Google Scholar]
- Takata A, Xu B, et al. (2014). “Loss-of-function variants in schizophrenia risk and SETD1A as a candidate susceptibility gene.” Neuron 82(4): 773–80. [DOI] [PMC free article] [PubMed] [Google Scholar]
- Network The and Pathway Analysis Subgroup of the Psychiatric Genomics Consortium (2015). “Psychiatric genome-wide association study analyses implicate neuronal, immune and histone pathways.” Nat Neurosci 18(2): 199–209. [DOI] [PMC free article] [PubMed] [Google Scholar]