

Abstract
Additive manufacturing (AM) is a potential application for polyetheretherketone (PEEK) spinal interbody fusion cages, which were introduced as an alternative to titanium cages because of their biocompatibility, radiolucency and strength. However, AM of PEEK is challenging due to high melting temperature and thermal gradient. Although fused filament fabrication (FFF) techniques have been shown to 3D print PEEK, layer delamination was identified in PEEK cages printed with a first generation FFF PEEK printer [1]. A standard cage design [2] was 3D printed with a second generation FFF PEEK printer. The effect of changing layer cooling time on FFF cages’ mechanical strength was investigated by varying nozzle sizes (0.2 mm and 0.4 mm), print speeds (1500 and 2500 mm/min), and the number of cages printed in a single build (1, 4 and 8). To calculate the porosity percentage, FFF cages were micro-CT scanned prior to destructive testing. Mechanical tests were then conducted on FFF cages according to ASTM F2077 [2]. Although altering the cooling time of a layer was not able to change the failure mechanism of FFF cages, it was able to improve cages’ mechanical strength. Printing a single cage per build caused a higher ultimate load than printing multiple cages per build. Regardless of the cage number printed per build, cages printed with bigger nozzle diameter achieved higher ultimate load compared to cages printed with smaller nozzle diameter. Printing with a bigger nozzle diameter resulted in less porosity, which might have an additional affect on the interlayer delamination failure mechanism.
Keywords: Polyetheretherketone, 3D printing, Spinal Cage, Fused Filament Fabrication
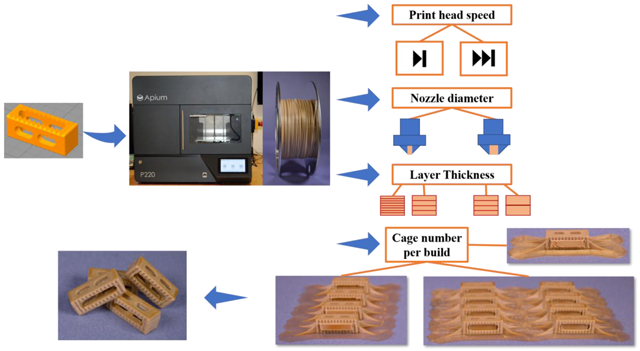
Graphical Abstract
1. INTRODUCTION
Intervertebral lumbar devices are commonly to treat patients in which the spine is unstable, such as in degenerative disc disease, spondylolisthesis, and recurrent disc herniation, to maintain the height of the intervertebral disc [3, 4]. Polyetheretherketone (PEEK) interbody fusion cages were introduced as an alternative to titanium (Ti) cages because of several advantages [5, 6]. First, PEEK has a comparable elastic modulus with cortical bone, which reduces the stress at the adjacent vertebrae and reduces subsidence [7]. Second, PEEK’S radiolucency allows for radiographic monitoring and/or tracking of cage position, misalignment, and bone in growth needed for a healthy fusion. On the other hand, PEEK is costly and its hydrophobicity limits a positive bone interaction [8]. There have been efforts to introduce modifications to PEEK to create surface porosity and hence improve osseointegration [9]. However, traditional manufacturing techniques such as porogen leaching are restricted to limited areas when creating porous structures on cages [10]. Additive Manufacturing (AM) has sparked cage manufacturers’ interest, by enabling medical device customization and allowing to manufacture complex shapes to enhance cell attraction [11-16]. AM technologies consist a wide range of different manufacturing technologies which is dependent on the specific application [17]. Fused Filament Fabrication (FFF) is one of the AM technologies, for which temperature management is very important since it is related to interlayer bonding strength [18, 19], crystallinity of the polymer [20], and the deformation of the printed part [21, 22]; all of which affect the macro mechanical properties of the finished implant. Although previous research has shown the feasibility of FFF PEEK [23-26], the importance of the interlayer adhesion was identifed as the failure mechanism that limited the macro mechanical properties of FFF PEEK load bearing implants [1]. It was shown that not controlling the cooling conditions of FFF parts is causing the poor interlayer adhesion and to overcome this problem overall parametric optimization of the FFF printing process is an important tool [18].
Previous researchers investigated the relationship of the bonding strength and the processing parameters experimentally [18, 27, 28]. Arif et al. [27] showed that the mechanical performance of FFF parts was significantly affected by fiber bonding which was regulated by the thermal conditions during printing process. Li et al. [28], on the other hand, determined the effect of air gap, layer thickness and printing speed on the bonding intensity between adjacent filaments and concluded that layer thickness and printing speed would primarily affect the bonding process of filaments compared to other parameters. Furthermore, Sun et al. [18] analyzed the processing temperatures on the bonding quality (assessed by the changes in the mesostructure and the degree of healing achieved between the layers) of FFF parts and observed that cooling conditions affect the bonding quality significantly.
In the literature, it is clear that the FFF parameters which affect the thermal conditions during printing have an impact on the 3D printed structures’ mechanical properties. However, so far, it is poorly understood how a load bearing PEEK implant’s failure mechanism and layer adhesion will be affected via altering the structural and FFF process parameters. Hence, following research questions were investigated: (1) Can altering the structural and FFF parameters, which indirectly control the thermal conditions, change the failure mechanism of FFF PEEK cages? (2) How is the cooling time of a layer is affected by changing the structural and FFF process parameters? (3) Will decreasing the cooling time of a layer increase the mechanical loads that 3D printed PEEK cages bear by enhancing the interlayer adhesion?
2. MATERIALS AND METHODS
2.1. Materials & FFF Process
Standardized spinal cages were 3D printed with a 1.75 mm diameter 450G™ (industrial grade) PEEK filament (Invibio Biomaterial Solutions Ltd., Thornton Cleveleys, UK) (Fig. 1(b)), which was dried at 60°C at least 12 hours prior to printing. 450G™ has same chemical properties (such as melting and glass transition temperature) as OPTIMA™ LT1 (medical grade), which was used in the previous studies [29, 30].
Fig. 1.

Spinal cages were printed using a commercial FFF machine capable of reaching the high temperatures associated with printing PEEK (Apium P220)(a) and PEEK 450G™ filament (Invibio) (b). The brims and support structures (c-left) were removed prior to testing (c-right).
The standard lumbar cage design, developed for use in ASTM interlaboratory studies, was adopted for this study, which was previously studied [1, 31, 32]. 3D printing procedures from the cage model to the 3D printed part was explained in detail in previous studies [1, 32]. Study samples were manufactured with a second generation FFF PEEK machine (Apium P220: Apium Additive Technologies GmbH, Karhlsruhe, Germany) (Fig. 1(a) & Table 1). As controls, single cages (n=6) with the same material were printed with the first generation FFF PEEK machine (Indmatec HPP 155/Gen 2: Apium Additive Technologies GmbH, Karhlsruhe, Germany), whereas multiple cages printed with the same machine and OPTIMA™ LT1 were investigated in the previous study [1]. The first generation printer could reach up to 450°C for the nozzle temperature and 150°C for the print bed temperature. The print environment is insulated, however there is not an additional heating element inside the chamber. The second-generation printer, on the other hand, has a wider range both for the nozzle and bed temperatures (maximum of 540°C and 160°C, respectively). The print environment is again insulated, and there is an additional heating element which is a metal plate around the nozzle with a fixed temperature of 160-250°C. (Table 1).
Table 1.
Printer specifications for 1st and 2nd generation PEEK printers used in this study.
| 1st generation PEEK Printer |
2nd generation PEEK Printer |
|
|---|---|---|
| Build volume (mm3) | 145 × 135 × 148 | 205 × 155 × 150 |
| Bed Temperature (°C) | 100 | 130 |
| Nozzle Temperature (°C) | 390-410 | 485 |
2.2. FFF and Structural Parameters
Four different parameters (all of which can either directly or indirectly affect the thermal history of the layers within the cages) were investigated in this study: nozzle size, print speed, layer thickness, and the number of cages printed per build. FFF cages were printed with two different nozzle diameters, which are 0.2 and 0.4 mm, under two different printing speeds, which were 1500 and 2500 mm/min. Under these four different conditions, cages were printed with a single cage, four cages, or eight cages per build. Under higher speed, single cages were printed with two different layer thicknesses, which were ½ and ¼ times of the original nozzle diameter (Table 2). In addition, the amount of material used to print cages and the print times can be seen in Table 3.
Table 2.
Samples printed per cohort tested in this study.
| 1st Generation Printer |
2nd Generation Printer | ||||||||||||||
|---|---|---|---|---|---|---|---|---|---|---|---|---|---|---|---|
| Nozzle size (mm) | 0.4 | 0.4 | 0.2 | ||||||||||||
| Print speed (mm/min) | 2500 | 1500 | 2500 | 1500 | 2500 | ||||||||||
| Layer thickness (mm) | 0.1 | 0.1 | 0.2 | 0.1 | 0.1 | 0.05 | 0.1 | ||||||||
| Cages printed per build | 1 | 1 | 4 | 8 | 1 | 1 | 4 | 8 | 1 | 4 | 8 | 1 | 1 | 4 | 8 |
| Sample numbers printed per cohort | 6 | 6 | 6 | 6 | 6 | 6 | 6 | 6 | 6 | 6 | 6 | 6 | 6 | 6 | 6 |
Table 3.
Material usage and time spent for builds in this study.
| Printer | Nozzle diameter (mm) |
Speed (mm/min) |
Layer thickness (mm) |
Number of Cages per Build |
Time of the build (min) |
Material Used for print (g) |
|---|---|---|---|---|---|---|
| 1st Generation Printer | 0.4 | 2500 | 0.1 | 1 | 53 | 2.43 |
| 2nd Generation Printer | 0.4 | 1500 | 0.1 | 1 | 52 | 2.60 |
| 4 | 203 | 9.77 | ||||
| 8 | 406 | 19.3 | ||||
| 2500 | 0.2 | 1 | 23 | 3.20 | ||
| 0.1 | 1 | 32 | 2.60 | |||
| 4 | 130 | 9.77 | ||||
| 8 | 261 | 19.3 | ||||
| 0.2 | 1500 | 0.1 | 1 | 122 | 2.67 | |
| 4 | 417 | 10.6 | ||||
| 8 | 828 | 21.0 | ||||
| 2500 | 0.05 | 1 | 130 | 2.51 | ||
| 0.1 | 1 | 70 | 2.67 | |||
| 4 | 277 | 10.6 | ||||
| 8 | 552 | 21.0 |
2.3. Porosity Measurements
Micro-CT scanning procedure was conducted on the cages (n=2, per cohort) (Scanco μCT 80 micro-CT scanner,Scanco Medical, Switzerland) [32]. To calculate the porosity percentage of the FFF printed cages, two measurements were taken from cage design (n=4 total measurements for each cohort), where a region of interest (ROI) was defined (Fig. 2(a)). The ROI was a solid cuboid having 50 mm3 volume (5x5x2 mm3), which was limited by the cage design (Fig. 2(b)). To calculate the porosity percentage of the cages, segmentation of the dataset was conducted as explained in detailed previously (Scanco Medical, Switzerland) [32]. From the outcome of the custom script, the porosity percentage was then calculated as follows:
| (1) |
Fig. 2.

Control volumes (shown as blue boxes) were taken from the both ends of the micro-CT scanned cage (a), which were then used to measure the porosity of the printed cages (b).
2.4. Mechanical Testing
Cages (n=6) from each cohort were tested under compression loading condition (ASTM F2077 [2]) with the help of a MTS Mini Bionix 858 system (MTS Systems Corporation, Eden Prairie, MN) (Fig. 3(a)). Moreover, the test system meets the quality system requirements of the ISO 17025 [33]. In addition, cages were tested in the vertical direction (z-plane) of their build orientation (x-y plane) to simulate the worst-case scenario for failure via layer delamination by applying the force perpendicular to the build direction (Fig. 3(b)). This scenario was enhanced by conducting only compression which is the loading condition with highest and instant load that will be applied on to the cages, out of three different loading (compression-shear and torsion) and fatigue loading conditions according to ASTM F2077 [2]. The strain rate was 25 mm/min [2] and the maximum load of the cell was 15 kN, whereas the data was collected at 100 Hz. Load-displacement curves from compression data were collected. The ultimate load and displacement values were calculated using a custom script developed using commercial software (MATLAB 2016b (Fig. 3(b)).
Fig. 3.

Compression tests were conducted on the printed cages as per ASTM F2077 [31] (a) in the direction orthogonal to the build layers (b), ultimate load (N) and ultimate displacement (mm) values were calculated from the load/displacement curves (c).
2.5. Statistics
Normality tests were conducted on the distributions of residuals using the Shapiro-Wilk test. Generally, the distributions were normal. Therefore, 2-way ANOVA with a post-hoc Tukey Honest Significant Difference Test were chosen to analyze the data. The ultimate load, ultimate displacement, and porosity metrics were the dependent variables while the nozzle diameter, cages printed per build, layer thickness, and print speed were the independent variables. Printer generation comparison was done via independent sample t-test. SPSS software (IBM SPSS Statistics 25; Armonk, NY) was used to conduct the statistical analyses with α=0.05.
3. RESULTS
3.1. The Effect of Printing Multiple Cages vs a Single Cage per Build
When printing at a slower speed (1500 mm/min), single cages printed with the bigger nozzle diameter (0.4 mm) achieved higher ultimate load than multiple cages both printed four and eight per build (mean difference=2396 & 2772 N, respectively, p<0.001 for both) (Table 4). Similarly, printing at a higher speed (2500 mm/min), single cages reached higher maximum loads than multiple cages printed four and eight per build (mean difference=2752 & 2570 N, respectively, p<0.001 for both) (Fig. 4(a)).
Table 4.
Metrics calculated in this study.
| Ultimate Load (N) |
Ultimate Displacemen t (mm) |
Porosity (%) |
||||||||
|---|---|---|---|---|---|---|---|---|---|---|
| Printer | Nozzle diameter (mm) |
Speed (mm/ min) |
Layer thickness (mm) |
Number of Cages per Build |
Mean |
Std dev |
Mea n |
Std dev |
Mea n |
Std dev |
| 2ndGeneration Printer | 0.4 | 1500 | 0.1 | 1 | 11330 | 326 | 2.81 | 0.15 | 0.71 | 0.23 |
| 4 | 8934 | 413 | 2.21 | 0.21 | 0.43 | 0.06 | ||||
| 8 | 8558 | 968 | 2.51 | 0.50 | 0.44 | 0.16 | ||||
| 2500 | 0.2 | 1 | 11670 | 911 | 3.71 | 0.27 | - | - | ||
| 0.1 | 1 | 11612 | 325 | 2.86 | 0.17 | 0.58 | 0.24 | |||
| 4 | 8860 | 456 | 2.18 | 0.10 | 0.77 | 0.20 | ||||
| 8 | 9042 | 481 | 2.41 | 0.33 | 0.99 | 0.52 | ||||
| 0.2 | 1500 | 0.1 | 1 | 7690 | 559 | 1.91 | 0.21 | 1.63 | 0.42 | |
| 4 | 6672 | 495 | 1.65 | 0.11 | 1.75 | 0.40 | ||||
| 8 | 8048 | 675 | 1.82 | 0.06 | 2.17 | 0.76 | ||||
| 2500 | 0.05 | 1 | 8798 | 613 | 1.71 | 0.24 | - | - | ||
| 0.1 | 1 | 8694 | 612 | 2.09 | 0.18 | 1.23 | 0.32 | |||
| 4 | 7016 | 438 | 1.72 | 0.25 | 1.81 | 0.65 | ||||
| 8 | 7141 | 1164 | 1.87 | 0.29 | 2.24 | 0.55 | ||||
| 1stGeneration Printer | 0.4 | 2500 | 0.1 | 1 | 11686 | 751 | 3.50 | 0.37 | 1.80 | 0.14 |
Fig. 4.

Printing single cages achieved higher ultimate load than printing multiple cages per build with bigger nozzle diameter (a) (purple bar showing the machined PEEK cage values with its mean and the standard deviation [1]) and smaller nozzle diameter under higher speed (b). Furthermore, cages printed with the bigger nozzle diameter showed higher ultimate load than printing with the smaller nozzle diameter when printing single and four cages per build under slower speed (c), whereas for all printing conditions under higher speed (d).
For cages printed at 1500 mm/min, single cages’ ultimate displacement was significantly higher than cages printed four per build (mean difference=0.603 mm, p=0.001), however it was not significantly higher than cages printed eight per build (mean difference=0.302 mm, p=0.07). Additionally, single cages’ (printed at 2500 mm/min) ultimate displacement was significantly higher than cages printed four and eight per build (mean difference=0.673 & 0.447 mm, respectively, p<0.01 for both).
In the same manner, under higher speed, the single cages’ ultimate load was significantly higher than multiple cages printed four and eight per build, when printed with the smaller nozzle diameter (0.2 mm) (mean difference=1678 & 1552 N, respectively, p<0.001 for both). Moreover, single cages’ ultimate displacement was significantly higher than cages printed four per build (mean difference=0.376 mm and p=0.003). However, under slower speed single cages’ ultimate load was only higher than multiple cages printed four per build (mean difference= 1018 N, p<0.01). Whereas, there was not a significant difference in ultimate load between printing single cages and printing eight cages per build (p=0.33, Fig. 4(b)). Similarly, single cages printed at higher speeds displaced more under the compressive load compared to cages printed four per build (mean difference 0.263 mm and p=0.03).
In addition to second generation cages’ single and multiple print comparison, single cages printed with the first generation printer were compared with the results of multiple (n=6) cages printed per build with the first generation printer in the previous study [1]. In the same manner with the second-generation printer, printing one cage per build achieved higher ultimate load than cages printed multiple (six) per build (mean difference=3446 N, p<0.001). Additionaly, printing one cage per build displaced more compared to cages printed multiple per build (mean difference= 1.63 mm, p<0.005).
3.2. Nozzle Size
When cages’ ultimate load was compared according to which nozzle diameter they were printed with, it was observed that cages printed with the smaller nozzle diameter failed at a lower maximum load than printed with the bigger nozzle diameter under higher speed (mean difference=2918, 1845, and 1901 N for 1, 4 and 8 cage per build, respectively and p<0.001 for all) (Fig. 4(c)). Furthermore, under slower speed, cages printed with bigger nozzle diameter showed higher ultimate load than when printed with smaller nozzle for cages printed single and four per build (mean difference=3640 and 2262 N, p<0.001 for both, respectively) (Fig. 4(d)). For all cage numbers printed (1, 4, and 8 per build), cages printed with smaller nozzle diameter displaced less than cages printed with the bigger nozzle diameter under both slower and higher speed (under slower speed; mean difference= 0.91, 0.56 and 0.70 mm, under higher speed; mean difference= 0.77, 0.47 and 0.54 mm for 1, 4 and 8 cages per build, p<=0.001 for all).
3.3. Layer Thickness
There was no significant association between layer thickness and ultimate load (p=0.77-0.89) (Fig. 5(a)). However, cages that have thicker layers (0.2 mm) displaced more than cages that have thinner layers (0.1 mm) for the larger diameter nozzle (mean difference=0.848 mm and p<0.001). In the same manner, for the smaller diameter nozzle; cages that have thicker layers (0.1 mm) displaced more than cages that have thinner layers (0.05 mm) (mean difference=0.382 mm and p=0.01).
Fig. 5.

Printing single cages with different layer thicknesses did not show a significant difference in cages’ ultimate load for both nozzle diameters when printed under higher speed with the second-generation printer (a-b). There was not a significant difference observed between printer generations when single and multiple printed cages’ ultimate load was compared (c-d). Purple bar in all graphs is showing the machined PEEK cage values with its mean and the standard deviation [1].
3.4. Printer Generation
There was not a significant difference in ultimate load cages achieved between the printer generations for both printing single (Fig. 5(c)) and printing multiple (Fig. 5(d)) (p=0.32 and p=0.27, respectively). Furthermore, there was not a significant difference in ultimate displacement of cages when printed multiple between 1st and 2nd generation printers. However, there was a significant difference in ultimate displacement between the 1st and 2nd generation printers when single cages were printed. Cages printed with the 1st generation printer showed higher ultimate displacement compared to cages printed with the 2nd generation printer (mean difference=0.683 mm and p=0.002).
3.5. Porosity
There was a significant association between porosity and the number of cages printed per build as well as the nozzle diameter (mean difference=0.15% between cages printed 1 and 4 cages per build, 0.42% between 1 and 8 cages printed per build, p<0.001 and mean difference=1.15% p=0.02, respectively). However, the porosity was not associated with changing the print speed (p=0.51). Under slower speed and for all build sizes, printing with the smaller diameter nozzle was associated with higher porosity for the printed cages (p<0.01 for all and mean difference=0.92%, 1.32% and 1.73% for cages printed 1, 4 and 8 per build, respectively) (Fig. 6(a)). In the same manner, under higher print speed and for all cage numbers printed at the same time, printing with the smaller diameter nozzle was associated with higher porosity for the cages (p<0.05 for all and mean difference=0.65%, 1.04%, and 1.25% for cages printed 1, 4, and 8 per build, respectively) (Fig. 6(b)). Furthermore, when the number of cages printed per build were compared in regard to their porosity, there was a porosity difference only when printing with the smaller nozzle diameter under higher speed. Cages printed 8 per build had higher porosity compared to single printed cages (p=0.002 and mean difference=1.00%). In addition, a significant difference in porosity between the printer generations was observed when single cages were printed under higher speed (p<0.001 and mean difference=1.21) (Fig. 6(c)).
Fig. 6.

Printing with smaller nozzle resulted in higher porosity in cages when printed under both print speeds (a-b). 1st generation cages had significantly higher porosity than the 2nd generation printer (c). A representative pore when printed with slower speed using the 1st generation printer (d).
4. DISCUSSION
The purpose of this study was to investigate the effect of changing FFF parameters (that indirectly control the thermal conditions) on the mechanical properties and porosities of standardized spinal cages. Specifically, under constant temperature conditions for the nozzle and printing bed, we varied the nozzle size, layer thickness, and the number of cages fabricated per build. We observed that, for the fixed temperature conditions of the present study, altering the FFF parameters did not change the failure mechanism of FFF cages. FFF cages still failed due to interlayer debonding, in the same manner as stated in the previous study [32], where the post processing (annealing) was not sufficient either to overcome this failure mechanism or enhance the mechanical strength of FFF PEEK. However, in this study, changing printing conditions that decrease the cooling time of a layer were found to improve the interlayer adhesion and strength of 3D printed PEEK cages. For example, there was a significant increase in cages’ ultimate load when the cooling time of a layer was decreased by printing a single cage per build. Single 3D printed cages printed with both printer generations exceeded 10kN before failure and achieved 86% ultimate load of the traditionally machined PEEK cages [1]. Furthermore, printing with a larger nozzle diameter resulted in stronger cages compared to printing with smaller nozzle diameter. Although for finer details and microstructures a smaller nozzle diameter might be needed, one should be careful about the increase in printing time of the structures which lead to longer cooling times of layers. Moreover, despite increasing layer thickness decreased the print time of a single cage, it did not change cages’ mechanical strength significantly. In the same manner, changing print speed did not affect cages’ strength, suggesting that the speeds investigated here did not drastically decrease the cooling time of a layer. In the same manner porosity was not affected by the print speed. However, printing with the smaller nozzle resulted in higher porosities in the cages. In one case, cages printed multiple per build had higher porosity compared to a cage printed one per build. Finally, there was not a difference in cages’ strength when printed with two different PEEK printer generations. However, cages printed with the second-generation printer had less internal porosity.
Several limitations to the current study should be recognized here. The mechanical and micro-structural outcomes of this study are associated with the current configuration of the printer and the constant temperature conditions employed in this study. One might expect different impact on the mechanical properties and porosity of the 3D printed PEEK cages than observed in this study, when a different printer and/or changes in the current configurations are employed. Nozzle diameter, print head speed, and ambient temperatures controlled during the print were restricted to the 3D printers’ capabilities utilized in this study, which are first two generations of Apium PEEK printers. These printers are advantageous for medical PEEK printing because of their smaller build volumes, requiring less space and easier thermal control of the print environment. The PEEK printers designed for industrial grade PEEK printing for aerospace and automotive applications, obviously would have bigger build volumes and therefore would need a better thermal control of the print environment compared to these desktop PEEK printers. In addition, it must be noted that layer thickness is restricted by the nozzle diameter, whereas the number of samples can be printed at the same time is restricted by the print bed dimensions.
In previous studies investigating FFF, Rodriquez et al. [34] mentioned the importance of layer adhesion for the bulk 3D printed material’s strength for a low temperature processing material (Acrylonitrile butadiene styrene (ABS)). PEEK is even more challenging compared to low temperature processed materials regarding interlayer adhesion because of its high crystallization speed and melting point, which increases the thermal gradient between the layers. In a recent study on 3D printed PEEK dog bone specimens, the interlayer delamination phenomenon was mentioned for vertically built samples and emphasized the high thermal gradient in the build direction [27]. Thus, minimizing the thermal gradient across layers is important to 3D printed PEEK load bearing implants to achieve better macromechanical properties.
It was shown in this study that decreasing the thermal gradient across layers could be possible by altering the structural and FFF parameters. For instance, the decision of printing one cage versus multiple cages per build significantly affected the cages’ ultimate strength. The reason why single cages achieved significantly higher ultimate load is likely due to the ambient temperature of the print chamber being passively controlled. When printing a single cage, layers are directly laid over each other with relatively shorter cooling times. However, when multiple cages are being printed, after a layer is deposited for a cage, the nozzle moves to print the same layer for the other cages sequentially which significantly increases the cooling time of a layer.
Another manufacturing parameter which affected the thermal gradient through the cage and resulted in significantly different mechanical outcomes was the nozzle diameter. Printing with the smaller nozzle diameter (0.2 mm) caused in lower ultimate strength in cages. Printing with a smaller nozzle diameter is not only increasing the cooling time of a layer, it also causes a single line deposited to consolidate faster, since the volume of an extruded line through the nozzle is lower than a line extruded through a bigger nozzle. Thus, the lines, which later form a layer, cool faster, resulting in lower temperatures and poorer interlayer adhesion. This might have caused the higher porosity in cages when printed with smaller nozzle diameter. The significant effect of the nozzle diameter (0.4, 0.6 and 0.8 mm) on interlayer cohesion was previously mentioned by Kuznetsov et al. [35]. They observed increased strength while printing with a larger nozzle, when the layer thickness kept constant. They also discussed increased layer height (ranging from 0.06 mm to 0.6 mm) decreased the strength of 3D printed polylactic acid (PLA) parts for all nozzles investigated. Similarly, Uddin et al. [36] showed that smallest layer thickness (0.09 mm) amongst three layer thicknesses (0.09, 0.19, and 0.39 mm) revealed the highest failure strength when ABS was printed with 0.4 mm diameter nozzle. Furthermore, Deng et al. [37] investigated three different layer thicknesses (0.2, 0.25 and 0.3 mm) for 3D printed PEEK dog-bone specimens. They optimized a set of variables including layer thickness and concluded that 0.2 mm layer thickness gave the best tensile properties. Tymrak et al. [38], on the other hand, mentioned no significant difference in ABS/PLA 3D printed parts when printed with three different layer heights (0.2, 0.3, and 0.4 mm). As in their research, we did not observe a significant layer thickness effect in 3D printed PEEK cages’ ultimate strength in this study when single cages were printed. However, higher layer thickness resulted in larger displacements in cages, suggesting a more ductile behavior. This could be a sign that thicker layers transferred more heat and increased the interlayer adhesion, however this effect was not strong enough to affect the failure load.
We found no association between the cages’ ultimate strength and the two print speeds investigated in this study (1500 and 2500 mm/min). Our previous research [1] suggested optimum print speeds below 2500 mm/min to 3D print PEEK, whereas increasing the print speed up to 3000 mm/min decreased the ultimate strength of 3D printed PEEK spinal cages and increased porosity to 20%. Similarly, Abbott et al. [39] investigated interlayer adhesion of ABS and found that increased print speed (from 600 mm/min to 3000 mm/min) resulted in lower yield strength. Likewise, Christiyan et al. [40] printed ABS composites with different print speeds (1800, 2000 and 3000 mm/min) and showed that lowest print speeds resulted in the highest tensile and flexural strength.
In the present study, the cages’ mechanical and microstructure were evaluated by altering the structural and manufacturing parameters to investigate the indirect effect of thermal conditions during the print. Nonetheless, thermal conditions (nozzle and bed temperatures) were different for 1st and 2nd generation PEEK printers while printing PEEK cages. Although these temperatures were different for these two printer generations, the cages’ ultimate strength did not change when same print builds (single vs multiple) were compared. However, 1st generation cages displaced more which suggests slightly more ductile behavior. This could be because of the build volume difference between the printer generations, in which the 1st generation printer had a smaller build volume that could result in better heat preservation.
5. CONCLUSIONS
This study investigated the structural and FFF parameters which indirectly affect the thermal conditions during the print for 3D printed PEEK spinal cages. Cages when printed one per build with both generations achieved 86% ultimate strength of the machined PEEK cages. For both generations, printing multiple cages per build was associated with lower ultimate strength and poorer interlayer adhesion. Although there was a difference between the processing temperatures of 1st and 2nd generation of PEEK printers, interestingly, the cages’ strength was not associated with the printer generation. Print speeds investigated in this study did not affect the cages’ mechanical and micro-structural outcomes. Moreover, printing with a bigger nozzle diameter increased the ultimate load of the cages and decreased the undesired porosity regardless of the layer thickness.
Supplementary Material
6. Acknowledgements
This study was supported by NIH-R01 AR069119. We would like to thank Invibio for donating the PEEK filament used in the experiment. We would also like to thank Apium for their helpful advice and fruitful discussions.
Footnotes
Publisher's Disclaimer: This is a PDF file of an unedited manuscript that has been accepted for publication. As a service to our customers we are providing this early version of the manuscript. The manuscript will undergo copyediting, typesetting, and review of the resulting proof before it is published in its final form. Please note that during the production process errors may be discovered which could affect the content, and all legal disclaimers that apply to the journal pertain.
Declaration of interest - None
References
- [1].Basgul C, Yu T, MacDonald DW, Siskey R, Marcolongo M, Kurtz SM, Structure-property relationships for 3D printed PEEK intervertebral lumbar cages produced using fused filament fabrication, J Mater Res 33(14) (2018) 2040–2051. [DOI] [PMC free article] [PubMed] [Google Scholar]
- [2].ASTM Standard F2077-14, Test Methods For Intervertebral Body Fusion Devices, ASTM International, 2014. [Google Scholar]
- [3].McGilvray KC, Waldorff EI, Easley J, Seim HB, Zhang N, Linovitz RJ, Ryaby JT, Puttlitz CM, Evaluation of a polyetheretherketone (PEEK) titanium composite interbody spacer in an ovine lumbar interbody fusion model: biomechanical, microcomputed tomographic, and histologic analyses, Spine J 17(12) (2017) 1907–1916. [DOI] [PubMed] [Google Scholar]
- [4].Asil K, Yaldiz C, Retrospective Comparison of Radiological and Clinical Outcomes of PLIF and TLIF Techniques in Patients Who Underwent Lumbar Spinal Posterior Stabilization, Medicine (Baltimore) 95(17) (2016) e3235. [DOI] [PMC free article] [PubMed] [Google Scholar]
- [5].Grob D, Daehn S, Mannion AF, Titanium mesh cages (TMC) in spine surgery, Eur Spine J 14(3) (2005) 211–21. [DOI] [PMC free article] [PubMed] [Google Scholar]
- [6].Mendenhall S, Spinal Industry Update, 28(4) (2017) 4–6. [Google Scholar]
- [7].Vadapalli S, Sairyo K, Goel VK, Robon M, Biyani A, Khandha A, Ebraheim NA, Biomechanical rationale for using polyetheretherketone (PEEK) spacers for lumbar interbody fusion-A finite element study, Spine 31(26) (2006) E992–8. [DOI] [PubMed] [Google Scholar]
- [8].Duncan JW, Bailey RA, An analysis of fusion cage migration in unilateral and bilateral fixation with transforaminal lumbar interbody fusion, European Spine Journal 22(2) (2013) 439–445. [DOI] [PMC free article] [PubMed] [Google Scholar]
- [9].Evans NT, Torstrick FB, Lee CS, Dupont KM, Safranski DL, Chang WA, Macedo AE, Lin AS, Boothby JM, Whittingslow DC, Carson RA, Guldberg RE, Gall K, High-strength, surface-porous polyether-ether-ketone for load-bearing orthopedic implants, Acta biomaterialia 13 (2015) 159–167. [DOI] [PMC free article] [PubMed] [Google Scholar]
- [10].Torstrick FB, Safranski DL, Burkus JK, Chappuis JL, Lee CSD, Guldberg RE, Gall K, Smith KE, Getting PEEK to Stick to Bone: The Development of Porous PEEK for Interbody Fusion Devices, Techniques in Orthopaedics 32(3) (2017) 158–166. [DOI] [PMC free article] [PubMed] [Google Scholar]
- [11].Eltorai AE, Nguyen E, Daniels AH, Three-Dimensional Printing in Orthopedic Surgery, Orthopedics 38(11) (2015) 684–7. [DOI] [PubMed] [Google Scholar]
- [12].Gibbs DM, Vaezi M, Yang S, Oreffo RO, Hope versus hype: what can additive manufacturing realistically offer trauma and orthopedic surgery?, Regen Med 9(4) (2014) 535–49. [DOI] [PubMed] [Google Scholar]
- [13].Martelli N, Serrano C, van den Brink H, Pineau J, Prognon P, Borget I, El Batti S, Advantages and disadvantages of 3-dimensional printing in surgery: A systematic review, Surgery 159(6) (2016) 1485–1500. [DOI] [PubMed] [Google Scholar]
- [14].Provaggi E, Leong JJH, Kalaskar DM, Applications of 3D printing in the management of severe spinal conditions, Proc Inst Mech Eng H 231(6) (2017) 471–486. [DOI] [PubMed] [Google Scholar]
- [15].Tack P, Victor J, Gemmel P, Annemans L, 3D-printing techniques in a medical setting: a systematic literature review, Biomed Eng Online 15(1) (2016) 115. [DOI] [PMC free article] [PubMed] [Google Scholar]
- [16].Ventola CL, Medical Applications for 3D Printing: Current and Projected Uses, P t 39(10) (2014) 704–11. [PMC free article] [PubMed] [Google Scholar]
- [17].Calzado M, Romero L, Domínguez I, Espinosa MM, Domínguez M, Additive Manufacturing Technologies: An Overview about 3D Printing Methods and Future Prospects, Complexity In Press (2019). [Google Scholar]
- [18].Sun Q, Rizvi GM, Bellehumeur CT, Gu P, Effect of processing conditions on the bonding quality of FDM polymer filaments, Rapid Prototyping Journal 14(2) (2008) 72–80. [Google Scholar]
- [19].Thomas J, Rodriguez J, Modeling the fracture strength between fused-deposition extruded roads, Solid Freeform Fabrication Symposium Proceeding, Austin, TX, USA, 2000, pp. 16–23. [Google Scholar]
- [20].Drummer D, Cifuentes-Cuéllar S, Rietzel D, Suitability of PLA/TCP for fused deposition modeling, Rapid Prototyping Journal 18(6) (2012) 500–507. [Google Scholar]
- [21].Xinhua L, Shengpeng L, Zhou L, Xianhua Z, Xiaohu C, Zhongbin W, An investigation on distortion of PLA thin-plate part in the FDM process, The International Journal of Advanced Manufacturing Technology 79(5) (2015) 1117–1126. [Google Scholar]
- [22].Zhang Y, Chou YK, Three-dimensional finite element analysis simulations of the fused deposition modelling process, Proceedings of the Institution of Mechanical Engineers, Part B: Journal of Engineering Manufacture 220(10) (2006) 1663–1671. [Google Scholar]
- [23].Wu WZ, Geng P, Zhao J, Zhang Y, Rosen DW, Zhang HB, Manufacture and thermal deformation analysis of semicrystalline polymer polyether ether ketone by 3D printing, Materials Research Innovations 18(S5) (2014) 12–16. [Google Scholar]
- [24].Vaezi M, Yang S, Extrusion-based additive manufacturing of PEEK for biomedical applications, Virtual and Physical Prototyping 10(3) (2015) 123–135. [Google Scholar]
- [25].Rahman KM, Letcher T, Reese R, Mechanical Properties of Additively Manufactured PEEK Components Using Fused Filament Fabrication, ASME 2015 International Mechanical Engineering Congress and Exposition, ASME, Houston, Texas, USA, 2015. [Google Scholar]
- [26].Cicala G, Latteri A, Del Curto B, Lo Russo A, Recca G, Fare S, Engineering thermoplastics for additive manufacturing: a critical perspective with experimental evidence to support functional applications, Journal of applied biomaterials & functional materials 15(1) (2017) el0–el8. [DOI] [PubMed] [Google Scholar]
- [27].Arif MF, Kumar S, Varadarajan KM, Cantwell WJ, Performance of biocompatible PEEK processed by fused deposition additive manufacturing, Materials & Design 146 (2018) 249–259. [Google Scholar]
- [28].Li H, Liu Z, Gu J, Wang D, Qu C, Preparation of high performance adhesives matrix based on epoxy resin modified by bis-hydroxy terminated polyphenylene oxide, Journal of Adhesion Science and Technology 32(11) (2018) 1224–1238. [Google Scholar]
- [29].Green S, Schlegel J, A Polyaryletherketone Biomaterial for use in Medical Implant Applications, Lancashire, UK, 2001. [Google Scholar]
- [30].Kurtz SM, Chapter 2 - Synthesis and Processing of PEEK for Surgical Implants, PEEK Biomaterials Handbook, William Andrew Publishing, Oxford, 2012, pp. 9–22. [Google Scholar]
- [31].ASTM Research Report: F04–1014, Interlaboratory Study to Establish Precision Statements for ASTM F2077, 2014.
- [32].Basgul C, Yu T, MacDonald DW, Siskey R, Marcolongo M, Kurtz SM, Does annealing improve the interlayer adhesion and structural integrity of FFF 3D printed PEEK lumbar spinal cages?, Journal of the Mechanical Behavior of Biomedical Materials 102 (2020) 103455. [DOI] [PubMed] [Google Scholar]
- [33].International Organization for Standardization, ISO/IEC 17025:2005. https://www.iso.org/standard/39883.html, (accessed 6 Feb.2018). [Google Scholar]
- [34].Rodriguez JF, Thomas JP, Renaud JE, Maximizing the Strength of Fused-deposition ABS plastic parts, 10th, Solid freeform fabrication symposium, Austin, TX, 1999, pp. 335–342. [Google Scholar]
- [35].Kuznetsov VE, Solonin AN, Urzhumtsev OD, Schilling R, Tavitov AG, Strength of PLA Components Fabricated with Fused Deposition Technology Using a Desktop 3D Printer as a Function of Geometrical Parameters of the Process, Polymers (Basel) 10(3) (2018) 313. [DOI] [PMC free article] [PubMed] [Google Scholar]
- [36].Uddin MS, Sidek MFR, Faizal MA, Ghomashchi R, Pramanik A, Evaluating Mechanical Properties and Failure Mechanisms of Fused Deposition Modeling Acrylonitrile Butadiene Styrene Parts, Journal of Manufacturing Science and Engineering 139(8) (2017) 081018. [Google Scholar]
- [37].Deng X, Zeng Z, Peng B, Yan S, Ke W, Mechanical Properties Optimization of Poly-Ether-Ether-Ketone via Fused Deposition Modeling, Materials (Basel) 11(2) (2018) 216. [DOI] [PMC free article] [PubMed] [Google Scholar]
- [38].Tymrak BM, Kreiger M, Pearce JM, Mechanical properties of components fabricated with open-source 3-D printers under realistic environmental conditions, Materials & Design 58 (2014) 242–246. [Google Scholar]
- [39].Abbott AC, Tandon GP, Bradford RL, Koerner H, Baur JW, Process-structure-property effects on ABS bond strength in fused filament fabrication, Additive Manufacturing 19 (2018) 29–38. [Google Scholar]
- [40].Christiyan KGJ, Chandrasekhar U, Venkateswarlu K, A study on the influence of process parameters on the Mechanical Properties of 3D printed ABS composite, IOP Conference Series: Materials Science and Engineering 114 (2016) 012109. [Google Scholar]
Associated Data
This section collects any data citations, data availability statements, or supplementary materials included in this article.