

Abstract
Study objectives
Patients with COPD experience lower airway and systemic inflammation, and an accelerated decline in FEV1. There is no evidence on whether this inflammation changes over time, or if it is associated with a faster decline in FEV1.
Patients and design
A cohort of 148 COPD patients (100 men) was monitored daily for a median of 2.91 years (interquartile range [IQR], 2.1 to 4.8). At recruitment, median age was 68.5 years (IQR, 62.5 to 73.6) and FEV1 as percentage of predicted (FEV1%Pred) was 38.5% (IQR, 27.7 to 50.3).
Results
During the study, the patients experienced 1,389 exacerbations, a median of 2.52/yr (IQR, 1.48 to 3.96) and FEV1 declined by 40.2 mL/yr or as FEV1%Pred by 1.5%/yr. Concerning inflammatory markers, sputum interleukin (IL)-6 rose by 9 pg/mL/yr, sputum neutrophil count rose by 1.64 × 10⁶ cells per gram sputum per year, an plasma fibrinogen rose by 0.10 g/L/yr (all p < 0.05). Patients with frequent exacerbations (≥ 2.52/yr) had a faster rise over time in plasma fibrinogen and sputum IL-6 of 0.063 g/L/yr (p = 0.046, n = 130) and 29.5 pg/mL/yr (p < 0.001, n = 98), respectively, compared to patients with infrequent exacerbations (< 2.52/yr). Using the earliest stable (nonexacerbation) measured marker, patients whose IL-6 exceeded the group median had a faster FEV1%Pred decline of 0.42%/yr (p = 0.018). Similarly, a high neutrophil count or fibrinogen were associated with a faster FEV1%Pred decline of 0.97%/yr (p = 0.001) and 0.40%/yr (p = 0.014), respectively.
Conclusions
In COPD, airway and systemic inflammatory markers increase over time; high levels of these markers are associated with a faster decline in lung function.
Keywords: airway, COPD, inflammatory markers, systemic
Abbreviations: BMI, body mass index; CI, confidence interval; FEV1%Pred, FEV1 as percentage of predicted; IL, interleukin; IQR, interquartile range
COPD is a major cause of morbidity and disability in the United States and United Kingdom, and is projected to be the third-leading cause of death worldwide by 2020.1 FEV1 is easily measurable and is the strongest spirometric predictor of mortality in patients with COPD.2 Factors that affect decline in FEV1 are therefore of prognostic importance in COPD. Long-term studies of FEV1 decline have shown the importance of cigarette smoking3 and exacerbation frequency4 5 as some of the factors that affect FEV1 decline.
COPD is associated with both airway and systemic inflammation, although there is little information on how this inflammation changes over time, or if this inflammation is related to FEV1 decline. Airway inflammatory markers are higher in more severe disease and increase at COPD exacerbation.6 7 8 While cross-sectional studies9 10 have shown that systemic inflammatory markers such as acute-phase reactant plasma fibrinogen are also increased in COPD patients, both when stable and at exacerbation. An understanding of the relationships and course of inflammatory markers in COPD is important, as the FEV1 is often little affected by COPD interventions,11 and these markers may be useful to assess the effects of novel therapies.
The airways of patients with COPD often have bacteria colonization, and it is now recognized that higher airway bacterial loads are associated with increased airway inflammation12 and exacerbation.13 We have also shown in a 1-year study14 that rising lower airway bacterial loads in stable COPD are related to faster lung function decline. Thus, it is possible that bacteria may modulate either airway or systemic inflammation and affect disease progression in COPD.
In this longitudinal study, we describe for the first time the relationships between airway and systemic inflammatory markers and FEV1 decline in COPD over a prolonged period of follow-up in a well-characterized patient cohort. We monitored patients with moderate-to-severe COPD for a median of 2.91 years (interquartile range [IQR], 2.1 to 4.8) with measurements of FEV1 every 3 months. We hypothesized that a faster decline in FEV1 in COPD would be related to lower airway and systemic inflammation and to the presence of bacteria detected in stable COPD.
Materials and Methods
Patients
For this study, 148 patients recruited into the East London COPD study since October 1, 1995, and who had recorded daily data for > 1 year prior to January 2003 were selected. The recruitment and monitoring of these patients has been previously described, and inevitably in such a long cohort study some of the patient, bacterial, and inflammatory marker data have been the subject of previous publications4 8 9 13 14 15 16; however, the current analysis and its interpretation is completely novel. COPD was defined as an FEV1 < 70% predicted from age, height, and sex; β2-agonist reversibility < 15% and/or < 200 mL; and a FEV1/FVC < 70%. Patients with significant respiratory disease other than COPD or inability to complete diary cards were excluded.
Recruitment
At recruitment, measurements were made of height and weight from which body mass index (BMI) was calculated. Measurements were also made of FEV1, FVC, and peak expiratory flow by the same, routinely calibrated rolling seal spirometer (SensorMedics; Yorba Linda, CA); reversibility to 400 μg inhaled salbutamol; and arterialized earlobe blood gases (model 278 Blood Gas Analyzer; Ciba-Corning; Medfield, MA). A history was taken of smoking habits (years of smoking, current smoking status). Patients were asked about chronic symptoms of dyspnea, sputum production, wheeze, and cough defined as occurring either all day or every morning when stable (exacerbation free). They were also asked about their long-term inhaled and oral steroid use, and a history of cardiovascular comorbidities noted. The study had ethics approval from the Ethics Committee of the East London and City Health Authority, and the patients provided written informed consent.
Daily, Quarterly, and Yearly Monitoring
The patients were asked to record on diary cards each morning any increase over their normal, stable condition of the following: (1) dyspnea, sputum purulence, or sputum volume (major symptoms); and (2) colds (nasal discharge/congestion), wheeze, sore throat, cough, and fever (minor symptoms). Exacerbation onset was identified as the first of ≥ 2 consecutive days with increase in either two or more major symptoms, or any one major symptom plus any minor symptom. Symptoms recorded continuously in the 5-day period preceding onset were disregarded in this diagnostic process to exclude occasional false exacerbations in a few patients who until reeducated reported the presence rather than an increase in a symptom. Exacerbations for which no diary card symptoms were recorded by the patient were identified from hospital admission notes for an acute exacerbation of COPD or by questioning patients about treatment from their general practitioners at clinic visits. Patients with any deterioration of symptoms were encouraged to contact the clinical team by a dedicated and manned telephone line, and approximately 50% of exacerbations were seen in the clinic, generally within 48 h, at which time lung function was measured prior to treatment. Exacerbations were treated with antibiotics and/or steroids, depending on the presence of increased sputum volume or purulence, and the severity as assessed by the clinical team.
Patients were also asked to attend clinic visits every 3 months, at which time FEV1 was measured. Once per year, in October, patients were asked about smoking habits, daily symptoms of dyspnea, sputum purulence, wheeze, and cough, and height and weight were measured. Patients who had given up smoking prior to recruitment were designated ex-smokers, and patients who after recruitment smoked continuously or intermittently were considered to be smokers. At these clinic visits, whether for an exacerbation or not, blood and sputum were obtained for tests as described below.
Study and Sample Collection Timing
This study started in October 1995 and took 7.3 years, with 50% of the patients monitored for > 2.91 years and 25% for > 4.8 years. The shortest period of monitoring was 1.02 years, and the longest was 7.24 years. At different times during the study period, at exacerbation and nonexacerbation visits, sputum was collected for bacteria, airway cytokines (interleukin [IL]-8 and IL-6) and cell counts, and blood for plasma fibrinogen estimation. Figure 1 shows that sputum IL-6 samples were obtained at intervals throughout the study, while neutrophil counts were recorded over 4 years. Fibrinogen samples were collected around year 2 (1997) and year 6 (2001) as shown in Figure 1. Few patients (43 of 148) had two or more stable sputum IL-8 determinations, and the intervening time for these was too short for a reliable estimation of any longitudinal change.
Figure 1.
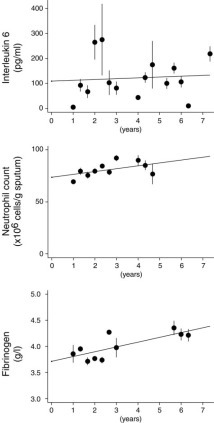
Mean stable (exacerbation-free) sputum IL-6, sputum neutrophil count, and plasma fibrinogen measured over 4-month periods, over the 7.3-year period of this study, from October 1995. Bars are 2 × SE. Lines are from a simple linear regression through these data.
Plasma Fibrinogen Assays
The method used for fibrinogen collection, storage, and processing was as described by Clauss,17 with a standard calibrated against an international standard for fibrinogen.
Sputum Preparation and Examination
Spontaneous sputum samples were obtained from patients in most cases, but when this was not possible induced-sputum samples were obtained according to previous methodology.16 We have previously shown that cell counts and inflammatory cytokines are similar in spontaneous and induced sputum.16 If both spontaneous and induced samples were available, the spontaneous sample was used. Sputum samples were processed for storage within 2 h of collection as previously described.7 12
Sputum Cytokine Assays
IL-6 and IL-8 were measured in the supernatant using a quantitative enzyme-linked sandwich immunoassay (R&D Systems Europe; Abingdon, Oxon, UK) and expressed as picograms per milliliter of supernatant, which represents a 10-fold dilution by weight of the sputum sample, as previously published.7 12
Quantitative Identification of Bacteria
Sputum samples were processed by methods previously described.12 The total lower airway bacterial load, expressed in log10 units, was used as an indicator of bacterial colonization. Total bacterial load after logarithmic transformation has been shown to affect change in FEV1 over 1 year14 and other parameters of COPD severity.12 18
Statistical Analysis
Baseline Data
Patient characteristics recorded at recruitment are presented as medians (IQR). The annual exacerbation frequency was calculated by dividing the total number of exacerbations per patient by the number of days the patient recorded data, and multiplying by 365.
Exacerbation and Nonexacerbation Periods Defined
There are no published data on the time course of inflammatory changes during a COPD exacerbation to say when any inflammatory changes are resolved. So, for the purposes of this analysis, any reading or sample obtained within the period 3 days before to 21 days after the onset of an exacerbation was considered to have been an exacerbation sample, and outside this period as a nonexacerbation (stable) sample. The 21-day period was chosen with the knowledge that symptoms and lung function during the recovery phases of an exacerbation are in the overwhelming majority of exacerbations back to the pre-exacerbation level.19 Plots of the mean inflammatory marker levels on days before and after exacerbation onset (not shown) also supported the use of a 3-week period. Three days before onset was used because pulmonary symptoms due to infection by rhinoviruses, coronaviruses, and respiratory syncytial viruses only start 3 days after infection,20 21 which suggested that the inflammatory process could have started before the symptomatic onset of the exacerbation.
Longitudinal Changes in Biomarkers Over the Study Period
We assessed longitudinal changes in the inflammation and infection parameters with time (longitudinal changes), with regression models for repeated-measures data, assuming random effects for individuals, using general linear mixed model and generalized estimating equation model procedures (STATA-5; Stata Corporation; College Station, TX). These procedures are designed for panel (cohort) data and are particularly useful when data are correlated, as in repeated-measures designs and when there are complex error structures.22 The general linear mixed model was used throughout except for the cytokine data, for which a poisson-shaped distribution was allowed for, or chronic symptoms, for which a binomial distribution was allowed for. Each parameter (as a dependent variable) was regressed against two independent variables: one was time of sampling from the start of study, and the other was a binary variable for whether the dependent variable was measured during an exacerbation or not.
Effects of Biomarkers on FEV1 Percentage of Predicted Decline
To analyze the effects of the inflammatory or infection markers (fibrinogen, IL-6, IL-8, cell counts, chronic symptoms, airway bacterial load) and patient characteristics (smoking, gender, BMI, starting FEV1) on decline in lung function, we used the panel regression procedures described above. FEV1 percentage of predicted (FEV1%Pred) was measured at the start of the study and every 3 months after. The predicted FEV1 used was recorded at recruitment and calculated from the age, sex, and height of the patients. As in the longitudinal analysis, we included as independent variables time and whether or not FEV1%Pred was measured during an exacerbation as two of the four independent variables. The third variable was whether or not the parameter, if measured on a continuous scale, was less or greater than or equal to the cohort median, or whether the patient was male or female, or whether they smoked or not, or had a chronic symptom or not. The fourth independent variable was an interaction term obtained as the product of first and third variables. This interaction term allowed us to test whether FEV1%Pred decline was faster in the group with the greater inflammation, pathogen presence, or particular characteristic. By splitting the cohort using the median, we created groups of equal size, thus avoiding bias and the need to establish normal clinically acceptable levels for these biomarkers. We used the earliest stable (nonexacerbation) measurement recruitment characteristic to dichotomize the patients into the two groups; therefore, we as much as possible prospectively examined the effect of these parameters on FEV1%Pred decline. Our findings were not substantially changed if an average value for stable samples collected throughout the study was used to dichotomize the patients into the two groups.
Of the factors in Table 1 , smoking, gender, and starting FEV1%Pred had significant relationships with FEV1%Pred decline. Accordingly, the analysis above was performed with all of these and their interaction with time, as covariates in the regression model. Thus we were able to assess whether the FEV1%Pred decline associated with markers of inflammation was independent of the effects of smoking, gender or starting FEV1%Pred.
Table 1.
Demographic, Clinical, and Physiologic Characteristics of the 148 COPD Patients in the Study, Measured at Recruitment
| Characteristics | Median | % | IQR |
|---|---|---|---|
| Age, yr | 68.5 | 62.6 to 73.7 | |
| FEV1, L | 0.98 | 0.73 to 1.30 | |
| FEV1, % predicted | 38.5 | 27.7 to 50.3 | |
| FEV1, % reversibility | 5.45 | 0.00 to 12.6 | |
| FVC, L | 2.44 | 1.81 to 2.93 | |
| FEV1/FVC, % | 42.3 | 33.5 to 53.1 | |
| Peak expiratory flow, L/min | 174 | 137 to 250 | |
| Pao2, kPa | 9.0 | 8.23 to 9.58 | |
| Paco2, kPa | 5.8 | 5.40 to 6.35 | |
| Smoking history, yr | 42 | 32 to 50 | |
| Male gender | 67.6 | ||
| Chronic dyspnea* | 47.3 | ||
| Chronic wheeze* | 31.1 | ||
| Chronic cough* | 46.0 | ||
| Chronic sputum production* | 52.7 | ||
| History of smoking | 95.6 | ||
| Smoking at recruitment | 32.8 |
Chronic refers to symptoms experienced all day or every morning.
An identical approach to that described above was used to assess the effects of exacerbation frequency, by dichotomizing the cohort into frequent and infrequent exacerbators ie, ≥ or < 2.52 exacerbations per year, respectively, on the longitudinal changes in the biomarkers. Similarly, the cohort was divided into two groups according to whether the patient had an annual rate of change in an inflammatory marker less than (slow) or greater than (fast) than the cohort median.
Results
Patient Characteristics
The 148 patients (100 men) studied had moderate-to-severe COPD (Table 1). Of these, 131 patients were receiving inhaled steroids daily at recruitment, and this increased to 141 patients by the end of the study. Thirteen patients were receiving oral steroids at the beginning of the study; at the end of the study, 20 patients were receiving a mean ± SD dosage of 5.6 ± 3.8 mg/d of oral prednisolone.
At the end of first year, October 1996, a cohort of 82 patients had been recruited, but during the subsequent years of follow-up 24 patients died and 55 withdrew voluntarily. These patients were replaced to maintain approximately 80 patients under study at any given time. During the study, there were a total of 1,389 exacerbations. The median number of exacerbations per patient per year was 2.52 (IQR, 1.48 to 3.96). Seven patients had no exacerbations during the study period. Ninety-two patients were nonsmokers prior to recruitment, 21 quit during the study or were intermittent quitters, and 35 continued to smoke (56 smokers).
Longitudinal Changes in Lung Function, Chronic Symptoms, and Inflammation
Table 2 shows the independent effects of time and exacerbation on lung function and the various biomarkers. The annual change in FEV1%Pred was a decline of 1.5%/yr, equivalent to a FEV1 decline of 40 mL/yr, and similar in magnitude to the fall in FEV1%Pred of 1.4% at exacerbation. Plasma fibrinogen increased by 0.1 g/L/yr, a smaller change than the 0.31 g/L rise at exacerbation. Sputum IL-6 increased by 9 pg/mL/yr, again less than the 70 pg/mL rise at exacerbation. Airway bacterial load did not change over time but increased significantly at exacerbation. Absolute sputum neutrophil count increased markedly, by 1.64 × 10⁶ cells per gram of sputum per year (p = 0.004), again smaller than the 3.19 × 10⁶ cells per gram of sputum rise at exacerbation. Eosinophil and macrophage counts did not change with time or at exacerbation. The odds ratio of the patient reporting chronic symptoms of dyspnea increased from 1 year to the next by 1.48 (95% confidence interval [CI], 1.33 to 1.65; p < 0.001), but there were no changes in the other chronic symptoms of cough, wheeze, or sputum (p > 0.38 in all cases).
Table 2.
Analysis Showing the Independent Effects of Time and Exacerbation With 95% CIs on Each Parameter*
| Change With Time | Exacerbation | ||||||
|---|---|---|---|---|---|---|---|
| Variables | Start† | Annual | 95% CI | Change | 95% CI | Obs‡ | Patients, No. |
| FEV1, mL | 1,146 | − 40.2§ | − 44.5 to − 36.0 | − 37.0§ | − 51.7 to − 22.4 | 3,248 | 148 |
| FEV1, % | 44.2 | − 1.5§ | − 1.7 to − 1.3 | − 1.4§ | − 2.0 to − 0.93 | 3,226 | 145 |
| Dyspnea | 1.48§∥ | 1.34 to 1.65 | NA | NA | |||
| BMI, kg/m2 | 25.7 | − 0.2§ | − 0.4 to − 0.1 | NA | NA | 467 | 147 |
| Plasma fibrinogen, g/L | 3.64 | 0.10§ | 0.07 to 0.13 | 0.31§ | 0.20 to 0.41 | 978 | 132 |
| Sputum IL-6, pg/mL | 104 | 9§ | 9 to 10 | 70§ | 7 to 75 | 262 | 98 |
| Total bacterial load, log10 cell count/g | 6.87 | 0.15 | − 0.05 to + 0.35 | 0.31§ | 0.00 to 0.62 | 274 | 80 |
| Neutrophils | 1.63¶ | 1.64§ | 0.53 to 2.76 | 3.19§ | 1.24 to 5.14 | 97 | 59 |
| Eosinophils | 0.12¶ | − 0.024 | − 0.05 to 0.00 | − 0.02 | − 0.08 to + 0.03 | 97 | 59 |
| Lymphocytes | 0.17¶ | − 0.05§ | − 0.08 to − 0.03 | 0.06§ | 0.02 to 0.09 | 97 | 59 |
| Macrophages | 0.71¶ | − 0.05 | − 0.15 to 0.04 | 0.05 | − 0.10 to 0.20 | 97 | 59 |
NA = not applicable; changes in parameters are not significant unless stated otherwise.
The start value is calculated by the regression line extrapolated backwards in time to the start date of the study.
No. of observations of the parameter.
p < 0.05.
Odd ratios for an increase in dyspnea from one year to the next.
Cell count at 1.5 years after start of study and have units of × 106 cells per gram of sputum.
Characteristics of High and Low Patient Groupings
Table 3 shows median values of the first (initial) markers of inflammation measured in this study by which the patients were dichotomized into two groups. The initial fibrinogen samples were collected a median of 462 days (IQR, 162 to 491) after recruitment into the study, IL-6 was measured at 518 days (IQR, 222 to 840), IL-8 at 1,038 days (IQR, 504 to 1,581), total bacterial count at 999 days (IQR, 426 to 1,558), and sputum neutrophil count at 498 days (IQR, 209 to 763).
Table 3.
Median Values and IQR for Each Parameter in All Patients, the Low Group (Less Than Median), and the High Group (Greater Than or Equal to the Median)*
| All Patients | Low Group | High Group | |||||||
|---|---|---|---|---|---|---|---|---|---|
| Parameters | No. | Median | IQR | No. | Median | IQR | No. | Median | IQR |
| BMI, kg/m2 | 146 | 24.9 | 21.8–27.8 | 73 | 21.8 | 19.5–23.4 | 73 | 27.9 | 26.3–29.9 |
| Age, yr | 148 | 68.5 | 62.6–73.7 | 74 | 62.6 | 58.1–65.5 | 74 | 73.7 | 75.1–70.8 |
| Fibrinogen, g/dL | 130 | 3.95 | 3.52–4.42 | 65 | 3.53 | 3.15–3.83 | 65 | 4.42 | 4.09–4.80 |
| FEV1%Pred | 146 | 38.6 | 28.3–51.3 | 73 | 28.3 | 23.3–34.8 | 73 | 51.3 | 44.6–59.3 |
| Sputum IL-6, pg/mL | 90 | 99.6 | 24.0–223.8 | 45 | 24.0 | 10.7–68.8 | 45 | 223.2 | 146.1–264.6 |
| Sputum IL-8, pg/mL | 70 | 3,125 | 1,935–3,698 | 35 | 1,946 | 1,574–2,267 | 35 | 3,682 | 3,420–4,640 |
| Neutrophils† | 45 | 1.82 | 0.88–3.79 | 22 | 0.88 | 0.58–1.15 | 23 | 3.67 | 2.32–7.92 |
| Eosinophils‡ | 45 | 25 | 7–85 | 22 | 7 | 3.5–16.5 | 22 | 85 | 40.3–326 |
| Bacteria (log)§ | 77 | 7.7 | 7.0–8.25 | 37 | 7.00 | 6.00–7.30 | 40 | 8.1 | 7.9–8.8 |
Biomarker data refer to samples collected during stable disease (exacerbation free).
Sputum neutrophil count × 106 per gram of sputum.
Sputum eosinophil count × 103 per gram of sputum.
Bacteria (log) = log10 (total airway lower airway bacterial load).
Correlations Between Biomarkers, and Biomarkers and Patient Characteristics
Plasma fibrinogen levels were not related to sputum IL-6 (ρ = 0.0086, p = 0.938, n = 84), sputum IL-8 (ρ = 0.0202, p = 0.873, n = 65), airway bacterial load (ρ = 0.0606, p = 0.616, n = 71), or neutrophils (ρ = − 0.0759, p = 0.6243, n = 44). The other inflammatory markers were not related to each other except IL-6 with IL-8 (ρ = 0.331, p = 0.0051, n = 70). The relationship between sputum IL-8 and bacterial load just failed to reach statistical significance (ρ = 0.220, p = 0.067, n = 70).
Analysis of fibrinogen, IL-6, IL-8, total bacteria, and neutrophil count with respect to the confounders (gender, smoking, and starting FEV1%Pred) revealed only two significant (p < 0.05) relationships: fibrinogen and sex (p = 0.0437, Wilcoxon) [men, median = 3.93 g/dL; women, median, 4.08 g/dL], and neutrophil count and starting FEV1%Pred (ρ = − 0.302; p = 0.0357). Patients in any of the high inflammatory marker groups did not have a greater prevalence of heart disease (defined as a history of any one or more of ischemic heart disease, angina, myocardial infarction, hypertension, atrial fibrillation, or left ventricular failure) than in the corresponding low inflammatory marker group.
Effects of Demographic and Symptom Variables on Lung Function Decline
Table 4 shows the effect of physical and related factors from Table 1 on FEV1%Pred decline. Women, smokers, and patients with a high starting FEV1%Pred had a faster FEV1%Pred decline (all p < 0.05), and there was a tendency for patients with a lower BMI to have a faster decline, but this did not reach statistical significance (p = 0.052).
Table 4.
Analysis of FEV1%Pred Decline in Relation to Patient Characteristics and Smoking Habits
| Parameters | FEV1%Pred in Low Group, at Start | Difference in FEV1%Pred Between High and Low Groups, at Start | Annual Decline in FEV1%Pred in the Low Group, %/yr | Additional Decline in FEV1%Pred in the High Group | ||||
|---|---|---|---|---|---|---|---|---|
| %/yr | 95% CI | p Value | Obs* | No.† | ||||
| Age ≥ 68.5 yr | 41.1 | 6.5‡ | − 1.51§ | 0.03 | − 0.32 to 0.38 | 0.854 | 3,242 | 147 |
| Smoking (continuous or intermittent) | 44.6 | − 0.8 | − 1.31§ | − 0.41 | − 0.75 to − 0.08 | 0.014 | 3,242 | 147 |
| Female gender | 41.5 | 9.41§ | − 1.39§ | − 0.42 | − 0.79 to − 0.05 | 0.025 | 3,242 | 147 |
| BMI ≥ 24.9 kg/m2 | 41.5 | 4.7‡ | − 1.66§ | + 0.32 | − 0.01 to 0.65 | 0.052 | 3,228 | 146 |
| FEV1%Pred ≥ 38.6% | 32.6 | 24.0§ | − 1.05§ | − 1.00 | − 1.30 to − 0.67 | 0.001 | 3,232 | 146 |
No. of FEV1%Pred observations.
Patients for whom biomarker data were available.
p < 0.05.
p < 0.001.
Effects of Biomarkers on Lung Function Decline
Table 5 show the effects of the various biomarkers assessed on lung function decline with adjustment for smoking, gender, and a high starting FEV1%Pred. Patients with the higher plasma fibrinogen levels had a 0.40%/yr faster decline in FEV1%Pred than the 0.78%/yr decline in the patient group with low fibrinogen levels (p = 0.014). There was no difference between the high and low plasma fibrinogen groups in FEV1%Pred at time zero (p = 0.748).
Table 5.
Analysis of FEV1%Pred Decline in Relation to Inflammatory Markers, With Allowance for Smoking, Gender, and High Starting FEV1%Pred
| Parameters* | Annual Decline in Low Group, %/yr† | Additional Decline in FEV1%Pred in the High Group | ||||
|---|---|---|---|---|---|---|
| %/yr | 95% CI | p Value | Obs‡ | No. | ||
| Fibrinogen, ≥ 3.95 g/L (plasma) | − 0.78 | − 0.40 | − 0.72 to − 0.08 | 0.014 | 3,019 | 129 |
| IL-6 ≥ 99.6 pg/mL (sputum) | − 0.73 | − 0.42 | − 0.77 to − 0.07 | 0.018 | 2,280 | 88 |
| IL-8 ≥ 3,125 pg/mL (sputum) | − 0.79 | − 0.28 | − 0.65 to 0.09 | 0.142 | 1,877 | 68 |
| Bacteria > 7.7 (log units) | − 0.76 | − 0.51 | − 0.88 to − 0.13 | 0.008 | 1,977 | 75 |
| Neutrophil count ≥ 1.82 × 10⁶ per gram of sputum | − 0.33 | − 0.97 | − 1.45 to − 0.49 | < 0.001 | 1,290 | 45 |
| Eosinophil count ≥ 25 × 103 per gram of sputum | − 0.45 | − 0.76 | − 0.13 to − 0.26 | 0.003 | 1,290 | 45 |
Including cut-off for inclusion in the high group.
The low groups contained patients whose initial stable values did not reach the cut-off.
No. of FEV1%Pred observations.
Table 5 also shows that high airway bacterial load, high sputum IL-6, and high sputum neutrophil and eosinophil counts were all associated with a faster decline in FEV1%Pred of between 0.3 to 0.9%/yr (p < 0.05 in all cases). High macrophage or lymphocyte counts did not influence the rate of lung function decline; p values were 0.169 and 0.768, respectively. Figure 2 depicts the decline in FEV1%Pred in the groups of patients with high or low fibrinogen or IL-6, without adjustment of smoking, gender, and starting FEV1%Pred.
Figure 2.
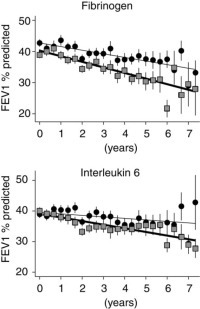
Mean FEV1%Pred in 4-month periods for low plasma fibrinogen and sputum IL-6 group patients (circles and thin line) and for high plasma fibrinogen and sputum IL-6 group patients (squares and thick line) against time from recruitment of each patient. Bars are 2 × SE. Error bars increase in size with time, as not all patients participated in the study for 7.33 years. No adjustment has been made for covariates.
Exacerbation Frequency and Inflammation
Patients were classified into infrequent and frequent exacerbator groups by the median annual exacerbation frequency (< or ≥ 2.52/yr). Figure 3 shows that patients with frequent exacerbation had a faster rise over time in plasma fibrinogen of 0.063 g/L/yr (p = 0.046, n = 130). Patients with frequent exacerbations also had a faster rise in sputum IL-6 of 29.5 pg/mL/yr (p < 0.001, n = 98) compared to the rise in infrequent exacerbators. Relationships for the other parameters in Table 5 were not significant.
Figure 3.
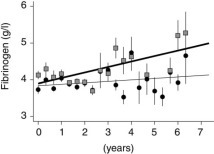
Mean plasma fibrinogen levels over 4-month intervals in infrequent (circles and thin-line exacerbators (< 2.52/yr) and frequent (box and thick line) exacerbators (≥ 2.52/yr), against time from recruitment of each patient. Bars are 2 × SE. Error bars increase in size with time, as not all patients participated in the study for 7.33 years. These data are unadjusted for the presence of an exacerbation.
Rapid Rise in Inflammation and Rapid Lung Function Decline
In 118 patients, there were at least two stable fibrinogen readings from which an annual rate of rise in plasma fibrinogen could be calculated for each patient. We found that after classifying the patients in two equal-sized groups according to the annual rate of change, those patients with a higher rate of rise of plasma fibrinogen had a more rapid decline in FEV1%Pred of 0.98%/yr (p < 0.001) in addition to the faster decline (0.66%/yr, p < 0.001) that could be attributed to whether they had a high or low initial fibrinogen, and independently of confounders such as smoking, gender and initial FEV1. Similarly, a rapid rise in airway bacterial count was also associated with a fall in FEV1%Pred of 0.5%/yr (n = 61 patients, p = 0.005) and a rapid rate in neutrophil count with a 1.44%/yr fall (n = 10, p = 0.006). Patients in whom there was a rapid rise in IL-6 or IL-8 did not exhibit a faster rate of decline in FEV1%Pred.
Discussion
This study, using a well-characterized patient cohort with moderate-to-severe COPD, has evaluated longitudinal changes in airway and systemic inflammatory markers and prospectively related levels of these markers to FEV1 decline. We have shown for the first time that in addition to the effects of smoking, gender, and starting FEV1%Pred on lung function decline, that patients with high indexes when stable of plasma fibrinogen, sputum neutrophils, sputum eosinophils, and sputum IL-6 all had a more rapid decline over time of FEV1%Pred. We have also shown that patients with persistent lower airway bacterial colonization as evidenced by a high lower airway bacterial load when stable and exacerbation free also had a faster FEV1%Pred decline. Patients with a faster rising plasma fibrinogen, neutrophil count, or bacterial load also had a faster decline. We have previously shown in this cohort of patients that a history of frequent exacerbations hastens lung function decline,4 and this study shows that these frequent exacerbators have faster rises in airway and systemic inflammatory markers. For the first time, these results provide evidence that increased airway inflammation, due possibly to frequent exacerbations, is associated with a faster lung function decline in patients with COPD.
Plasma fibrinogen is an acute-phase reactant that is synthesized in the liver mainly under the control of the cytokine IL-6 and secreted into the circulation. We and others have previously reported that plasma fibrinogen is elevated in patients with stable COPD, and we also showed that levels rise at exacerbation.9 In this study, the median plasma fibrinogen was 3.89 g/L, which is higher than would be expected for age- and sex-matched control subjects.9 23 24 We found that patients with a high plasma fibrinogen level during the initial stages of this study subsequently had a more rapid lung function decline, consistent with the results of a previous cross-sectional study.10 The annual rise we observed in this study for plasma fibrinogen was 0.1 g/L/yr, less than the rise of 0.31 g/L at COPD exacerbation but greater than that of 0.03 g/L/yr observed in a cross-sectional study25 of 20- to 70-year-old normal subjects. Plasma fibrinogen is arguably the most important risk factor for coronary heart disease,26 and so our discovery that it is associated with accelerated decline in lung function suggests a mechanism for the epidemiologically proven relationship between cardiovascular risk and obstructive lung disease.27 28 29
There has been considerable interest in the etiology of the systemic inflammatory response in patients with COPD. This systemic inflammatory response has been associated with weight loss and muscle wasting, characteristic of more severe COPD.30 31 32 Levels of systemic markers rise further at exacerbation,8 33 and it has been suggested by others that the systemic inflammatory response at exacerbation is associated with peripheral muscle weakness.34 In this study, we were unable to show a relationship between stable sputum IL-6 and plasma fibrinogen, suggesting that there is no direct link between systemic and airway inflammation. This is in agreement with a previous study35 that also showed that these two compartments were not related. It suggests that the origin of the systemic response is not caused solely by release of airway inflammatory mediators into the systemic circulation, and further research is required in this area.
In our study, we also found that neutrophils, a marker of airway inflammation, rose over the study period and was related to FEV1 decline. We have not been able to show that sputum macrophage and lymphocyte counts were related to FEV1 decline in COPD. Eosinophils were related to FEV1 decline with allowance for covariates, but not in the simpler analysis, which suggests a weak or confounded effect. The degree of airway inflammation has been related to the severity of airways obstruction with more bronchial inflammation in more severe patients.36 The rise in sputum neutrophils over time was related to more rapid FEV1 decline consistent with results of a previous cross-sectional study6 of sputum neutrophils and COPD severity.
We have also explored the relationship between COPD exacerbation frequency and airway and systemic inflammation. We found that frequent exacerbators with an exacerbation frequency of > 2.52 exacerbations per year were more likely to show a faster rise in plasma fibrinogen and sputum IL-6 over time than patients with a history of infrequent exacerbations. Two studies4 5 now show that frequent exacerbators have a more rapid decline in lung function. Thus, we suggest that the mechanism by which these acute events contribute to the chronic deterioration in FEV1 decline is by causing a faster rate of rise in airway inflammation. This is consistent with the higher sputum IL-6 and IL-8 levels in stable (nonexacerbating) patients who have a history of frequent exacerbations compared to those with infrequent exacerbations.8 The elevated systemic inflammatory response in the frequent exacerbators suggests that this group may be particularly prone to muscle weakness with increasing disease severity and thus they may be an important group to target for pulmonary rehabilitation. The faster rise in plasma fibrinogen in the frequent exacerbators also suggests that these patients may be the group of COPD patients most at risk from cardiovascular disease.
From our findings, it can be extrapolated that interventions that reduce airway inflammation may affect decline in FEV1 in COPD. It is also likely that these anti-inflammatory therapies will be most effective in patients with frequent exacerbations. There is evidence from the Inhaled Steroids in Obstructive Lung Disease in Europe study37 that inhaled steroids showed the greatest benefit on exacerbations in those COPD patients with a higher exacerbation frequency. Data from a meta-analysis38 show that probably inhaled steroids have a small effect on FEV1 decline and this effect on decline may be a consequence of the reduction in exacerbations. We also found that patients with a high starting FEV1%Pred had a faster decline. This is contrary to the conventional idea that a high FEV1 is due to a slow decline and a low FEV1 to a fast decline. In their landmark monograph, Fletcher et al39 cautioned against this assumption. A slower decline in the group of patients with very severe COPD may in part be due to a survival effect, with faster decliners absent due to death and the use of intensive therapy in the latter stages of the disease.
The lower airways of healthy individuals are normally sterile, but in COPD lower-airway bacterial colonization occurs that is related to increased disease severity in COPD.40 Patients with lower-airway bacterial colonization have increased airway inflammatory markers and increased exacerbation frequency.12 13 14 In this study, we have shown that a high load of lower airway bacteria was associated with a more rapid FEV1 decline over a prolonged period, extending the results of our previous, short-term study.14 We also found that airway bacterial load was positively correlated with sputum IL-8 but were not able to show with allowance for confounders that high levels of sputum IL-8 were associated with faster FEV1%Pred decline. This might reflect the small number of available samples that prevented us from assessing IL-8 changes over time. Appropriate antimicrobial therapy to reduce airway bacterial load in stable patients may thus play an important part in reducing airway bacterial load, airway inflammation, and thus arresting disease progression in COPD.
The strengths of this study are the large data set of regular FEV1 readings over a considerable period of time, collection of daily respiratory symptoms by which exacerbations were identified, and the standardization of patient characterization and treatment that results from a single-center study. The limitations of our study need to be discussed. Firstly, for many patients, the initial microbial and inflammatory marker samples used to differentiate the patients into the high and low groupings were obtained at different times, with respect to the calendar date and time elapsed from recruitment, when and if they were able to produce sufficient sputum for analysis. The use of samples that were not collected at commencement of the study is not a serious drawback, as our primary outcome measure—annual decline in FEV1%Pred—should be the same before or after the date of sampling, assuming a linear decline over the period the patients were investigated. It is possible that patients transferred from the low to the high grouping during the study; however, any bias from this would be to make it less likely that a significant difference would exist between the high and low groups. Secondly, our data set is incomplete because—like all cohort studies—there are unavoidable dropouts. We found no difference in the confounders or inflammatory markers of patients who died or withdrew from the study (data not shown). In addition, the inflammatory markers were not all available on every patient. This prevented us performing an analysis that included more than one inflammatory marker at any one time.
In summary, we have shown for the first time in a 7-year study that high levels of airway and systemic inflammatory markers are associated with a faster subsequent decline in FEV1. We have also shown that this inflammation increases with time and that long-term deterioration in COPD and thus future severity of the condition are related to inflammatory indexes and to the presence of chronic airway bacterial colonization. Knowledge of the relationships of these biomarkers to disease progression allows us to design clinical trials of anti-inflammatory and anti-infective therapies that include appropriate outcomes such as inflammatory markers, since they reflect the course of the disease.
We are grateful to all the COPD patients in the East-London cohort who contributed to the study. We thank Dr. Mark Roland, Dr. Simon Leedham, and Dr. Simon Lloyd-Owen for assistance with the collection of clinic data, and Dr. Mark Wilks for help with bacteriologic analysis. We are also grateful to Bob Burnell for laboratory assistance.
Footnotes
Reproduction of this article is prohibited without written permission from the American College of Chest Physicians (www.chestjournal.org/misc/reprints.shtml).
Funding was provided by the British Lung Foundation, GSK, and the Joint Research Board of St. Batholomew's Hospital.
References
- 1.Murrey CJL, Lopez AD. Evidence-based health policy: lessons from the Global Burden of Health Study. Science. 1996;274:740–743. doi: 10.1126/science.274.5288.740. [DOI] [PubMed] [Google Scholar]
- 2.Thomason M, Strachan DP. Which spirometric indices best predict subsequent death from chronic obstructive pulmonary disease? Thorax. 2000;5:785–788. doi: 10.1136/thorax.55.9.785. [DOI] [PMC free article] [PubMed] [Google Scholar]
- 3.Anthonisen NR, Connett JE, Kiley JP. Effects of smoking intervention and the use of an inhaled anticholinergic bronchodilator on the rate of decline of FEV1: the Lung Health Study. JAMA. 1994;16:1539–1541. [PubMed] [Google Scholar]
- 4.Donaldson GC, Seemungal TAR, Bhowmik A. Relationship between exacerbation frequency and lung function decline in chronic obstructive pulmonary disease. Thorax. 2002;57:847–852. doi: 10.1136/thorax.57.10.847. [DOI] [PMC free article] [PubMed] [Google Scholar]
- 5.Kanner RE, Anthonisen NR, Connett JE. Lower respiratory illnesses promote FEV1 decline in current smokers but not ex-smokers with mild chronic obstructive pulmonary disease. Am J Respir Crit Care Med. 2001;164:358–364. doi: 10.1164/ajrccm.164.3.2010017. [DOI] [PubMed] [Google Scholar]
- 6.Di Stefano A, Capelli A, Lusuardi M. Severity of airflow limitation is associated with severity of airway inflammation in smokers. Am J Respir Crit Care Med. 1998;158:1277–1285. doi: 10.1164/ajrccm.158.4.9802078. [DOI] [PubMed] [Google Scholar]
- 7.Stãnescu D, Sanna A, Veriter C. Airways obstruction, chronic expectoration, and rapid decline of FEV1 in smokers are associated with increased levels of sputum neutrophils. Thorax. 1996;51:267–271. doi: 10.1136/thx.51.3.267. [DOI] [PMC free article] [PubMed] [Google Scholar]
- 8.Bhowmik A, Seemungal TAR, Sapsford RJ. Relation of sputum inflammatory markers to symptoms and lung function changes in COPD exacerbations. Thorax. 2000;55:114–120. doi: 10.1136/thorax.55.2.114. [DOI] [PMC free article] [PubMed] [Google Scholar]
- 9.Wedzicha JA, Seemungal TAR, Mac Callum PK. Acute exacerbations of chronic obstructive pulmonary disease are accompanied by elevations of plasma fibrinogen and serum IL-6 levels. Thromb Haemost. 2000;84:210–215. [PubMed] [Google Scholar]
- 10.Dahl M, Tybjaerg-Hansen A, Vestbo J. Elevated plasma fibrinogen associated with reduced pulmonary function and increased risk of chronic obstructive pulmonary disease. Am J Respir Crit Care Med. 2001;164:1008–1011. doi: 10.1164/ajrccm.164.6.2010067. [DOI] [PubMed] [Google Scholar]
- 11.Jones PW, Bosh TK. Quality of life changes in COPD patients treated with salmeterol. Am J Respir Crit Care Med. 1997;155:1283–1289. doi: 10.1164/ajrccm.155.4.9105068. [DOI] [PubMed] [Google Scholar]
- 12.Hill AT, Campbell EJ, Hill SL. Association between airway bacterial load and markers of airway inflammation in patients with stable chronic bronchitis. Am J Med. 2000;109:288–295. doi: 10.1016/s0002-9343(00)00507-6. [DOI] [PubMed] [Google Scholar]
- 13.Patel IS, Seemungal TA, Wilks M. Relationship between bacterial colonization and the frequency, character, and severity of COPD exacerbations. Thorax. 2002;57:759–764. doi: 10.1136/thorax.57.9.759. [DOI] [PMC free article] [PubMed] [Google Scholar]
- 14.Wilkinson TMA, Patel IS, Wilks M. Airway bacterial load and FEV1 decline in patients with chronic obstructive pulmonary disease. Am J Respir Crit Care Med. 2003;167:1090–1095. doi: 10.1164/rccm.200210-1179OC. [DOI] [PubMed] [Google Scholar]
- 15.Seemungal T, Harper-Owen R, Bhowmik A. Respiratory viruses, symptoms, and inflammatory markers in acute exacerbations and stable chronic obstructive pulmonary disease. Am J Respir Crit Care Med. 2001;164:1618–1623. doi: 10.1164/ajrccm.164.9.2105011. [DOI] [PubMed] [Google Scholar]
- 16.Bhowmik A, Seemungal TA, Sapsford RJ. Comparison of spontaneous and induced sputum for investigation of airway inflammation in chronic obstructive pulmonary disease. Thorax. 1998;53:953–956. doi: 10.1136/thx.53.11.953. [DOI] [PMC free article] [PubMed] [Google Scholar]
- 17.Clauss A. Gerinnungsphysiologische Schnellmethode zur Bestimmung des Fibrinogens. Acta Haematol (Basel) 1957;17:237–246. doi: 10.1159/000205234. [DOI] [PubMed] [Google Scholar]
- 18.Zalacain R, Sobradillo V, Amilibia J. Predisposing factors for bacterial colonization in chronic obstructive pulmonary disease. Eur Respir J. 1999;13:343–348. doi: 10.1034/j.1399-3003.1999.13b21.x. [DOI] [PubMed] [Google Scholar]
- 19.Seemungal TAR, Donaldson GC, Bhowmik A. Time course and recovery of exacerbations in patients with chronic obstructive pulmonary disease. Am J Respir Crit Care Med. 2000;161:1608–1613. doi: 10.1164/ajrccm.161.5.9908022. [DOI] [PubMed] [Google Scholar]
- 20.Tyrrell DA, Cohen S, Schlarb JE. Signs and symptoms in common colds. Epidemiol Infect. 1993;111:143–156. doi: 10.1017/s0950268800056764. [DOI] [PMC free article] [PubMed] [Google Scholar]
- 21.Isaacs D. Oxford University Press; Oxford, UK: 1996. Respiratory tract viruses; p. 338. (Oxford textbook of medicine). Weatherall, DJ Ledingham, JGG Warrell, DA eds. [Google Scholar]
- 22.Edward LJ. Modern statistical techniques for the analysis of longitudinal data in biomedical research. Pediatr Pulmonol. 2000;30:330–334. doi: 10.1002/1099-0496(200010)30:4<330::aid-ppul10>3.0.co;2-d. [DOI] [PubMed] [Google Scholar]
- 23.Alessandri C, Basili S, Violi F. Hypercoagulability state in patients with chronic obstructive pulmonary disease. Thromb Haemost. 1994;72:343–346. [PubMed] [Google Scholar]
- 24.Meade TW, Ruddock V, Stirling Y. Fibrinolytic activity, clotting factors and long term incidence of ischaemic heart disease in the Northwick Park Heart Study. Lancet. 1993;324:1076–1079. doi: 10.1016/0140-6736(93)92062-x. [DOI] [PubMed] [Google Scholar]
- 25.Short K, Nair R. The effect of age on protein metabolism. Curr Opin Clin Nutr Metab Care. 2000;3:39–44. doi: 10.1097/00075197-200001000-00007. [DOI] [PubMed] [Google Scholar]
- 26.Danesh J, Collins R, Appleby P. Association of fibrinogen, C-reactive protein, albumin or leukocyte count with coronary heart disease. JAMA. 1998;279:1477–1482. doi: 10.1001/jama.279.18.1477. [DOI] [PubMed] [Google Scholar]
- 27.Lange P, Nyboe J, Appleyard M. Spirometric findings and mortality in never smokers. J Clin Epidemiol. 1990;43:867–873. doi: 10.1016/0895-4356(90)90070-6. [DOI] [PubMed] [Google Scholar]
- 28.Hole DJ, Watt GCM, Davey-Smith G. Impaired lung function and mortality risk in men and women: findings from the Renfew and Paisley prospective population study. BMJ. 1996;313:711–715. doi: 10.1136/bmj.313.7059.711. [DOI] [PMC free article] [PubMed] [Google Scholar]
- 29.Sin DD, Man SF. Why are patients with chronic obstructive pulmonary disease at increased risk of cardiovascular diseases? The potential role of systemic inflammation in chronic obstructive pulmonary disease. Circulation. 2003;107:1514–1519. doi: 10.1161/01.cir.0000056767.69054.b3. [DOI] [PubMed] [Google Scholar]
- 30.Eid AA, Ionescu AA, Nixon LS. Inflammatory response and body composition in chronic obstructive pulmonary disease. Am J Respir Crit Care Med. 2001;164:1414–1418. doi: 10.1164/ajrccm.164.8.2008109. [DOI] [PubMed] [Google Scholar]
- 31.De Godoy I, Donahoe M, Calhoun WJ. Elevated TNF-α production by peripheral blood monocytes of weight-losing COPD patients. Am J Respir Crit Care Med. 1994;150:1453–1455. doi: 10.1164/ajrccm.153.2.8564110. [DOI] [PubMed] [Google Scholar]
- 32.Wouters EF. Chronic obstructive pulmonary disease: 5. Systemic effects of COPD. Thorax. 2002;57:1067–1070. doi: 10.1136/thorax.57.12.1067. [DOI] [PMC free article] [PubMed] [Google Scholar]
- 33.Dentener MA, Creutzberg EC, Schols AM. Systemic anti-inflammatory mediators in COPD: increase in soluble interleukin 1 receptor II during treatment of exacerbations. Thorax. 2001;56:721–726. doi: 10.1136/thorax.56.9.721. [DOI] [PMC free article] [PubMed] [Google Scholar]
- 34.Spruit MA, Gosselink R, Troosters T. Muscle force during an acute exacerbation in hospitalised patients with COPD and its relationship with CXCL8 and IGF-I. Thorax. 2003;58:752–756. doi: 10.1136/thorax.58.9.752. [DOI] [PMC free article] [PubMed] [Google Scholar]
- 35.Vernooy JH, Kucukaycan M, Jacos JA. Local and systemic inflammation in patients with chronic obstructive pulmonary disease. Am J Respir Crit Care Med. 2002;166:1218–1224. doi: 10.1164/rccm.2202023. [DOI] [PubMed] [Google Scholar]
- 36.Turato G, Zuin R, Miniati M. Airway inflammation in severe chronic obstructive pulmonary disease: relationship with lung function and radiologic emphysema. Am J Respir Crit Care Med. 2002;166:105–110. doi: 10.1164/rccm.2111084. [DOI] [PubMed] [Google Scholar]
- 37.Jones PW, Willits LR, Burge PS. Inhaled Steroids in Obstructive Lung Disease in Europe study investigators. Disease severity and the effect of fluticasone propionate on chronic obstructive pulmonary disease exacerbations. Eur Respir J. 2003;21:68–73. doi: 10.1183/09031936.03.00013303. [DOI] [PubMed] [Google Scholar]
- 38.Sutherland ER, Allmers H, Ayas NT. Inhaled corticosteroids reduce the progression of airflow limitation in chronic obstructive pulmonary disease: a meta-analysis. Thorax. 2003;58:937–941. doi: 10.1136/thorax.58.11.937. [DOI] [PMC free article] [PubMed] [Google Scholar]
- 39.Fletcher CM, Peto R, Tinker CM. Oxford University Press; Oxford, UK: 1976. (The natural history of chronic bronchitis and emphysema). [Google Scholar]
- 40.Soler N, Ewig S, Torres A. Airway inflammation and bronchial microbial patterns in patients with stable chronic obstructive pulmonary disease. Eur Respir J. 1999;14:1015–1022. doi: 10.1183/09031936.99.14510159. [DOI] [PubMed] [Google Scholar]