

Abstract
In vitro electrofusion of cells brought into contact and exposed to electric pulses is an established procedure. Here we report for the first time the occurrence of fusion of cells within a tissue exposed in vivo to permeabilizing electric pulses. The dependence of electrofusion on the ratio of applied voltage to distance between the electrodes, and thus on the achievement of in vivo cell electropermeabilization (electroporation) is demonstrated in the metastasizing B16 melanoma tumor model. The kinetics of the morphological changes induced by cell electrofusion (appearance of syncytial areas or formation of giant cells) are also described, as well as the kinetics of mitosis and cell death occurrence. Finally, tissue dependence of in vivo cell electrofusion is reported and discussed, since electrofusion has been observed neither in liver nor in another tumor type. Particular microenvironmental conditions, such as the existence of reduced extracellular matrices, could be necessary for electrofusion achievement. Since biomedical applications of in vivo cell electropermeabilization are rapidly developing, we also discuss the influence of cell electrofusion on the efficacy of DNA electrotransfer for gene therapy and of antitumor electrochemotherapy, in which electrofusion could be an interesting advantage to treat metastasizing tumors.
Keywords: Electropermeabilization, Electroporation, Electrofusion, Electrochemotherapy, Cell fusion, Melanoma, In vivo, Normal tissue
1. Introduction
Spontaneous cell fusion among animal cells occurs during certain stages of the developmental program, like in the case of the generation of muscle fibers by myoblast fusion. Otherwise, cells in tissues do not fuse in spite of close contacts between them. There are two main reasons for the absence of cell fusion in tissues. First, the external matrix of the cells constitutes a physical obstacle to the fusion. Second, the structure of the lipid bilayers, with external hydrophilic layers at both sides of the internal hydrophobic core, prevents the spontaneous fusion of intact lipid bilayers. However, fusion between the plasma membrane and the membrane of cell internal vesicles, as well as fusion between membranes of different internal vesicles, or fission (e.g., at Golgi tubular networks), constantly occur in the living eucaryotic cells. Indeed, fusion and fission sustain membrane traffic, endocytosis and exocytosis, as well as intracellular transport in general. The mechanisms underlying the ‘internal’ fusions and fissions are still under analysis: vesicle fusion occurs mainly on the basis of SNAREs proteins interactions [1], but other proteins, like the SM proteins or the Rab proteins might also be involved (reviewed in [2]). These proteins can also directly contribute to membrane fusion [1], like the spike protein of murine coronaviruses [3] or other viral proteins [2]. In spite of rapid accumulation of new results, the membrane fusion mechanisms are not yet fully described. Recently the role of the lipids has been pointed out because membrane fission of Golgi tubular networks has been shown to depend also on the acylation of lysophosphatidic acid by specific proteins [4]. However, the mechanisms underlying the fusion of intact plasma membranes of two different cells, like in the case of the myoblast, are still unknown at the molecular level.
In vitro cell–cell fusion can be induced artificially in cells that are in contact by adding to the cell culture medium either a fusogenic agent such as polyethylene glycol (PEG) [5] or a fusogenic virus, such as the Sendai virus [6] or by subjecting the cells to one or few electric pulses (EP). This last approach, termed electrofusion, is based on cell electropermeabilization [7] (also termed electroporation), which is caused by the increase in transmembrane potential imposed by the application to the cells of external electric fields [8]. Reversible cell electropermeabilization corresponds to the transient and reversible modification of the plasma membrane structure [9]. In vitro, this modification has several biological consequences as well as some biotechnological and biomedical applications [10], [11]: (i) increase of membrane permeability to non-permeant or low-permeant molecules, (ii) electroinsertion into the membrane of proteins possessing transmembrane domains, or (iii) electrofusion of cells.
In vitro electrofusion of cells growing in suspension is a common procedure for obtaining hybridomas [12], [13], [14]. Electrofusion of cells that require their attachment to a solid substrate to grow was already described [15], [16], [17], [18]. Electrofusion occurs provided that the electropermeabilized membranes on the cells are brought to close contact [7], [19], [20]. It was also shown that in vitro the completion of the process requires several hours and leads to large rearrangements of cytoskeleton [21].
Ex vivo and in vivo electrofusion of human cells to rabbits cornea, obtained by the simultaneous application of the electric pulses and a mechanical pressure, was reported in 1989 and 1990 by Grasso and Heller [22], [23], [24]. It is noteworthy that cell electropermeabilization is easily achieved using appropriate EP [25], [26], [27], [28] and that it has two interesting biomedical applications, electrochemotherapy [11], [29], [30] and DNA electrotransfer for gene therapy [31], [32], [33].
Here we report for the first time the occurrence of fusion of cells within a tissue exposed in vivo to permeabilizing EP. The kinetics of the morphological changes induced by cell electrofusion are also described. Finally we show and discuss the existence of a tissue dependence for the occurrence of cell electrofusion in vivo.
2. Materials and methods
2.1. Tumor cell culture and tumor production
B16 F0 melanoma cells (ATCC CRL 6322) were cultured in vitro using classical procedures and MEM culture medium (Gibco BRL, Cergy-Pontoise, France) supplemented with 100 U/ml penicillin, 100 mg/ml streptomycin, and 8% fetal calf serum (Gibco BRL). The LPB cell line is a clonal derivative of TBL.Cl2, a methylcholanthrene-induced C57Bl/6 mouse sarcoma cell line [34]. They were cultured under the same conditions than the B16 cells. Young (6–8 weeks) C57Bl/6 female mice were inoculated subcutaneously in the left flank with 1×10⁶ to 1.2×10⁶ syngeneic either B16 cells or LPB cells, producing tumors of 6–7 mm average diameter 8–10 days later. Every experimental situation, defined by the electrical conditions and the time of mouse sacrifice after the treatment, was performed in triplicate, that is, repeated using three mice. Mice were anesthetized using a mixture of xylazine 12.5 mg/kg (Bayer Pharma, Puteaux, France) and ketamine 125 mg/kg (Parke Davis, Courbevoie, France).
2.2. Tissue treatment with electric pulses
Tumor exposure to the EP was performed as previously described [35], [36]. Briefly, stainless-steel external plate electrodes were placed on the both sides of the protruding tumor, contact with the skin being improved by means of electrocardiogram paste. Square-wave EP (8 pulses of 100 μs delivered at the frequency of 1 Hz) were generated by a PS 15 electropulsator (Jouan, St Herblain, France) and controlled through a VC-6025 oscilloscope (Hitachi, Japan). For 1350 V/cm pulses, 800 V were applied between two parallel electrodes 10 mm in size and 6 mm apart. For 2000 V/cm and 500 V/cm, 1200 and 300 V, respectively, were applied. After the treatment, mice were reinstalled in their cages for different periods (between 1 and 100 h) and then killed, and the tumors removed for histological processing.
For liver, a subxyphoid incision was done to expose the left lobe that was submitted to the EP. The same two plate electrodes used for tumors, also at a distance of 6 mm, were placed on both sides of the lobe. The square wave EP (100 μs, 1 Hz, 8 pulses) had an amplitude of 300 V (500 V/cm) or 600 V (1000 V/cm).
2.3. Histological procedures
Tumors and liver lobes were fixed in AFA (75% ethanol, 5% acetic acid and 2% of 40%-formaldehyde) for 24 h, dehydrated and embedded in paraffin. Slices of 5 μm were prepared using a Reichert–Jung 2030 microtome (Microm–Zeiss, Jena, Germany). Then slices were rehydrated and stained with 0.2% hemalun/0.3% eosin/5% safran (HES). The magnifications used are reported in the figures.
Slices were examined under a Leica DMRB (Leitz, Wetzlar, Germany) microscope equipped with an automatic photographic device. For each experimental condition, three mice were treated, and from each mouse, three tumor slices were prepared. All the slices were examined to detect the types of cell patterns present in each experimental condition. On slices prepared from the tumors of two out of three mice treated under the same conditions and killed after identical periods, the number of giant cells and of syncytial areas (see Section 3 for description) were counted, as well as the number of nuclei in each giant cell and in each syncytial area. The percentages of giant cells and of syncytial areas were calculated with respect to the total number of cells, while percentages of nuclei in giant cells and syncytial areas were determined with respect to the total number of nuclei. For that quantification, in each slice, the cells from three randomly chosen fields were counted. On the average, close to 1700 cells were counted for each experimental condition.
2.4. Determination of in vivo cell electropermeabilization
Bleomycin (Lab. Roger Bellon, Neuilly, France) was dissolved at 10 mg/ml in sterile 0.9% NaCl, and 100 μl of solution (approximately 50 mg/kg) was injected intravenously in the retro-orbitary sinus, 4 min before the electric pulse delivery. In electropermeabilized cells, this concentration led to chromatin condensation (pseudoapoptosis), which was used as a marker. Mice were killed 5 h after EP delivery, and tumors and liver were immediately removed and processed for histological staining as described above.
2.5. Apoptosis-specific staining
Deparaffinated slices were washed in phosphate-buffered saline (PBS; 50 mM Na2HPO4, 50 mM NaH2PO4 and 200 mM NaCl, pH 7.4), digested with 20 μg/ml Proteinase K (Sigma, La Verpillière, France) and stained using the in situ cell death detection kit – alkaline phosphatase (Boehringer-Mannheim, Meylan, France), according to the instructions of the manufacturer.
3. Results
3.1. In vivo electrofusion
On the HES-stained histological slices of untreated control B16 tumors, most of the nuclei displayed a relatively regular size. They were usually located in the center of the tumor cell, symmetrically surrounded by cytoplasm (Fig. 1A,B ). The membrane limiting each individual cell was clearly visible. On the contrary, in electrically treated tumors, 70 h after the delivery of permeabilizing EP, completely different patterns could be detected (Fig. 1C–H). The nuclei were reassembled in a common cytoplasm forming polynuclear giant cells. These giant cells contained several nuclei in close contact (a maximum of 64 nuclei was counted in one case, see Fig. 1H), organized in two different categories: (i) patterns with a large cytoplasm and a peripheral ring of multiple nuclei; (ii) patterns with multiple nuclei arranged randomly in the center. At 70 h after EP delivery (1350 V/cm), 4.8% of the nuclei (observed randomly as described in Section 2) were included in giant cells containing more than one nucleus. This was in clear contrast with the situation observed in the control tumors removed from the mice either at the time of the treatment of the treated tumors or 70 h later. Indeed in each of these control situations, out of the 1700 cells counted, no cell was found to contain more than one nucleus. Nevertheless, the complete examination of all the control sections showed that in controls, very few tumor cells did contain two nuclei.
Fig. 1.
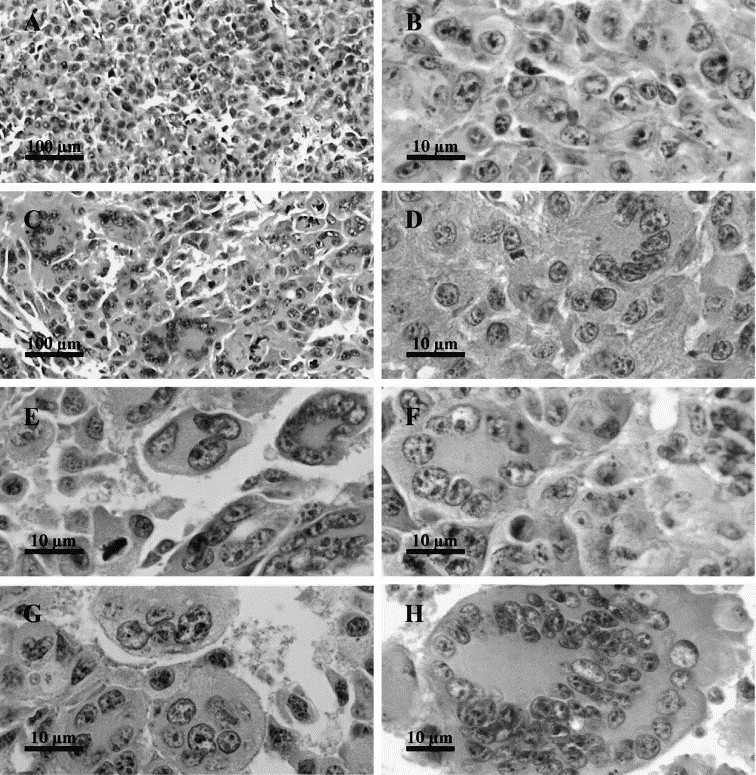
Characteristic giant cells observed 70 h after the delivery of permeabilizing electric pulses to B16 tumors. B16 tumors were exposed to 8 EP of 1350 V/cm and 100 μs delivered at a frequency of 1 Hz (×1300). (A,B) Untreated control tumors fixed 70 h after the treatment of the treated tumors (A: ×130; B: ×1300). (C–G) Selected images of giant cells with a large cytoplasm and a peripheral ring of multiple nuclei (D–F) or multiple nuclei arranged randomly in the center (G) (C: ×130; D–G: ×1300). (H) A giant cell containing 64 nuclei (×750).
3.2. Kinetics of fusion figures appearance
Shortly after the treatment by the EP (1 h), no change in the nuclei distribution was observed. However, two modifications were detected: the appearance of syncytial areas and the formation of giant cells. In the syncytial areas, the membranes separating the cells were no longer detectable (Fig. 2B,C ). In the first hours after EP delivery, this modification was the predominant one. In the giant cells (Fig. 2D–F), the cytoplasm is clearly limited by a continuous membrane and the number of nuclei in each giant cell could be easily counted. Contrarily to the syncytial areas, giant cells were not abundant 1 h after tumor electric treatment.
Fig. 2.
Morphological evolution of the fused cells after the delivery of permeabilizing electric pulses to B16 tumors. B16 tumors were treated as reported in Fig. 1. (A) Untreated control tumors fixed 70 h after the treatment of the treated tumors (×1300). (B–F) Figures observed in tumors fixed 3 h (B), 5 h (C), 10 h (D), 24 h (E) and 100 h (F) after EP delivery (×1300). At short times, large syncytial areas (B,C) as well as giant cells were observed. After 10 h, only characteristic giant cells (D–F) were detected.
One hour after EP delivery, the percentage of nuclei in the syncytial areas was already as high as 8%, and the percentage of syncytial areas reached 1.3%. In the giant cells the percentage of the nuclei included was as high as 3.6%, but the percentage of the giant cells was equal to that observed for the syncytial areas (Fig. 3 ).
Fig. 3.

Kinetics of giant cell appearance after the delivery of permeabilizing electric pulses to B16 tumors. B16 tumors were treated as reported in Fig. 1. (A) Percentage of detectable syncytial areas and giant cells. (B) Percentage of nuclei included in syncytial areas and giant cells. Numbers in parentheses correspond to the maximum number of nuclei found in a single giant cell among those counted to establish the percentage of nuclei in giant cells.
Two hours after EP delivery, the percentage of nuclei in both syncytial areas and giant cells as well as the percentage of syncytial areas and giant cells decreased and remained low for at least 3 more hours (Fig. 3A,B). Syncytial areas began to show massive cell death, detected by necrosis as well as by apoptotic changes in nucleus morphology. Finally, syncytial areas were no longer detected after 15 h. On the contrary, no decrease in the number of giant cells and in the number of nuclei per giant cell was observed after 3 and 5 h. Moreover, the limits of the fused cells became progressively more visible and easy to determine. Later, the percentages of giant cells and of nuclei in giant cells sharply increased, reaching a maximum at 10 and 15 h (Fig. 3). In the microscopic fields where counts were performed, the number of fields containing giant cells also increased from 5 out of 18 at 3 h to 16 out of 18 at 15 h. In parallel (Fig. 3), the maximal number of nuclei per giant cell also increased after 5 h, to reach a maximum of 44 nuclei at 15 h (exceptionally, a single giant cell with a still higher number, 64 nuclei, was found at 70 h, as shown in Fig. 1H).
After the high percentages of giant cells and nuclei in them found at 10 and 15 h, a decrease was observed, leading to the presence of 2.5% of nuclei in giant cells and 0.6% of giant cells at 100 h after the treatment (Fig. 2, Fig. 3). At this remote time after EP delivery, most of the giant cells contained only between three and six nuclei per cell.
3.3. Morphological changes within the giant cells
While no change in nuclei distribution was detected at 1 h after the electrical treatment, nuclei in giant cells were progressively found closer and closer at 3 h and later (Fig. 2). After 5 h, they began to display particular distributions resulting in patterns such as those shown in Fig. 1D–F. The cells in which the nuclei formed a circular pearl chain around the center of the cell were similar to those observed in vitro [37] and this nuclei pattern made the detection of the giant cells easy. This distribution became predominant 10h after the treatment. Pronounced eosinophilia of the cytoplasm also facilitated the detection of the fused cells since in general their cytoplasm staining was more homogeneous and more intense than that of the unfused cells.
3.4. Cell death and mitoses occurrence
Fig. 4 shows the percentages of mitoses observed in giant cells at various times after EP delivery. Most of these mitoses were abnormal (multipolar or irregular distribution of chromosomes). They were observed in both large and small multinucleated cells (Fig. 5A–C ). Later on, mitoses were found only in the giant cells possessing a small-sized cytoplasm (thus probably containing a small number of nuclei) even at long times after the treatment. In syncytial areas, at the same time, no mitosis was observed.
Fig. 4.

Kinetics of mitosis occurrence in multinucleated fused cells. B16 tumors were treated as reported in Fig. 1.
Fig. 5.

Morphological aspects of mitosis and cell death (apoptosis) occurring in giant cells. B16 tumors were treated as reported in Fig. 1. (A–C) Mitotic patterns in giant cells at 10 h (A), 25 h (B) and 70 h (C) after EP delivery (×1300). (D) Mitosis and apoptosis occurring in two separate adjacent giant cells at 10 h after EP delivery (×1300). (E,F) Apoptotic patterns in giant cells at 25 h and 70 h after EP delivery (×1300). (G,H) Immunostained cells (using an in situ cell death detection kit) in an untreated control tumor (G) and in a tumor treated at 1350 V/cm, fixed at 25 h (H) (×1300).
Patterns that morphologically resembled apoptotic ones (chromatin condensation at the level of the nuclear envelope) were observed in the giant cells and in the syncytial areas at various times after the electric pulse delivery (Fig. 5D–F). At early times after the electric treatment these patterns were predominantly detected in the syncytial areas. In giant cells apoptotic patterns were detected at times longer than 15 h. Apoptosis was confirmed by immunostaining using an in situ cell death detection kit (Fig. 5G,H).
3.5. Dependence on cell electropermeabilization
In the B16 tumors exposed to electric pulses of only 500 V/cm, only the giant cells were observed (Fig. 6A,B,E,F ) whereas no syncytial areas were found. Moreover, 15 h after EP delivery, giant cells contained only 4.8% of the counted nuclei while at 1350 V/cm giant cells contained 19.9% of the counted nuclei. The number of microscopic fields in which giant cells were detected, was also lower than at 1350 V/cm. For example, at 5 h, 3 out of 18 fields contained giant cells at 500 V/cm, compared to 7 out of 18 at 1350 V/cm, and at 15 h, 9 out of 18 fields at 500 V/cm compared to 16 out of 18 at 1350 V/cm. The permeabilization control, made in parallel on tumors of mice previously injected with 1 mg of bleomycin, revealed a partial permeabilization of the tissue, essentially located in defined areas that could correspond to the location of the giant cells in tumors exposed only to EP (Fig. 6D), suggesting that fusion is indeed related to cell permeabilization, like in vitro [7].
Fig. 6.

Dependence of cell electrofusion on cell electropermeabilization in B16 tumors. B16 tumors were exposed to 8 EP of only 500 V/cm and 100 μs delivered at a frequency of 1 Hz, as described in Section 2. (A,C) Untreated control tumors fixed 70 h after the treatment of the treated tumors (A: ×130; C: ×1300). (B,E,F) Patterns observed in the small areas of the tumors displaying giant cells at 5 h (B,E) or at 15 h (F) after EP delivery (B: ×130; E,F: ×1300). (D) Pseudoapoptotic cells found, at 5 h after the electric treatment, in small areas of tumors of mice injected with 1 mg of bleomycin prior to EP delivery (×1300).
3.6. Tissue dependence of the cell electrofusion
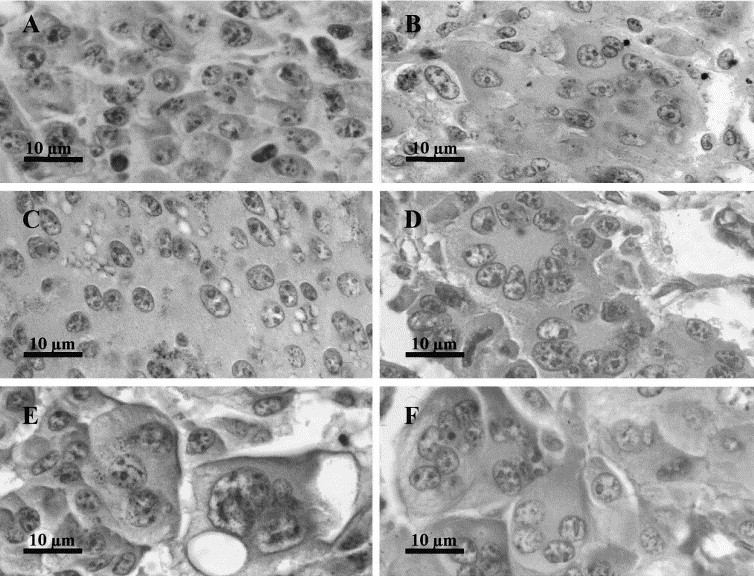
In the LPB fibrosarcomas, the tissue structure is more homogeneous than that of the B16 tumors. Individual cells can be easily identified, even though the plasma membranes are not always clearly visible (Fig. 7A ). The LPB tumors were exposed to the same EP (same voltage to distance ratio, number of pulses, duration of each pulse and frequency of repetition, as well as identical electrode geometry) as those delivered to the B16 tumors. It was shown that these EP really permeabilized the LPB tumor cells, using bleomycin at a high dose as described above (Fig. 7B). Nevertheless, the electropermeabilizing EP did not result in the appearance of any of the particular figures observed in the B16 tumor slices. Indeed, panels C and D in Fig. 7 show that there were no morphological changes under the same conditions that lead to extensive electrofusion in B16 tumors. In order to be sure that the absence of cell electrofusion was not the result of a limited cell permeabilization (see above), higher voltages (2000 V/cm) were also delivered to the LPB fibrosarcomas. Even under these drastic permeabilization conditions, no electrofusion event was detected (Fig. 7E,F).
Fig. 7.

Absence of electrofusion in the LPB fibrosarcoma after the delivery of permeabilizing electric pulses. LPB tumors were exposed to 8 EP of 100 μs and 1350 V/cm or 2000 V/cm, delivered at a frequency of 1 Hz, as described in Section 2. (A) An untreated control tumor fixed 24 h after the treatment of the treated tumors (×1300). (B) Cell electropermeabilization at 1350 V/cm as revealed by the presence of pseudoapoptotic cells found, at 5 h after the electric treatment, in small areas of tumors of mice injected with 1 mg of bleomycin prior to EP delivery (×1300). (C,D) Unfused cells of LPB tumors fixed 5 h (C) or 24 h (D) after electrical treatment at 1350 V/cm (×1300). (E,F) Unfused cells of LPB tumors fixed 5 h (E) or 24 h (F) after electrical treatment at 2000 V/cm (×1300).
A similar search for fusion patterns was also performed in a normal murine tissue, the liver (Fig. 8 ). Liver tissue was chosen because it is a very homogeneous tissue in which histological analysis can be easily performed, and because the amplitude of the electric pulses necessary to achieve a good permeabilization of the liver tissue cells was already determined in rabbits (Miklavcic, Šemrov, Mekid, Mir, submitted for publication) and in rats (Combettes, Tordjmann, Mir, unpublished results). In both rabbits and rats, EP of 500 V/cm to 600 V/cm have been found the most appropriate when using trains of 8 pulses of 100 μs at the frequency of 1 Hz delivered through parallel plates. Control of cell electropermeabilization under our experimental conditions in mice was done using the same test as for the determination of cell electropermeabilization in B16 and LPB tumors, i.e., using high doses of bleomycin injected 4 min before EP delivery (Fig. 8B). No figure corresponding to the electrofusion of hepatocytes was detected either at 5 h (Fig. 8C) or at 24 h after EP delivery (Fig. 8D). A further control was done by pulsing the liver at 1000 V/cm, and still no fusion was observed (Fig. 8E,F).
Fig. 8.
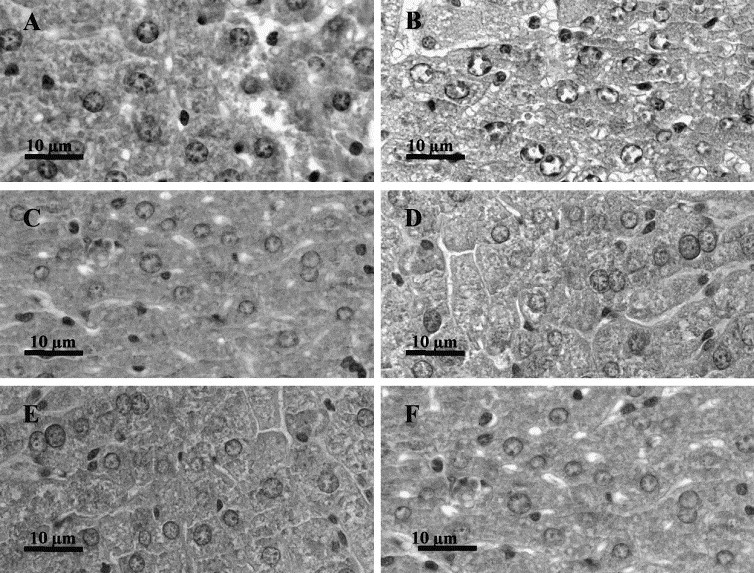
Absence of electrofusion in the liver of the C57Bl/6 mice after the delivery of permeabilizing electric pulses. Liver was exposed to 8 EP of 100 μs and of 500 V/cm delivered at a frequency of 1 Hz as described in Section 2. (A) Untreated liver fixed 24 h after the treatment of the treated liver (×1300). (B) Achievement of cell electropermeabilization at 500 V/cm as revealed by the presence of pseudoapoptotic cells found, at 5 h after the electric treatment, in the liver of mice injected with 1 mg of bleomycin prior to the electric pulse delivery (×1300). (C,D) Unfused cells of livers fixed 5 h (C) or 24 h (D) after electrical treatment at 500 V/cm (×1300). (E,F) Unfused cells of livers fixed 5 h (E) or 24 h (F) after electrical treatment at 1000 V/cm (×1300).
4. Discussion
In the present work, we report the first observation of cell electrofusion in vivo, achieved in the B16 murine melanoma tissue when appropriate EP are delivered locally on the tumor.
In vivo electrofusion observed in B16 melanoma was quite unexpected because in our earlier work on the liver [38] and tumors such as LPB fibrosarcomas [35], [36], we did not observe the cell fusion phenomenon comparable to the typical patterns shown in Fig. 1. In the light of the new results with B16 tumors, we have repeated the experiments on the LPB murine fibrosarcoma and on the normal liver of the syngeneic C57BL/6 mouse, this time carefully examining the possibility of cell fusion. In neither of these two tissues, cell electrofusion patterns were found.
Our observations are somehow reminiscent of the reports dealing with the electrofusion of human dispersed cells deposited in situ on the epithelium of rabbit cornea and submitted to a concomitant mechanical pressure of 600–700 g/cm2 [22], [23]. The method used to show this cell–tissue fusion (scanning electron microscopy) undoubtedly demonstrated exogenous cells fusion to the rabbit tissue, but could not show the potential occurrence of mutual cell fusion between the rabbit corneal cells. However, it is also possible that fusion did not occur between the cells of the corneal epithelial tissue for the same unknown reasons that could explain why electropermeabilized liver cells do not fuse in vivo (see discussion below).
The morphological changes observed in the B16 melanoma tissue exposed to EP are attributable to cell electrofusion, not only because of giant cells appearance (e.g., at 70 h, see Fig. 1) but also because of the extent of these changes, in the tumor volume and the kinetics of these changes.
First, the voltage initially used to treat the tumors was chosen because, in combination with bleomycin, the previously known cytotoxic effects indicated that almost all, if not all the cells were permeabilized after tumor exposure to EP [35], [39], [40]. In parallel, fusion was detected in almost all the sections (16 out of 18 sections examined at 15 h after EP delivery). Previous experiments have also shown that the B16 tumors were only weakly affected by bleomycin when pulses of an amplitude of 500 V/cm were used. Thus we were expecting that only few cells were permeabilized at this low amplitude, instead of a large majority of the cells at 1350 V/cm. We confirmed this situation using the permeabilization test based on the effects of high doses of bleomycin on the electropermeabilized cells. In agreement with the non-homogeneity of the electric field distribution when plate electrodes are applied over a more or less spherical tumor (the highest amplitude of local electric amplitudes being found the closest to the electrodes, model not shown), permeabilization was observed only in restricted areas. In parallel, at 500 V/cm, patterns revealing cell electrofusion in B16 tumors (Fig. 6) were not detected on the whole of the tumors sections, but only in defined regions that could correspond to the parts of the tumors which were permeabilized. Thus, in combination with the facts that (i) the number of nuclei per giant cell at 15 h using pulses of 500 V/cm was just one fourth of the number of nuclei detected using pulses of 1350 V/cm, and that (ii) syncytial areas were not detected at 500 V/cm, it can be concluded that, as expected from the theory and the in vitro results, extent of in vivo electrofusion seems to be closely related to the extent of cell electropermeabilization.
Second, it is known that, both in vitro and in vivo, permeabilization is an immediate process occurring at the time of EP delivery. It is interesting to note that in the B16 tissue exposed to the permeabilizing electric pulses the disappearance of the limits between adjacent cells was already detected at the earliest time analyzed (1 h). At that time, no change in nuclei distribution in the overall B16 tissue was detectable. Later on, nuclei distribution in the tissue changed, separation between the cells became clear, and it was possible to detect typical giant cells similar to those obtained after cell fusion in vitro [37]. The nuclei were either all located in one group in the center of the cell, or located at the cell periphery, forming a circular pearl chain around the center of the cell. In both cases, the stain of the cytoplasm was more homogeneous and intense. The first signs of nuclei redistribution were observed at 3 h after EP delivery. Ten hours after EP, the morphological changes were completed. These morphological changes thus occurred very slowly with respect to the initial membrane perturbation, like in vitro, where it was shown that the completion of the process requires several hours and corresponds to large rearrangements of the cytoskeleton [21].
Thus, in vivo and in vitro cell electrofusion are comparable events in the sequence as well as in the kinetics of the morphological changes observed. Since it is known that electric field distribution in tissues is not homogeneous [25], the results obtained can be explained in the following way:
-
•
at very short times after EP delivery, syncytial areas could be interpreted as the result of the disappearance of plasma membranes between the B16 cells in the tumor regions exposed to the higher local electric field values;
-
•
in the regions exposed to intermediary local electric field values, membrane alteration was lower: fusion resulted in the formation of giant cells, a process that required important morphological changes and that could take several hours before being detectable;
-
•
as expected, in the regions exposed to the lowest local electric field values, no fusion occurred and the B16 cells resumed their proliferation.
However, permeabilization, even if necessary, is not sufficient to obtain in vivo cell electrofusion. Indeed, tissue dependence seems to be a factor more important than cell electropermeabilization because, whatever the level of cell electropermeabilization (and thus of membrane perturbation) achieved, no electrofusion occurred in another tumor in the C57Bl/6 mice, or in a normal tissue such as liver. In the case of the LPB fibrosarcoma, even the large membrane perturbation supposed to be provoked at 2000 V/cm was unable to result in LPB cells electrofusion. Thus the observed electrofusion could be a property of the experimental melanoma used. It will be important to test the occurrence of cell electrofusion in other experimental or spontaneously arousing melanomas to understand the link of our observations either in general with the melanoma malignant transformation or in particular with the B16 melanoma. To our knowledge there is no report on fusions in mammalian tissues other than developmental fusions, such as the myoblast transforming into myotubes, or pathological fusions, like the generation of multinucleated giant cells, a characteristic feature of tuberculosis granulomas formed by the fusion of monocytes or macrophages [37].
One reasonable explanation of the differences observed between B16 and LPB tumors, as well as between B16 and normal liver, could rely on proteases release by the B16 cells:
-
•
On the one hand, it is known that melanoma tumors are prone to produce abundant metastatic dissemination. Metastatic potential is related to proteases secretion in the environment, that facilitates the escaping of the tumor cells from the original nodule, their migration and their spreading, and that allows tumor cells invasion of new tissues through the dissociation of normal tissue structure. It is important to note that, contrary to B16 tumors, the LPB tumors do not generate metastases (unpublished data).
-
•
On the other hand, cell treatment by trypsin (5 or 10 min at 37°C and 1 mg/ml) or pronase (5 min at 21°C or 10 min at 37°C and 20 μg/ml) resulted in a net increase of fusion yields in plated CHO cells in vitro [41]. Dispase, pronase and trypsin also facilitated the fusion of cells in suspension [42]. More recently, it has also been reported that addition of pepsin, pronase E or lysozyme leads to an increase in yields of electropermeabilization and electrofusion in U937 cells in vitro [43]. Moreover, hepatocytes isolated by collagenase treatment of the liver could be electrofused in vitro [44].
Therefore, the in vivo electrofusion of B16 cells could result from the presence of proteases in the interstitial fluid, a fact potentially linked to the B16 melanoma ability to produce metastases. The presence of proteases should reduce the extracellular matrix, the physical barrier that, by preventing the close contact of the lipid bilayers from two adjacent cells, is obviously a major obstacle to cell fusion in vivo. The absence of extracellular matrix as a factor allowing for in vitro cell–cell electrofusion was already pointed out previously in experiments in vitro [45].
The kinetics of giant cells presence in the electrically treated tissues could be explained by the occurrence of cell death and mitoses observed in these giant cells. B16 cells in control tumors not exposed to the electric pulses constitute a tissue rapidly renewing the cells that presents a level of mitoses of 4%, as well as a level of spontaneous cell death by apoptosis of 3% (H. Mekid et al., unpublished data). Fusion of cells in vivo does not seem to interfere with the entry of giant cells into mitosis. However, as one could expect, these multinucleated cells present aberrant mitotic patterns (Fig. 5). The (pseudo)normal mitotic patterns observed in the small multinucleated cells can explain the persistence of multinucleated cells even at 100 h after EP delivery, while the decrease in the percentage of both the number of giant cells and the number of nuclei per giant cell after the peaks observed at 15 h could result from the cell death in the large multinucleated cells illustrated by Fig. 5.
In summary, with respect to the well-established in vitro cell–cell electrofusion methodology and to the cell–tissue ex vivo and in vivo methods developed by Grasso and Heller [29], [30], [31], the new results here reported show that cell electrofusion may also occur within tissues in vivo exposed to EP. Particular microenvironmental conditions, like the existence of reduced extracellular matrices because of the presence of high levels of proteases in the interstitial medium, could be responsible for electrofusion in these tissues. Therefore, in the rapidly developing biomedical applications of in vivo electropermeabilization, some attention must be paid to the potential occurrence of cell electrofusion in the target tissue.
On the one hand, the influence of this effect on the global efficacy of DNA electrotransfer for gene therapy requires further investigation. On the other hand, the possible link between ability to metastasize and electrofusogeneity could have interesting implications in cancer treatment. Indeed, electric pulses are already used in electrochemotherapy to efficiently introduce hydrophilic cytotoxic drugs (such as bleomycin or cisplatinum) into the tumor cells. If the cells with the highest metastatic potential in the tumor cell population are fused inside the tumor, then their spreading could be reduced. Obviously, these giant cells should be subject to cell death because their electropermeabilization, which generated their fusion, should also permit cytotoxic drug uptake. However, in the case of a non-homogeneous distribution of the cytotoxic drug, or of an insufficient local supply, cell death could also occur in the cells not loaded with the drug, because, as shown here, mitoses in giant cells are altered and the death of cells in syncytial areas is triggered even in absence of cytotoxic drugs. Thus, cell electrofusion could be an important advantage of the in vivo delivery of EP to metastasizing tumors.
Acknowledgements
We are grateful to Dr T. Kotnik, Dr S. Orlowski and Dr J. Belehradek Jr. for critical reading of the manuscript, fruitful discussions and linguistic revision of the manuscript. We thank Dr M. C̆emaz̆ar for her initial participation in observation of B16 tumors. We are indebted to Dr A. Spatz, Dr J.C. Sabourin, Professor P. Duvillard and the technical staff of the Département d’Anatomo-Pathologie of the Institut Gustave-Roussy (IGR), and P. Opolon from UMR 1582 CNRS-IGR, for their contribution to the histological analysis, as well as to E. Connault for her technical advice. We also thank the staff of the Service Commun d’Expérimentation Animale of the IGR for animal maintenance. H.M. was supported by a studentship from the Johnson and Johnson company. The work of the authors was essentially supported by the Centre National de la Recherche Scientifique (CNRS) and the IGR.
References
- 1.Nickel W., Weber T., McNew J.A., Parlati F., Sollner T.H., Rothman J.E. Proc. Natl. Acad. Sci. USA. 1999;96:12571–12576. doi: 10.1073/pnas.96.22.12571. [DOI] [PMC free article] [PubMed] [Google Scholar]
- 2.Jahn R., Südhof T.C. Annu. Rev. Biochem. 1999;68:863–911. doi: 10.1146/annurev.biochem.68.1.863. [DOI] [PubMed] [Google Scholar]
- 3.Luo Z., Weiss S.R. Virology. 1998;244:483–494. doi: 10.1006/viro.1998.9121. [DOI] [PMC free article] [PubMed] [Google Scholar]
- 4.Welgert R., Silletta M.G., Spano S., Turaccio G., Cericola C., Colanzi A., Senatore S., Mancini R., Polishchuck E.V., Salmona M., Facchiano F., Burger K.N.J., Mironov A., Luini A., Corda D. Nature. 1999;402:429–433. doi: 10.1038/46587. [DOI] [PubMed] [Google Scholar]
- 5.Neil G.A., Zimmermann U. Methods Enzymol. 1993;220:174–196. doi: 10.1016/0076-6879(93)20082-e. [DOI] [PubMed] [Google Scholar]
- 6.Okada Y. Exp. Cell Res. 1962;26:98–107. doi: 10.1016/0014-4827(62)90205-7. [DOI] [PubMed] [Google Scholar]
- 7.Teissié J., Ramos C. Biophys. J. 1998;74:1889–1898. doi: 10.1016/S0006-3495(98)77898-1. [DOI] [PMC free article] [PubMed] [Google Scholar]
- 8.Neumann E., Kakorin S., Toensing K. Bioelectrochem. Bioenerg. 1999;48:3–16. doi: 10.1016/s0302-4598(99)00008-2. [DOI] [PubMed] [Google Scholar]
- 9.Rols M.P., Teissié J. Biophys. J. 1990;58:1089–1098. doi: 10.1016/S0006-3495(90)82451-6. [DOI] [PMC free article] [PubMed] [Google Scholar]
- 10.Orlowski S., Mir L.M. Biochim. Biophys. Acta. 1993;1154:51–63. doi: 10.1016/0304-4157(93)90016-h. [DOI] [PubMed] [Google Scholar]
- 11.Mir L.M., Orlowski S., Belehradek J., Jr., Teissié J., Rols M.P., Serša G., Miklavc̆ic̆ D., Gilbert R., Heller R. Bioelectrochem. Bioenerg. 1995;38:203–207. [Google Scholar]
- 12.Zimmermann U. Biochim. Biophys. Acta. 1982;694:227–277. doi: 10.1016/0304-4157(82)90007-7. [DOI] [PubMed] [Google Scholar]
- 13.Teissié J., Rols M.P. Bioelectrochem. Bioenerg. 1988;19:59–66. [Google Scholar]
- 14.Hewish D.R., Werkmeister J.A. J. Immunol. Methods. 1989;120:285–289. doi: 10.1016/0022-1759(89)90254-8. [DOI] [PubMed] [Google Scholar]
- 15.Teissié J., Knutson V.P., Tsong T.Y., Lane M.D. Science. 1982;216:537–538. doi: 10.1126/science.7071601. [DOI] [PubMed] [Google Scholar]
- 16.Teissié J., Conte P. Bioelectrochem. Bioenerg. 1988;19:49–57. [Google Scholar]
- 17.Finaz C., Lefevre A., Teissié J. Exp. Cell Res. 1984;150:477–482. doi: 10.1016/0014-4827(84)90592-5. [DOI] [PubMed] [Google Scholar]
- 18.Maurel P., Gualandris-Parisot L., Teissié J., Duprat A.M. Exp. Cell Res. 1989;184:207–218. doi: 10.1016/0014-4827(89)90378-9. [DOI] [PubMed] [Google Scholar]
- 19.Teissié J., Rols M.P. Biochem. Biophys. Res. Commun. 1986;140:258–266. doi: 10.1016/0006-291x(86)91084-3. [DOI] [PubMed] [Google Scholar]
- 20.Abidor I.G., Barbul A.I., Zhelev D.V., Doinov P., Bandrina I.N., Osipova E.M., Sukharev S.I. Biochim. Biophys. Acta. 1993;1152:207–218. doi: 10.1016/0005-2736(93)90251-t. [DOI] [PubMed] [Google Scholar]
- 21.Blangero C., Rols M.P., Teissié J. Biochim. Biophys. Acta. 1989;981:295–302. doi: 10.1016/0005-2736(89)90040-0. [DOI] [PubMed] [Google Scholar]
- 22.Grasso R.J., Heller R., Cooley J.C., Heller E.M. Biochim. Biophys. Acta. 1989;980:9–14. doi: 10.1016/0005-2736(89)90193-4. [DOI] [PubMed] [Google Scholar]
- 23.Heller R., Grasso R.J. Biochim. Biophys. Acta. 1990;1024:185–188. doi: 10.1016/0005-2736(90)90223-b. [DOI] [PubMed] [Google Scholar]
- 24.Heller R. Anal. Biochem. 1992;202:286–292. doi: 10.1016/0003-2697(92)90107-i. [DOI] [PubMed] [Google Scholar]
- 25.Belehradek J., Jr., Orlowski S., Ramirez L.H., Pron G., Poddevin B., Mir L.M. Biochim. Biophys. Acta. 1994;1190:155–163. doi: 10.1016/0005-2736(94)90045-0. [DOI] [PubMed] [Google Scholar]
- 26.Gehl J., Sørensen T.H., Nielsen K., Raskmark P., Nielsen S.L., Skovsgaard T., Mir L.M. Biochim. Biophys. Acta. 1999;1428:233–240. doi: 10.1016/s0304-4165(99)00094-x. [DOI] [PubMed] [Google Scholar]
- 27.Gehl J., Mir L.M. Biochem. Biophys. Res. Commun. 1999;261:377–380. doi: 10.1006/bbrc.1999.1014. [DOI] [PubMed] [Google Scholar]
- 28.Engstrom P.E., Persson B.R.R., Salford L.G. Bioelectrochem. Bioenerg. 1998;46:241–248. [Google Scholar]
- 29.Mir L.M., Glass F.L., Serša G., Teissié J., Domenge C., Miklavc̆ic̆ D., Jaroszeski M.J., Orlowski S., Reintgen D.S., Rudolf Z., Belehradek M., Gilbert R., Rols M.P., Belehradek J., Jr., Bachaud J.M., DeConti R., S̆tabuc B., Coninx P., C̆emaz̆ar M., Heller R. Br. J. Cancer. 1998;77:2336–2342. doi: 10.1038/bjc.1998.388. [DOI] [PMC free article] [PubMed] [Google Scholar]
- 30.Mir L.M., Orlowski S. Adv. Drug Deliv. Rev. 1999;35:107–118. doi: 10.1016/s0169-409x(98)00066-0. [DOI] [PubMed] [Google Scholar]
- 31.Rols M.P., Delteil C., Golzio M., Dumond P., Cros S., Teissié J. Nat. Biotechnol. 1998;16:168–171. doi: 10.1038/nbt0298-168. [DOI] [PubMed] [Google Scholar]
- 32.Mir L.M., Bureau M.F., Gehl J., Rangara R., Rouy D., Caillaud J.M., Delaere P., Branellec D., Schwartz B., Scherman D. Proc. Natl. Acad. Sci. USA. 1999;96:4262–4267. doi: 10.1073/pnas.96.8.4262. [DOI] [PMC free article] [PubMed] [Google Scholar]
- 33.Niu G., Heller R., Catlett-Falcone R., Coppola D., Jaroszeski M., Dalton W., Jove R., Yu H. Cancer Res. 1999;59:5059–5063. [PubMed] [Google Scholar]
- 34.Belehradek J., Jr., Barski G., Thonier M. Int. J. Cancer. 1972;9:461–469. doi: 10.1002/ijc.2910090302. [DOI] [PubMed] [Google Scholar]
- 35.Mir L.M., Orlowski S., Belehradek J., Jr., Paoletti C. Eur. J. Cancer. 1991;2:68–72. doi: 10.1016/0277-5379(91)90064-k. [DOI] [PubMed] [Google Scholar]
- 36.Mir L.M., Roth C., Orlowski S., Quintin-Colonna F., Fradelizi D., Belehradek J., Jr., Kourilsky P. J. Immunother. 1995;17:30–38. doi: 10.1097/00002371-199501000-00004. [DOI] [PubMed] [Google Scholar]
- 37.Gasser A., Möst J. Infect. Immun. 1999;67:395–402. doi: 10.1128/iai.67.1.395-402.1999. [DOI] [PMC free article] [PubMed] [Google Scholar]
- 38.Ramirez L.H., Orlowski S., An D.J., Bindoula G., Djodic R., Bognel C., Belehradek J., Jr., Munck J.N., Mir L.M. Br. J. Cancer. 1998;77:2104–2111. doi: 10.1038/bjc.1998.354. [DOI] [PMC free article] [PubMed] [Google Scholar]
- 39.Serša G., C̆emaz̆ar M., Miklavc̆ic̆ D., Mir L.M. Bioelectrochem. Bioenerg. 1994;35:23–27. [Google Scholar]
- 40.Heller R., Jaroszeski M., Leo-Messina J., Perrot R., Van Voorhis N., Reintgen D., Gilbert R. Bioelectrochem. Bioenerg. 1995;36:83–88. [Google Scholar]
- 41.Rols M.P., Teissié J. Biochemistry. 1990;29:4561–4567. doi: 10.1021/bi00471a009. [DOI] [PubMed] [Google Scholar]
- 42.Ohno-Shosaku T., Okada Y. Biochem. Biophys. Res. Commun. 1984;120:138–143. doi: 10.1016/0006-291x(84)91424-4. [DOI] [PubMed] [Google Scholar]
- 43.Velizarov S., Berg H. Bioelectrochem. Bioenerg. 1998;46:263–265. [Google Scholar]
- 44.Teissié J., Reynaud J.A., Nicolau C. Bioelectrochem. Bioenerg. 1986;17:9–15. [Google Scholar]
- 45.Sukharev S.I., Bandrina I.N., Barbul A.I., Fedorova L.I., Abidor I.G., Zelenin A.V. Biochim. Biophys. Acta. 1990;1034:125–131. doi: 10.1016/0304-4165(90)90065-5. [DOI] [PubMed] [Google Scholar]