Abstract
BACKGROUND:
Health care worker (HCW) safety is of pivotal importance during a pandemic such as coronavirus disease 2019 (COVID-19), and employee health and well-being ensure functionality of health care institutions. This is particularly true for an intensive care unit (ICU), where highly specialized staff cannot be readily replaced. In the light of lacking evidence for optimal staffing models in a pandemic, we hypothesized that staff shortage can be reduced when staff scheduling takes the epidemiology of a disease into account.
METHODS:
Various staffing models were constructed, and comprehensive statistical modeling was performed. A typical routine staffing model was defined that assumed full-time employment (40 h/wk) in a 40-bed ICU with a 2:1 patient-to-staff ratio. A pandemic model assumed that staff worked 12-hour shifts for 7 days every other week. Potential in-hospital staff infections were simulated for a total period of 120 days, with a probability of 10%, 25%, and 40% being infected per week when at work. Simulations included the probability of infection at work for a given week, of fatality after infection, and the quarantine time, if infected.
RESULTS:
Pandemic-adjusted staffing significantly reduced workforce shortage, and the effect progressively increased as the probability of infection increased. Maximum effects were observed at week 4 for each infection probability with a 17%, 32%, and 38% staffing reduction for an infection probability of 0.10, 0.25, and 0.40, respectively.
CONCLUSIONS:
Staffing along epidemiologic considerations may reduce HCW shortage by leveling the nadir of affected workforce. Although this requires considerable efforts and commitment of staff, it may be essential in an effort to best maintain staff health and operational functionality of health care facilities and systems.
KEY POINTS.
Question: Is coronavirus disease 2019 (COVID-19) incubation time-based staffing of benefit with regard to reducing the number of infected health care workers (HCWs)?
Findings: Comprehensive statistical modeling reveals significant reduction of intensive care unit (ICU) staff shortage due to infection when both incubation and quarantine times of COVID-19 are considered.
Meaning: Scheduling ICU staff according to the epidemiological characteristics of a pandemic may reduce the number of infected staff and may increase the chances of operational functionality of health care facilities and systems.
Health care worker (HCW) safety is pivotal during a pandemic such as coronavirus disease 2019 (COVID-19) to maintain operational functionality of health care systems. In late December 2019, an outbreak of severe acute respiratory syndrome coronavirus 2 (SARS-CoV-2) was reported in the Hubei Province of China. With a median incubation time of 3 days (range 0–24 days) and mean incubation time of 5 days,1,2 the predominantly respiratory droplet transmitted disease spread at a high rate to a global level. On March 12, 2020, the World Health Organization (WHO) formally declared the COVID-19 outbreak a pandemic.
Despite its primary transmission route (ie, human–human transmission via respiratory droplets and/or aerosols), the virus remains active and infectious for hours in aerosols and for few several days on surfaces.3 Importantly, both public and HCW health is affected, causing a global shortage of HCWs because quarantine for infected individuals is recommended for a period of 14 days.4 This is a particular threat to patient outcomes in the intensive care unit (ICU) setting because ICU staff (physicians, nurses, and respiratory therapists) are highly specialized and cannot readily be replaced.
Evidence providing guidance for HCW staffing in ICUs and other acute care services under regular (nonpandemic) conditions is abundant and mainly focuses on economics and outcome quality.5,6 Data in pandemic situations, such as currently with COVID-19, are far more sparse, and only a few authors have suggested that institutions should “allow isolation teams to have a 2-week, off-duty observation period (“washout” period), after every period of ward cover if manpower allows.”7
However, an additional qualified workforce to implement respective policies is typically not available, and optimal HCW staffing strategies remain unclear. We therefore aimed to study the dynamics of staff shortages over time under usual scheduling compared to a schedule adapted to disease epidemiology, specifically that of COVID-19. This is done to optimize schedules and to allow for optimal allocation of staff resources, which is crucial for maintaining a maximum of work power during a pandemic crisis, to ensure ICU capacity, and to save the lives of those most severely affected by the COVID-19 pandemic.
We hypothesized that HCW shortage could be reduced when shift models adjusted to specific disease epidemiology such as COVID-19 are implemented by adapting working hours and periods of “off time,” during which staff are quarantined at home such that they cannot readily be infected during this dedicated off time.
Methods
This study uses publicly available epidemiologic data about COVID-19 and does not involve any clinical or patient derived data. No waiver from an institutional review board or research ethical committee was required.
To study the dynamics of staff dropouts over time for different scheduling strategies, we defined 2 theoretical scenarios (Table 1), of which one is typical routine staffing according to a theoretical labor law (scenario A) as applicable in this or similar form in most Western health care systems, and the other following the characteristics of a pandemic virus including both its incubation period and different quarantine times (scenario B). While the recommended quarantine time of 14 days would require extensive additional qualified workforce, which is likely not readily available in most hospitals, an abbreviated quarantine of 7 days covers the median incubation time of 3 days (range 0–24 days) and mean of 5 days, allowing for testing before starting into a new cycle of shifts.
Table 1.
Staffing Scenarios in Routine and Pandemic Times
| Scenario | On-Duty per 7 d | Off-Duty | Quarantine if Infected |
|---|---|---|---|
| A (routine) | 5 × 8 h shifts (3 shifts per 24 h) | 2 shifts during week | 2 or 3 wk |
| B (pandemic)a | 7 × 12 h shifts (2 shifts per 24 h) | 1 wk off | 2 or 3 wk |
Workforce
We assumed an exemplary workforce of 84 HCWs per scenario, all of whom are working on a full-time basis (40 h/wk). Assuming a 40-bed ICU and a patient-to-staff ratio of 2:1, we require 20 staff members to be present at all times (7 × 24 h). With this starting position, we define 2 potential scenarios of in-hospital infection, including a COVID-19 infection probability of 10%, 25%, or 40% per week, over a period of 120 days. The reported duration of COVID-19 infection ranges from 15 to 21 days.8 Based on reported mortality rates of a range of 1%–15% for infected individuals,9 we assume that 99% of affected HCWs will be able to return to work 14–21 days after diagnosis, whereas 3%–10% will not return.
Scenarios
Scenario A.
The regular 40-hour per week schedule requires 168 total hours ÷ 40 hours per staff = 4.2 full-time staff member per week, in order for a single staff member to be present at all times. Based on our 2:1 patient-to-staff ratio assumption, this requires 4.2 × 20 = 84 staff members for each week. For the second week, we assume the same 84 staff members would be scheduled, assuming no infections.
Scenario B.
Each staff member works 7 days × 12 h/d = 84 hours for the first week, are then quarantined for the second week, and then repeat (third week on, fourth week off, etc). This scenario thus requires 168 total hours of coverage ÷ 84 hours of coverage per staff member = 2.0 full-time employees for every 20 patients during week 1 of a 2-week period. We would thus need 2.0 × 20 = 40 total staff members for week 1 and another, a completely separate 40 staff members for week 2 (when week 1 staff is quarantined), for a total of 80 staff members. This is 5% less staffing than required for scenario A. We report results as the percent of the starting work force (not the actual numbers) that is present for each week, so that a perceived benefit for scenario B will have been achieved with slightly fewer staff than scenario A. When a staff member in scenario B is off work (every other week, quarantined at home), we assume they are not at risk for COVID-19.
Simulations
We conducted simulations varying the probability of becoming infected with COVID-19 when at work for a given week (10%, 25%, and 40%), the probability of dying after being infected with COVID-19 (10%, 3%, and 1%), and the quarantine time if infected with COVID-19 (3 and 2 weeks). A staff member was assumed to be immune for the duration of the 120 days after recuperating from an infection.
For both scenarios, each staff member was assigned a single probability of being infected each week at work as a random draw from a binomial distribution with the given underlying probability (10%, 25%, or 40%). Whether a staff member became infected in a given week was then determined by a random draw from the Bernoulli distribution using the staff member’s randomly drawn probability of being infected. Likewise, whether or not a staff member died after infection was determined by a random draw from the Bernoulli distribution at 10%, 3%, or 1%, depending on the simulation. After becoming infected, a staff member was considered to be away from work and quarantined for 2 or 3 weeks, depending on the simulation, unless they died. Five hundred simulations were run for each variation of the parameters of interest.
The primary outcome was the percentage of initial staff members who were at work for each of the 17 weeks (120 days). Scenarios A and B were compared on the percentage of HCWs at work during each week. Note that while we are assuming a 40-bed ICU with a patient-to-staff ratio of 2:1 for illustrative purposes, the estimated percentage of initial staff that is at work would apply to any ICU in which the staffing scheme is applied.
Results
Our main simulations in Figures 1–3, using a 3-week quarantine period after infection, show workforce savings due to rotating staff each week (scenario B) for each infection probability, and most noticeably in the first 6–10 weeks. The effect progressively increases as the probability of infection increases from 0.10 to 0.25 to 0.40. Table 2 details the absolute savings in the workforce by comparing the scenarios on the percentage working at each week. For example, the maximum effect for scenario B occurred at week 4 for each infection probability: 17% savings for infection probability of 0.10, 32% for probability of 0.25, and 38% for probability 0.40. In each case, the scenarios equalized toward the end of the 17-week period because most staff had been infected, recovered, and returned back to the work force.
Figure 1.
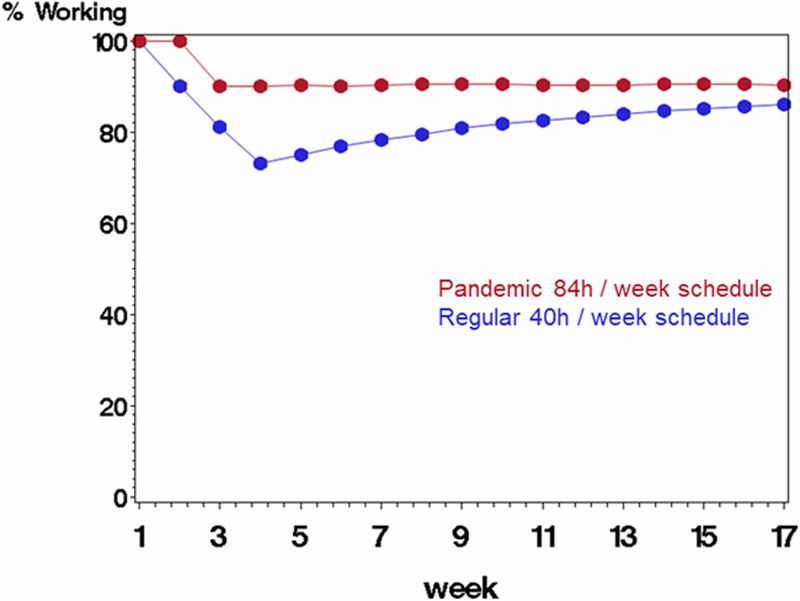
Comparing scenario B (rotating staff each week in a pandemic schedule with 84 h/wk followed by 1 wk off, displayed in red) with scenario A (regular schedule with 40 h/wk, displayed in blue) on percentage of starting work force available to work each week. The average probability of being infected at work was 0.10 (each staff member’s probability was a random draw from the underlying probability), and probability of mortality if infected was 10%. Infected staff were quarantined for 3 wk before returning to work.
Figure 3.
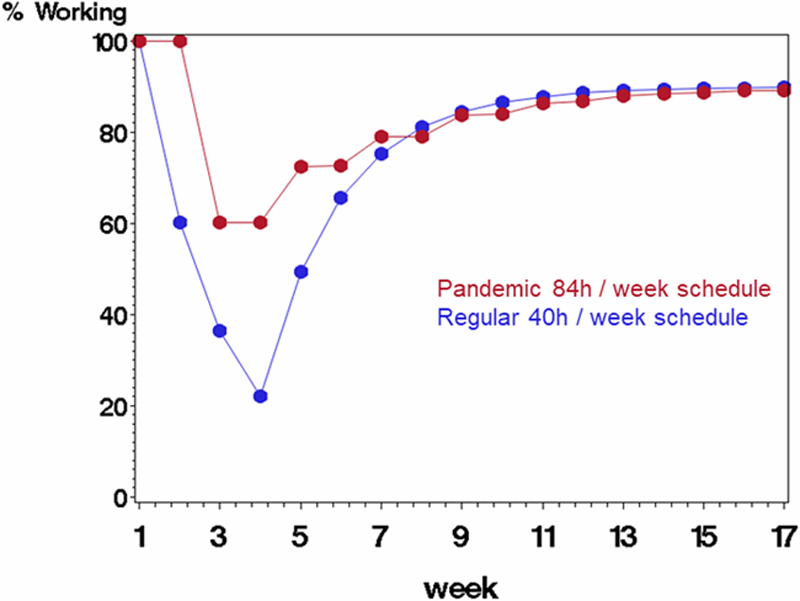
Comparing scenario B (rotating staff each week in a pandemic schedule with 84 h/wk followed by 1 wk off, displayed in red) with scenario A (regular schedule with 40 h/wk, displayed in blue) on percentage of starting work force available to work each week. The average probability of being infected at work was 0.40 (each staff member’s probability was a random draw from the underlying probability), and probability of mortality if infected was 10%. Infected staff were quarantined for 3 wk before returning to work.
Table 2.
Labor Sparing Using Rotating Weeks (B) and Standard (A): 3-wk Quarantine After Infection
| Infection | 0.10 | 0.25 | 0.40 | ||||||
|---|---|---|---|---|---|---|---|---|---|
| Mortality | 0.10 | 0.10 | 0.10 | ||||||
| % Working | Savings | % Working | Savings | % Working | Savings | ||||
| Week | A | B | A | B | A | B | |||
| 1 | 100.0 | 100.0 | 0.0 | 100.0 | 100.0 | 0.0 | 100.0 | 100.0 | 0.0 |
| 2 | 90.0 | 100.0 | 10.0 | 74.7 | 100.0 | 25.3 | 60.3 | 100.0 | 39.7 |
| 3 | 81.1 | 90.0 | 8.9 | 56.6 | 74.3 | 17.7 | 36.4 | 60.1 | 23.7 |
| 4 | 73.1 | 90.0 | 16.9 | 42.7 | 75.2 | 32.5 | 22.1 | 60.1 | 38.0 |
| 5 | 75.1 | 90.2 | 15.1 | 55.0 | 79.0 | 24.0 | 49.3 | 72.4 | 23.1 |
| 6 | 76.8 | 90.2 | 13.4 | 63.7 | 79.0 | 15.3 | 65.7 | 72.7 | 7.1 |
| 7 | 78.4 | 90.3 | 12.0 | 70.5 | 82.1 | 11.6 | 75.3 | 79.1 | 3.8 |
| 8 | 79.5 | 90.5 | 11.0 | 75.5 | 81.8 | 6.3 | 81.1 | 79.1 | −2.0 |
| 9 | 80.8 | 90.6 | 9.8 | 78.9 | 84.4 | 5.5 | 84.5 | 83.7 | −0.7 |
| 10 | 81.8 | 90.6 | 8.8 | 81.6 | 84.2 | 2.6 | 86.6 | 83.9 | −2.7 |
| 11 | 82.6 | 90.4 | 7.8 | 83.6 | 85.7 | 2.1 | 87.8 | 86.2 | −1.6 |
| 12 | 83.3 | 90.4 | 7.1 | 85.0 | 85.5 | 0.5 | 88.6 | 86.8 | −1.7 |
| 13 | 84.0 | 90.4 | 6.4 | 86.1 | 86.8 | 0.7 | 89.1 | 87.9 | −1.2 |
| 14 | 84.6 | 90.6 | 5.9 | 86.9 | 86.9 | 0.0 | 89.4 | 88.4 | −1.0 |
| 15 | 85.2 | 90.6 | 5.4 | 87.6 | 87.4 | −0.2 | 89.6 | 88.7 | −1.0 |
| 16 | 85.6 | 90.6 | 5.0 | 88.1 | 87.3 | −0.8 | 89.7 | 89.1 | −0.6 |
| 17 | 86.1 | 90.4 | 4.2 | 88.6 | 88.3 | −0.2 | 89.8 | 89.2 | −0.6 |
| Mean (SD) | 8.7 (4.2) | 8.4 (10.7) | 7.2 (14.4) | ||||||
| Reference | Figure 1 | Figure 2 | Figure 3 | ||||||
Quarantine: number of weeks a staff member stays off of work after being infected. Infection: probability of an uninfected staff becoming infected in a given week at work. Mortality: probability of an infected staff member succumbing to the coronavirus. % working: Percentage of starting staff working for the given week. Savings: absolute difference between scenario B (rotating weeks, 7–12 h shifts) and scenario A (standard 8-h shifts each week). Scenarios rotating weeks (B) and standard (A) are compared on the absolute difference for each week in the percentage of the starting labor force. We assume infection probabilities of 0.10, 0.25, and 0.40, a 2-wk sick leave for infected staff who survive, and a mortality probability of 0.10. The Table shows numerical results from Figures 1–3.
Abbreviation: SD, standard deviation.
Figure 2.
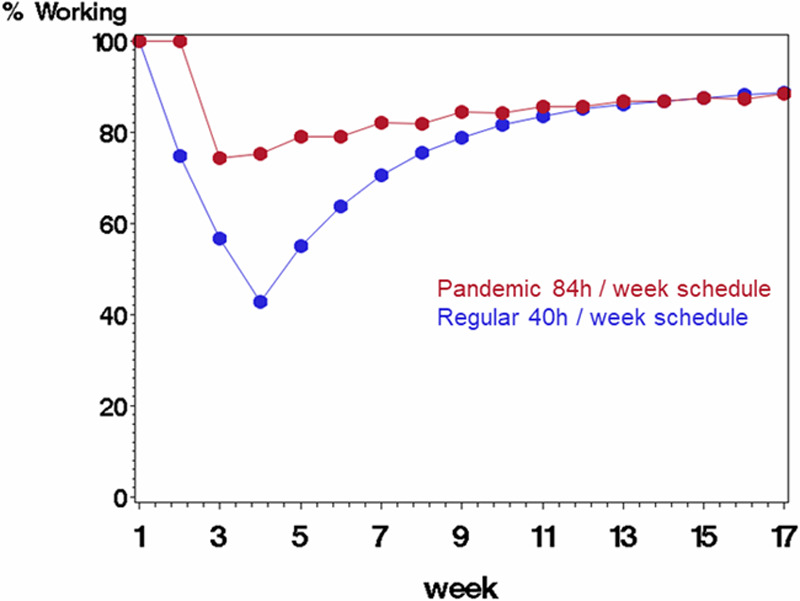
Comparing scenario B (rotating staff each week in a pandemic schedule with 84 h/wk followed by 1 wk off, displayed in red) with scenario A (regular schedule with 40 h/wk, displayed in blue) on percentage of starting work force available to work each week. The average probability of being infected at work was 0.25 (each staff member’s probability was a random draw from the underlying probability), and probability of mortality if infected was 10%. Infected staff were quarantined for 3 wk before returning to work.
Second, we conducted simulations analogous to the main simulations above, but assuming a 3% mortality probability after infection instead of 10%. Results were very similar to the primary findings (Supplemental Digital Content, Figures 1–3, Table 1, http://links.lww.com/AA/D81). Additionally, assuming a 1% mortality probability after infection was assessed. Results were also very similar to the primary findings (Supplemental Digital Content, Figures 4–6, Table 2, http://links.lww.com/AA/D81).
Figure 5.
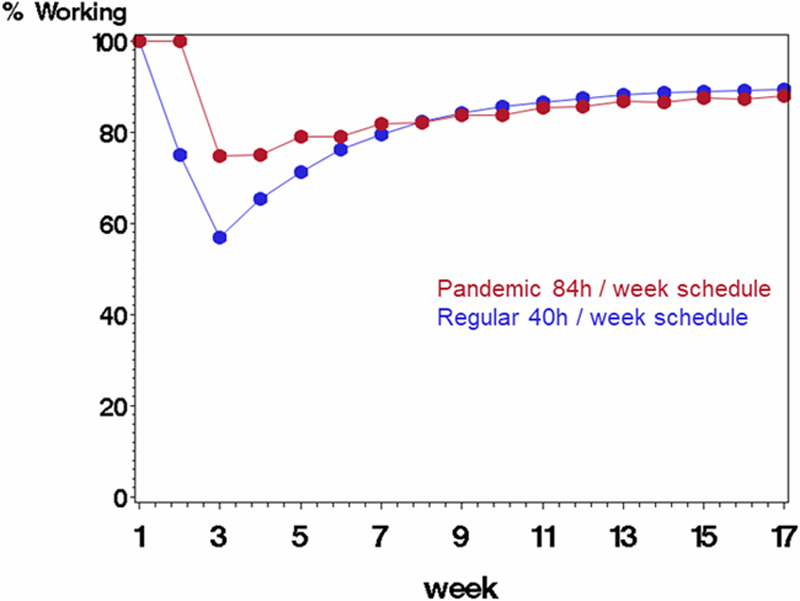
Comparing scenario B (rotating staff each week in a pandemic schedule with 84 h/wk followed by 1 wk off, displayed in red) with scenario A (regular schedule with 40 h/wk, displayed in blue) on percentage of starting work force available to work each week. The average probability of being infected at work was 0.25, and probability of mortality if infected was 10%. Infected staff were quarantined for 2 wk before returning to work.
Third, simulation results assuming a 2-week (instead of 3-week) quarantine period are shown in Figures 4–6. We still observe effects due to the staff rotations in scenario B, and in a similar pattern as for the primary aim, but to a lesser extent. With a 2-week quarantine period, the maximum savings occur earlier in the first few months (Table 3).
Figure 4.
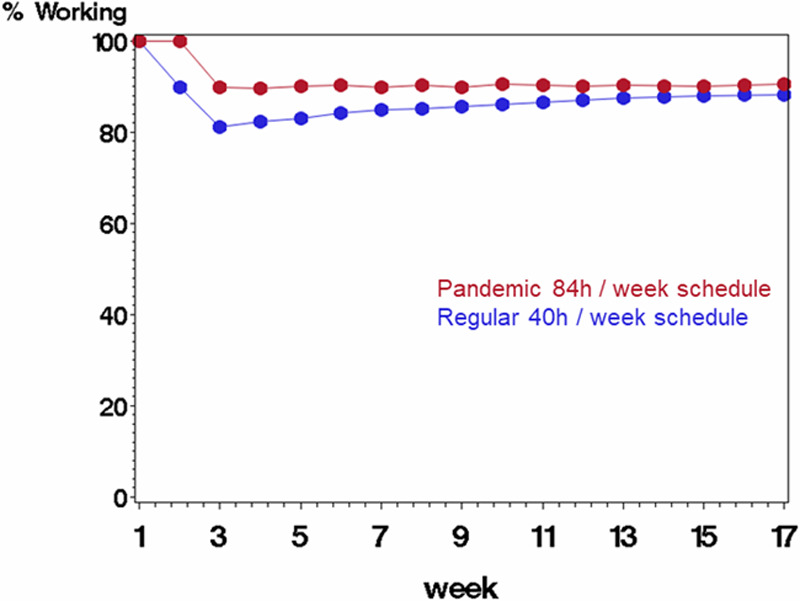
Comparing scenario B (rotating staff each week in a pandemic schedule with 84 h/wk followed by 1 wk off, displayed in red) with scenario A (regular schedule with 40 h/wk, displayed in blue) on percentage of starting work force available to work each week. The average probability of being infected at work was 0.10, and probability of mortality if infected was 10%. Infected staff were quarantined for 2 wk before returning to work.
Figure 6.
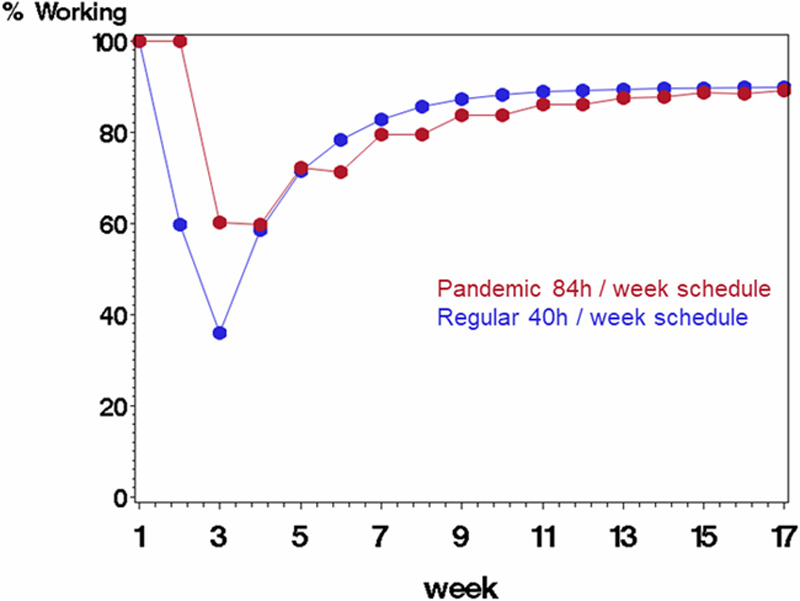
Comparing scenario B (rotating staff each week in a pandemic schedule with 84 h/wk followed by 1 wk off, displayed in red) with scenario A (regular schedule with 40 h/wk, displayed in blue) on percentage of starting work force available to work each week. The average probability of being infected at work was 0.40, and probability of mortality if infected was 10%. Infected staff were quarantined for 2 wk before returning to work.
Table 3.
Labor Sparing Using Rotating Weeks (B) and Standard (A): 2-wk Quarantine After Infection
| Infection | 0.10 | 0.25 | 0.40 | ||||||
|---|---|---|---|---|---|---|---|---|---|
| Mortality | 0.10 | 0.10 | 0.10 | ||||||
| % Working | Savings | % Working | Savings | % Working | Savings | ||||
| Week | A | B | A | B | A | B | |||
| 1 | 100.0 | 100.0 | 0.0 | 100.0 | 100.0 | 0.0 | 100.0 | 100.0 | 0.0 |
| 2 | 89.9 | 100.0 | 10.1 | 75.1 | 100.0 | 24.9 | 60.0 | 100.0 | 40.0 |
| 3 | 80.8 | 90.2 | 9.4 | 56.6 | 74.9 | 18.3 | 36.3 | 60.1 | 23.8 |
| 4 | 82.1 | 89.9 | 7.8 | 65.1 | 74.8 | 9.7 | 58.1 | 59.9 | 1.9 |
| 5 | 83.2 | 90.4 | 7.3 | 71.5 | 78.8 | 7.4 | 71.2 | 72.4 | 1.2 |
| 6 | 84.1 | 90.0 | 5.9 | 76.3 | 78.8 | 2.5 | 78.9 | 72.6 | −6.4 |
| 7 | 85.0 | 90.4 | 5.4 | 79.8 | 81.8 | 1.9 | 83.1 | 79.5 | −3.6 |
| 8 | 85.5 | 90.4 | 4.9 | 82.3 | 82.1 | −0.2 | 85.8 | 79.4 | −6.3 |
| 9 | 86.0 | 90.2 | 4.2 | 84.1 | 83.9 | −0.1 | 87.4 | 83.4 | −4.0 |
| 10 | 86.4 | 90.0 | 3.5 | 85.3 | 83.8 | −1.5 | 88.5 | 83.5 | −5.0 |
| 11 | 86.8 | 90.1 | 3.3 | 86.4 | 85.6 | −0.8 | 89.2 | 86.1 | −3.0 |
| 12 | 87.2 | 90.4 | 3.1 | 87.4 | 85.4 | −2.0 | 89.5 | 86.2 | −3.3 |
| 13 | 87.6 | 90.2 | 2.6 | 88.0 | 87.0 | −0.9 | 89.7 | 87.6 | −2.1 |
| 14 | 87.9 | 90.1 | 2.1 | 88.5 | 86.5 | −2.0 | 89.9 | 87.4 | −2.6 |
| 15 | 87.9 | 90.3 | 2.5 | 88.8 | 87.6 | −1.2 | 90.0 | 88.7 | −1.3 |
| 16 | 88.0 | 90.5 | 2.4 | 89.1 | 87.3 | −1.7 | 90.1 | 88.3 | −1.7 |
| 17 | 88.3 | 90.1 | 1.8 | 89.2 | 88.4 | −0.9 | 90.1 | 89.1 | −1.0 |
| Mean (SD) | 4.5 (2.8) | 3.1 (7.8) | 1.6 (12.0) | ||||||
| Reference | Figure 4 | Figure 5 | Figure 6 | ||||||
Quarantine: number of weeks a staff member stays off of work after being infected. Infection: probability of an uninfected staff becoming infected in a given week at work. Mortality: probability of an infected staff member succumbing to the coronavirus. % working: percentage of starting staff working for the given week. Savings: absolute difference between scenario B (rotating weeks, 7–12 h shifts) and scenario A (standard 8-h shifts each week). Scenarios rotating weeks (B) and standard (A) are compared on the absolute difference for each week in the percentage of the starting labor force. We assume infection probabilities of 0.10, 0.25, and 0.40, a 2-wk sick leave for infected staff who survive, and a mortality probability of 0.10. The Table shows numerical results from Figures 4–6.
Abbreviation: SD, standard deviation.
Discussion
In the current analysis, we demonstrate that HCW staffing shortages may be reduced when epidemiology-based staffing models are used in a pandemic setting. This may be of particular importance with regard to both reducing infections of HCW and to maintain operational functionality of health care facilities and systems.
Specifically, our data provide implications in terms of health and safety for personnel, operational functionality, and the potential outcome benefit for patients treated in ICUs.
While our data provide evidence for adjusted staffing in a pandemic such as currently with COVID-19, basic recommendations such as appropriate training and equipment to avoid cross-contamination remain of key importance.7 Furthermore, surveillance of employee health status must be enhanced,7 and infected individuals must be removed from the workplace immediately. If possible, it may appear advisable to define a pool of standby professionals to replace dropouts during the “on-duty” periods. Yet, to avoid any cross-contamination with healthy clusters, such replacements might preferably be scheduled in parallel with the cluster, even if this means a shorter on-duty time.
Staff must be trained on appropriate physical and psychological self-care,10 and rigorous isolation precautions to protect personnel and nonaffected patients are pivotal.11 Supportive coping mechanisms are needed to avoid burnout because resource deprivation and higher workload due to shortages in manpower are major drivers of burnout and concomitant potential additional dropouts.12
While this manuscript focuses on ICU workforce, an adapted form of staffing throughout all departments of a hospital in a comparable cadence appears to be beneficial to avoid cross-contaminations whenever possible. Further respective staffing logic may be advisable for companies outside the health care sector.
A number of limitations of our analysis must be recognized. First, the theoretical nature of the models, as opposed to having implemented a research study to compare these staffing scenarios, is certainly a limitation. Additionally, because ICU care is a 24/7/365 business, our standard scenario is a simplified version, and exact working schemes likely differ between hospitals. Nevertheless, it may provide guidance given the diversity of labor laws and “best common practice” for routine staffing in health care settings globally. Second, epidemiologic data and recommendations (eg, regarding quarantine times) may be diverse and may differ among regions and affected health care systems. Nevertheless, our simulations reveal a consistent dip in HCW availability that is expected after 4 weeks of a COVID-19 outbreak, independent of specific sickness periods and quarantine times.
Our simulations reveal significant benefits of a staffing model beyond routine staffing practices. While an epidemiology-based model may reduce staff shortages, we recommend adjusting staff scheduling in an effort to prevent a significant dip in the availability of healthy HCWs whenever possible. Apparently, the net working time over the 2-week period is slightly higher in the pandemic scenario (84 hours ÷ 2 staff members = 42 hours each versus 40 h/wk in our standard scenario). Yet, the high burden for staff members working 84 h/wk must be balanced by a week off to recover.
In conclusion, staffing with disease-based epidemiologic indices may reduce HCW shortage by mitigating the shortage of the affected workforce. Although this requires considerable efforts by and commitment of staff members, it may be essential in an effort to best maintain staff health and operational functionality of health care facilities and systems.
DISCLOSURES
Name: Edward J. Mascha, PhD.
Contribution: This author helped with conception and design of the study, analysis and interpretation of data, drafting the article, and approving the final version to be submitted.
Conflicts of Interest: None.
Name: Patrick Schober, MD, PhD, MMedStat.
Contribution: This author helped with conception and design of the study, analysis and interpretation of data, drafting the article, and approving the final version to be submitted.
Conflicts of Interest: None.
Name: Joerg C. Schefold, MD.
Contribution: This author helped with conception and design of the study, analysis and interpretation of data, drafting the article, and approving the final version to be submitted.
Conflicts of Interest: J. C. Schefold declares that the Department of Intensive Care Medicine, Inselspital, Bern, has received research or other grants from (full departmental disclosure) Orion Pharma, Abbott Nutrition International, B. Braun Medical AG, CSEM AG, Edwards Lifesciences Services GmbH, Kenta Biotech Ltd, Maquet Critical Care AB, Omnicare Clinical Research AG, Nestle, Pierre Fabre Pharma AG, Pfizer, Bard Medica S.A., Abbott AG, Anandic Medical Systems, Pan Gas AG Healthcare, Bracco, Hamilton Medical AG, Fresenius Kabi, Getinge Group Maquet AG, Dräger AG, Teleflex Medical GmbH, Glaxo Smith Kline, Merck Sharp and Dohme AG, Eli Lilly and Company, Baxter, Astellas, Astra Zeneca, CSL Behring, Novartis, Covidien, Phagenesis, and Nycomed outside the submitted work. The money was paid into departmental funds.
Name: Frank Stueber, MD.
Contribution: This author helped with conception and design of the study, analysis and interpretation of data, drafting the article, and approving the final version to be submitted.
Conflicts of Interest: None.
Name: Markus M. Luedi, MD, MBA.
Contribution: This author helped with conception and design of the study, analysis and interpretation of data, drafting the article, and approving the final version to be submitted.
Conflicts of Interest: None.
This manuscript was handled by: Thomas R. Vetter, MD, MPH.
Supplementary Material
FOOTNOTES
GLOSSARY
- COVID-19 =
- coronavirus disease 2019
- HCW =
- health care worker
- ICU =
- intensive care unit
- SARS-CoV-2 =
- severe acute respiratory syndrome coronavirus 2
- WHO =
- World Health Organization
Published ahead of print 07 April 2020.
Funding: None.
Conflicts of Interest: See Disclosures at the end of the article.
Supplemental digital content is available for this article. Direct URL citations appear in the printed text and are provided in the HTML and PDF versions of this article on the journal’s website.
All available data and materials and software application or custom code are available on request to the corresponding author.
Reprints will not be available from the authors.
REFERENCES
- 1.Guan WJ, Ni ZY, Hu Y, et al. Clinical characteristics of Coronavirus Disease 2019 in China. N Engl J Med. 2020. [Epub ahead of print]. [DOI] [PMC free article] [PubMed] [Google Scholar]
- 2.Li Q, Guan X, Wu P, et al. Early transmission dynamics in Wuhan, China, of novel coronavirus-infected pneumonia. N Engl J Med. 2020;382:1199–1207. [DOI] [PMC free article] [PubMed] [Google Scholar]
- 3.van Doremalen N, Bushmaker T, Morris DH, et al. Aerosol and surface stability of SARS-CoV-2 as compared with SARS-CoV-1. N Engl J Med. 2020. [Epub ahead of print]. [DOI] [PMC free article] [PubMed] [Google Scholar]
- 4.Linton NM, Kobayashi T, Yang Y, et al. Incubation period and other epidemiological characteristics of 2019 novel coronavirus infections with right truncation: a statistical analysis of publicly available case data. J Clin Med. 2020;9:E538. [DOI] [PMC free article] [PubMed] [Google Scholar]
- 5.Nizamuddin J, Tung A. Intensivist staffing and outcome in the ICU: daytime, nighttime, 24/7? Curr Opin Anaesthesiol. 2019;32:123–128. [DOI] [PubMed] [Google Scholar]
- 6.Yoo EJ, Damaghi N, Shakespeare WG, Sherman MS. The effect of physician staffing model on patient outcomes in a medical progressive care unit. J Crit Care. 2016;32:68–72. [DOI] [PubMed] [Google Scholar]
- 7.Liew MF, Siow WT, MacLaren G, See KC. Preparing for COVID-19: early experience from an intensive care unit in Singapore. Crit Care. 2020;24:83. [DOI] [PMC free article] [PubMed] [Google Scholar]
- 8.Remuzzi A, Remuzzi G. COVID-19 and Italy: what next? Lancet. 2020[Epub ahead of print]. [DOI] [PMC free article] [PubMed] [Google Scholar]
- 9.Huang C, Wang Y, Li X, et al. Clinical features of patients infected with 2019 novel coronavirus in Wuhan, China. Lancet. 2020;395:497–506. [DOI] [PMC free article] [PubMed] [Google Scholar]
- 10.Luedi MM, Doll D, Boggs SD, Stueber F. Successful personalities in anesthesiology and acute care medicine: are we selecting, training, and supporting the best? Anesth Analg. 2017;124:359–361. [DOI] [PubMed] [Google Scholar]
- 11.Arabi YM, Murthy S, Webb S. COVID-19: a novel coronavirus and a novel challenge for critical care. Intensive Care Med. 2020. [Epub ahead of print]. [DOI] [PMC free article] [PubMed] [Google Scholar]
- 12.Milenovic MS, Matejic BR, Simic DM, Luedi MM. Burnout in anesthesiology providers: shedding light on a global problem. Anesth Analg. 2020;130:307–309. [DOI] [PubMed] [Google Scholar]
Associated Data
This section collects any data citations, data availability statements, or supplementary materials included in this article.


