Abstract.
Purpose: Accurate detection of cancer lesions in positron emission tomography (PET) is fundamental to achieving favorable clinical outcomes. Therefore, image reconstruction, processing, visualization, and interpretation techniques must be optimized for this task. The objective of this work was to (1) develop and validate an efficient method to generate well-characterized synthetic lesions in real patient data and (2) to apply these lesions in a human perception experiment to establish baseline measurements of the limits of lesion detection as a function of lesion size and contrast using current imaging technologies.
Approach: A fully integrated software package for synthesizing well-characterized lesions in real patient PET was developed using a vendor provided PET image reconstruction toolbox (REGRECON5, General Electric Healthcare, Waukesha, Wisconsin). Lesion characteristics were validated experimentally for geometric accuracy, activity accuracy, and absence of artifacts. The Lesion Synthesis Toolbox was used to generate a library of 133 synthetic lesions of varying sizes () and contrast levels () in manually defined locations in the livers of 37 patient studies. A lesion-localization perception study was performed with seven observers to determine the limits of detection with regard to lesion size and contrast using our web-based perception study tool.
Results: The Lesion Synthesis Toolbox was validated for accurate lesion placement and size. Lesion intensities were deemed accurate with slightly elevated activities (5% at 2:1 lesion-to-background contrast) in small lesions ( spheres), and no bias in large lesions (). Bed-stitching artifacts were not observed, and lesion attenuation correction bias was small (). The 133 liver lesions were synthesized in , and readers were able to complete the perception study of these lesions in with consistent limits of detection amongst all readers.
Conclusions: Our open-source utilities can be employed by nonexperts to generate well-characterized synthetic lesions in real patient PET images and for administering perception studies on clinical workstations without the need to install proprietary software.
Keywords: lesion synthesis, perception, limits of detection, and positron emission tomography
1. Introduction
Positron emission tomography (PET) is essential for cancer detection, staging, treatment planning, and monitoring of disease.1 Early detection of cancer lesions can have a dramatic effect on patient outcomes; therefore, PET is continuously undergoing innovations to improve image quality. While physicists and engineers may seek to improve individual image characteristic metrics, the clinician is primarily preoccupied by the end goal performance of lesion detection. Lesion detection performance depends on all processes—from data acquisition, image reconstruction, image enhancement, and image rendering, to visualization and interpretation of these images by the clinician.2,3
In the context of PET, image reconstruction methods are an active field of research to improve spatial resolution, decrease image noise, and enhance target-to-background contrast with an overarching goal of improving the specific clinical task of lesion detection and disease staging. Reconstruction algorithms have been continuously improved by advanced statistical (e.g., Bayesian penalized likelihood image reconstruction)4,5 and data-driven (e.g., neural network noise/dose reduction) approaches.6,7 Image reconstruction methodology not only consists of selecting or developing an algorithm but also requires optimization of tunable parameters (e.g., number of, iterations, priors, filtering) that influence lesion perception.8,9 Performance improvements in the image reconstruction stages may benefit image quality and lesion detection, but they may alternatively be leveraged to reduce tracer activity (and radiation dose) and/or to decrease image acquisition times (to benefit clinical throughput),4,10–12 while maintaining baseline lesion detection performance levels.
Other external factors such as reading room conditions (e.g., ambient light intensity), image display technologies (e.g., flat panel monitors and virtual reality), and image rendering techniques (e.g., fused display versus side by side and colormaps) may also influence the perception of diagnostic information in medical imaging studies.3 In the future, lesion detection may also depend on the use of artificial intelligence (AI) in addition to, or in place of, human readers.
To objectively benchmark competing PET technologies, it is pertinent to measure their performance in terms of their clinical task—the most subtle lesion that can be detected by an observer in terms of lesion size and contrast. To measure lesion detection performance, researchers rely on phantom experiments to evaluate the performance of image reconstruction techniques.4,5,10,13 Using these phantom-based methods, researchers have characterized the ability to detect spheres with alternative imaging technologies (i.e., SPECT versus PET), imaging tracers, and image reconstruction algorithms.13 Simplified phantoms often comprising spherical and rod sources are routinely used to perform scanner quality control, evaluate image reconstruction quantitative accuracy, and assess image quality. However, these images do not accurately represent the complex anatomy seen in clinical images. Complex physical phantoms modeling various organs and structures are available, but they are not flexible enough to offer sufficient anatomical variability to represent a clinical dataset.14 Phantom studies are often criticized as they are imaged in near-perfect imaging scenarios (e.g., in the absence of patient motion from breathing) and do not consider the nonhomogeneity, asymmetry, and variability of modeled structures. Furthermore, specific metrics obtained from these phantom studies (e.g., spatial resolution, noise, or contrast) directly evaluate quantitative performance, but their impact on clinical tasks such as lesion detection is not always clear due to the interplay between multiple image quality metrics on the clinical task.15
Measuring task-based performance on real clinical images is often challenged by the absence of reliable ground truth, especially as lesions approach the limits of detection. Furthermore, by adding lesions into images that have already undergone reconstruction, one cannot evaluate the influence of image reconstruction methodology on lesion detectability. To overcome this limitation, researchers have employed techniques to simulate in silico, virtual patients (with disease) with user-defined attributes, using analytical and photon-tracking, Monte Carlo simulations.16–20 These techniques can accurately model complex physics and offer immense flexibility. However, they are often difficult to use to generate large datasets as these simulation techniques have high computational costs (long simulation times from hours to days)21,22 and are limited in their ability to represent the entire range of patients seen clinically.
A more appealing solution is to enable the addition of lesions into real whole-body patient PET data in a manner that does not introduce multibed-position-stitching artifacts and accurately represents image noise and local texture. Some have attempted to overcome these challenges by fusing imaged artificial lesion phantom data with patient data,23 but control of lesion contrast is limited, and flexibility of lesion location, shape, and sizes may require several dedicated acquisitions. An alternative approach is to simulate the lesion projection data in silico and fuse it with the patient projection data before reconstructing the image with the synthesized lesion.9,22,24 Any suitable image reconstruction method can then be used to reconstruct images with or without the presence of the synthetic lesion, but studies aiming to apply their findings to existing clinical devices will benefit from using the same reconstruction methodology used clinically.
In this work, we developed and validated the necessary infrastructure to objectively quantify lesion detection performance in PET images. First, we developed and validated the Lesion Synthesis Toolbox—a fully integrated software enabling raw-data retrieval from the modality database, graphical user interface for simplified definition of lesions, and batch lesion synthesis in real patient data using clinically available image reconstruction methods. Then we synthesized a dataset of solitary liver lesions in real patient PET scans with explicitly defined lesion sizes and contrast to background. We used these lesions in a newly developed perception study tool, a cross-platform web service, to perform a preliminary lesion localization study on clinical workstations. Finally, we fitted a parametric psychophysical model to the observer responses to quantify their lesion detection performance.
2. Methods
2.1. Lesion Synthesis Toolbox—Emission Simulation
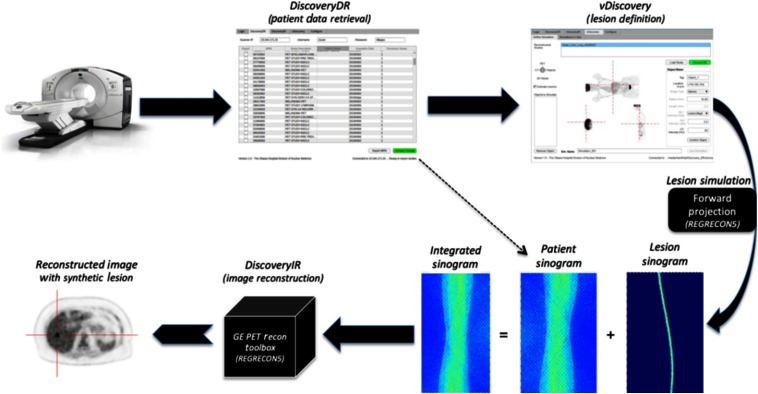
The Lesion Synthesis Toolbox (Fig. 1) was implemented in MATLAB 2018a (Natick, Massachusetts) as a stand-alone application that includes functionality for patient data retrieval from the PET scanner (Discovery DR), graphical user interface for defining synthetic lesions (vDiscovery), and batch lesion synthesis including image reconstruction (DiscoveryIR). The Lesion Synthesis Toolbox could be run as a stand-alone application or on a local server computer, either from within MATLAB or as a distributable compiled executable program. In the server configuration, the application would be accessed from any networked computer using a web browser, and lengthy simulations and image reconstruction computations would be performed on the server machine in an automatic batched fashion.
Fig. 1.
Workflow of the developed Lesion Synthesis Toolbox: the physical scanner in our clinic (top left), custom in-house-developed tool to retrieve raw patient data from the console (top middle), and custom viewer to define simulated objects (lesions) for the simulation package (top right), integration of raw patient projection planes (bottom right—left-most sinogram) and simulated lesion projection planes (bottom right—middle sinogram) modeling patient attenuation, scanner geometry, and scanner effects to produce uncorrected projection planes of the patient with an embedded synthetic lesion (bottom right—right-most sinogram) for image reconstruction (bottom middle), and an example transaxial slice of a reconstructed image of real patient data with a synthetic lesion (bottom left).
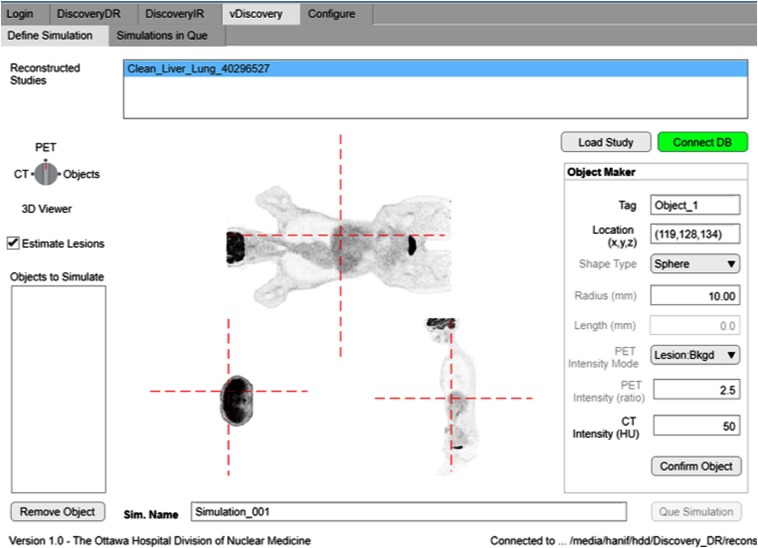
Users first selected patient data to import from the camera console using the DiscoveryDR interface. Data included PET and computed tomography (CT) images, PET projection data (sinograms), and scanner calibration files. Reconstructed PET and CT images were then displayed in a custom graphical user interface in which the user defined the locations, shapes (homogenous spheres in this study, but other variants exist and can be added), sizes, and intensities of lesions to synthesize (vDiscovery, Fig. 2). All of the user-defined lesion parameters were recorded as the reference truth against which viewer performance could be evaluated. Volumetric images describing the simulated lesion objects (input map) were defined at a higher isotropic resolution () than the target reconstructed image (). Voxel indices represented the desired simulated activity in units of Bq/cc or standard uptake values (SUVs) normalized for injected activity and patient weight.
Fig. 2.
User definition of a synthetic liver lesion in whole-body fluorodeoxyglucose (FDG) PET scan of a patient using the vDiscovery tool within the Lesion Synthesis Toolbox.
A custom implementation of a vendor-supported analytical simulation (REGRECON5) was used to generate sinogram projection planes for the input image9 by modeling the Discovery 710 PET/CT system (General Electric Healthcare, Waukesha, Wisconsin) in our clinic. The simulation package estimated the number of events detected from each crystal detector with time-of-flight (TOF) sampling by forward-projecting the activity distribution in the input volumetric image into a four-dimensional TOF sinogram. During forward projection, a registered CT of the patient was used to model attenuation of the patient. Furthermore, scanner effects, such as system resolution, geometric efficiency, and individual detector efficiencies, were also considered.9 Simulated projection data (i.e., lesion sinogram) were summed with raw projection data of the target patient (i.e., patient sinogram) prior to image reconstruction (DiscoveryIR).
Typical oncological PET studies consist of whole-body scans that exceed the PET scanner axial field of view (FOV) and therefore consist of multiple acquisitions as the patient bed is translated axially through the detector ring. These acquisitions are “stitched” together during image reconstruction; therefore, lesion simulations must be performed for all bed positions encompassing the lesion.
The Lesion Synthesis Toolbox can also synthesize lesions in the corresponding CT images of the patient based on voxel substitution methods described in Refs. 2 and 25. This feature was beyond the scope of this work, but lesions embedded in CT images were visually assessed for location accuracy and Hounsfield units (HU) intensity.
2.2. Positron Emission Tomography Acquisition and Reconstruction Parameters
All PET acquisitions in this study were according to our clinical PET protocol on a GE Discovery 710 PET/CT scanner. Patient scans started post FDG intravenous injection. Patient study acquisitions consisted of whole-body or eye-to-thighs scan (6- to 8 bed positions) with 2.5 min per bed stop. A helical CT scan (120 keV, auto mA) spanning the PET acquisition range followed. All reconstructions were performed using TOF OSEM on a transaxial image matrix with 2 iterations, 24 subsets, and all physics-based corrections. Post reconstruction, images were smoothed using a 6.4-mm Gaussian filter.
2.3. Validation of Simulation Toolbox
Three digital phantom studies were devised to validate accurate geometry, attenuation modeling, and bed-stitching capabilities of the lesion simulation process and to characterize recovery of lesion activity in the reconstructed images. The digital phantom activity-concertation images were generated as three-dimensional (3-D) bitmap images that were loaded into the Lesion Synthesis Toolbox as the lesion to synthesize and the patient data were from a blank (i.e., no patient), single-bed PET/CT acquisition. This approach generated phantom images using the exact same methods used for future lesion synthesis.
2.3.1. Validation of virtual positron emission tomography scanner geometry and characterization of lesion intensity
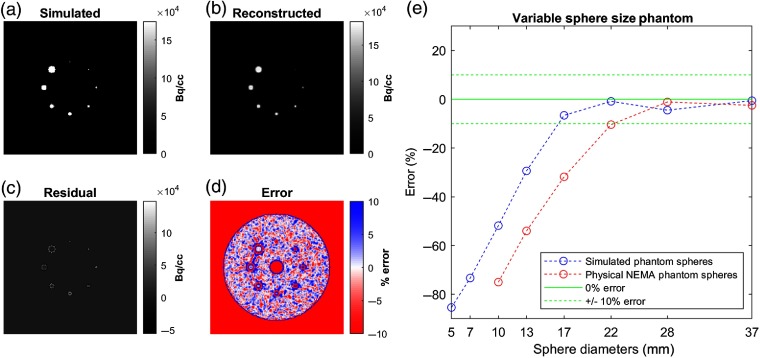
A custom hot-sphere numerical phantom was developed with geometries inspired by the NEMA IEC Body PET phantom and comprising eight spheres with diameters of 2, 5, 10, 13, 17, 22, 28, and 37 mm.5 A cylinder with a diameter of 280 mm and length of 78 mm enclosing the spherical volumes was also generated to act as background activity. Background was set to , and spheres were background. A 10-mm radius hollow cylinder (no activity) was centered on the image long axis. Simulated projection planes were integrated with raw projection planes of an empty PET scan and reconstructed [see Fig. 3(a)].
Fig. 3.
Validation of simulation geometry and characterization of lesion activity recovery. Transaxial slices of (a) simulated numerical phantom input, (b) its reconstructed image, (c) residual (difference) between them and (d) corresponding percent error. (e) Percent errors of image sampled sphere activity concentrations as a function of sphere size for the numerical phantom simulation (blue line) and a similarly configured physical NEMA phantom study (red line) for comparison.
Reconstructed images [Fig. 3(b)] were analyzed for accuracy against the simulated truth. The reconstructed image was subtracted from the simulated image to produce a residual image [Fig. 3(c)] and then scaled on a per-voxel basis to produce a percentage error image [Fig. 3(d)]. Activities of each simulated sphere were sampled from the reconstructed image using 10-mm-diameter sphere regions of interest (ROIs) centered on the simulated sphere to derive a curve characterizing the relationship between sphere size and associated image intensity error [Fig. 3(e)].
Furthermore, results were compared with an image of a physical NEMA phantom consisting of 10-, 13-, 17-, 22-, 28-, and 37-mm-diameter spheres with the same sphere-to-background contrast ratio.
2.3.2. Validation of virtual positron emission tomography scanner activity linearity
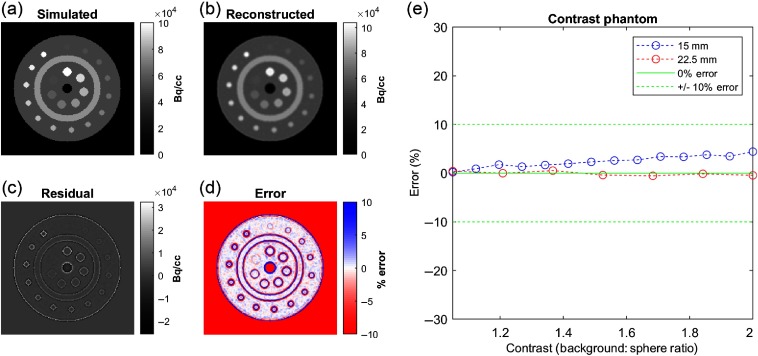
A custom numerical phantom was developed to evaluate the linearity of the simulated activity range of the virtual PET scanner (Fig. 4). A cylinder with a radius of 280 mm and length of 69 mm was generated. Background activity was defined as , and seven 22.5-mm and fifteen 15-mm-diameter spheres were placed along the inner and outer perimeters of a band, respectively. Sphere intensities ranged in intensity between 1 and 2 times the background. Average sphere activity concentrations were sampled using 10-mm spherical ROIs and compared with the simulated truth.
Fig. 4.
Validation of virtual PET scanner activity linearity. Transaxial slice of the (a) simulated numerical phantom, (b) reconstructed image, (c) residual image, and (d) percentage error image. (e) In small spheres (15 mm in diameter), uptake was slightly overestimated and linearly related to sphere intensity, consistent with ringing edge artifacts. Large spheres (22.5 mm in diameter) had no bias at any contrast level.
2.3.3. Validation of virtual positron emission tomography scanner attenuation modeling and bed-stitching uniformity
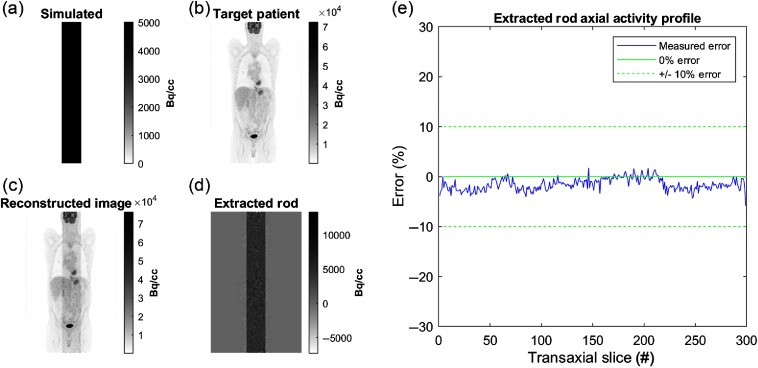
A uniformly distributed cylinder () with a diameter of 56 mm was generated along all transaxial planes of an 8-bed (98-cm-length) image, centered on the scanner’s long axis. TOF projections were generated for the numerical phantom using the patient CT data to simulate attenuation modeling. Attenuated projections were combined with raw patient projections. A reconstruction of the target patient (without the simulated rod) was subtracted from the generated image to extract the simulated rod. The extracted rod was evaluated for uniformity across transaxial slices. Errors less than of the simulated rod activity concentration (i.e., ) were considered acceptable (see Fig. 5).
Fig. 5.
Validation of attenuation simulation and bed-stitching. Coronal images of (a) simulated rod, (b) target patient image, (c) reconstructed combined image and (d) the extracted rod. (e) The percentage error of the extracted rod activity as a function of transaxial slice number indicates no correlation to scanner bed position, ruling out bed-stitching artifacts.
2.4. Perception Study
2.4.1. Candidate patients for lesion insertion
Patient images included in this study were drawn from our clinical database of patients who had undergone a whole-body FDG PET/CT on the GE Discovery 710 PET/CT between December 2018 and May 2019. Patients were screened to include only those without disease (i.e., no perceived lesions) or with localized disease (i.e., nonmetastatic disease with a single isolated tumor outside of the abdomen region). Using the clinical image archiving system viewer (HybridViewer, Hermes Medical Solutions), a research trainee screened candidate patients for absence of disease in the abdominal region. Candidate patient images were further screened by a nuclear medicine and radiology fellow to confirm the absence of disease in the abdomen and the liver specifically. Roughly 200 patients were selected for review based on disease presentation (suspicion of early lung cancer), of which 50 were screened as free of visualizable disease in the abdomen, and of these 37 were confirmed to have low likelihood of presence of metastatic disease. Generating the image database was approved by The Ottawa Hospital Research Ethics Board (REB #20150509), and no explicit patient consent was required.
2.4.2. Library of patients with synthetic lesions
For this study, liver lesions were simulated as spheres to simplify downstream analysis and interpretation. Seven lesions sizes (2- to 14-mm diameter, in increments of 2 mm) and 19 lesion-to-background ratios (1.5 to 6.0, in 0.25 increments) were specified, generating 133 unique synthetic liver lesion cases. Prior to lesion insertion, liver uptake distribution metrics, including mean intensity, standard deviation, and coefficient of variation (CoV), were sampled using a -diameter spherical ROI at the specified lesion locations. Lesions were manually defined using the vDiscovery tool (Fig. 2) by a single user who did not participate in perception studies. Lesions were arbitrarily positioned within the entire volume of the liver, while avoiding placement proximal to organ boundaries.
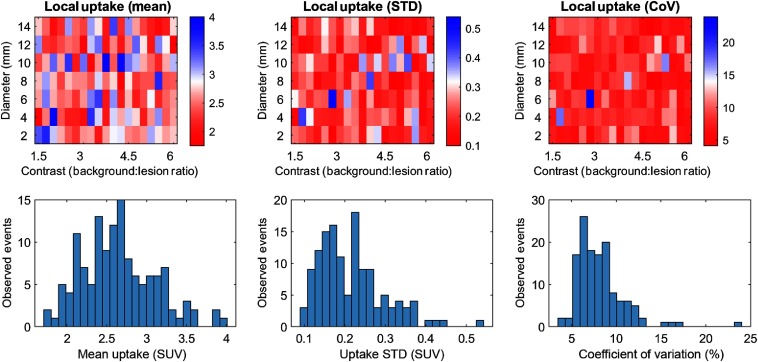
For this study, 133 lesions were defined in the livers in 37 patient images [61% female, age: (19 to 82) years, bodyweight: (38 to 129) kg, body mass index: ]. Histograms of liver intensities (Fig. 6 bottom row) revealed a range characteristic of typical liver uptake intensities. Standard deviation and CoV revealed relatively consistent noise at lesion sites. Target lesion locations had a mean CoV of 8.2%, with 83% of lesions (110) below 10% CoV. Maps of the corresponding image intensity metrics (Fig. 6 top row) indicated no correlation pattern with lesion size or contrast.
Fig. 6.
Distribution of mean pixel intensity (left column), noise as standard deviation of intensity (middle column), and CoV (right column) within the target lesion locations for each specified lesion location. Top row: map with relation to lesion intensity and contrast. Bottom row: histograms of each metric.
2.4.3. Perception study
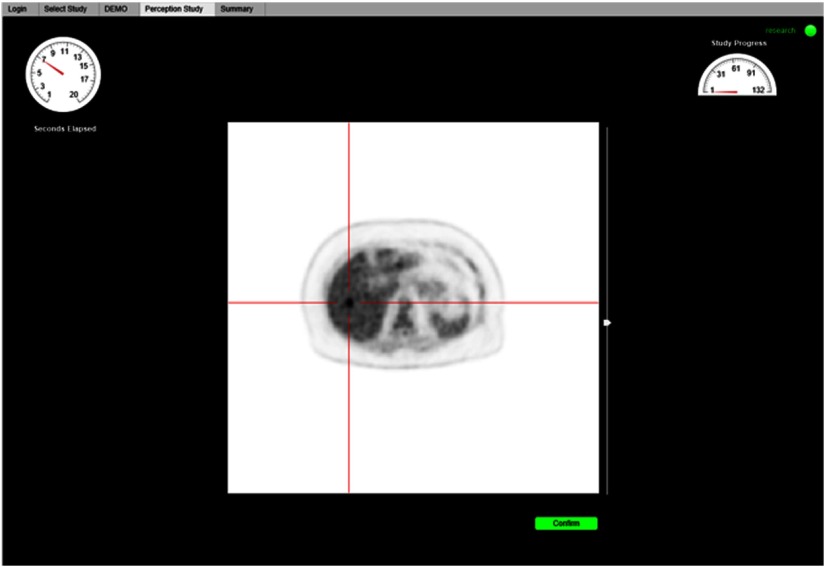
A custom web-based perception study tool was developed to enable observers to complete the study on clinical workstations with specialized medical image reading hardware where additional software cannot be easily installed. Prior to commencing the perceptual study, observers completed an interactive demonstration to familiarize themselves with the interface and study procedure. Implied consent of the participating observer was captured to initiate the study.
Observers were tasked with indicating the location of a single liver lesion in a single transaxial plane intersecting the center of the synthesized lesion. Images were displayed in random sequence using a linear gray-scale colormap scaled from 0 to 7 SUV (body-weight and injected activity standardized radiotracer uptake image intensity units), as is the default settings in our PET clinic. Study participants indicated the location of the perceived lesion using a mouse click and then confirmed their selection. Response time was limited to . Traditional tools for reading and manipulating medical images were intentionally absent, except for a slider to manipulate the maximum image intensity scale.
Seven participants were recruited for this study: (1) an experienced, dual-certified nuclear medicine and radiology physician, (2) two graduate-level medical imaging research trainees, (3) a nuclear medicine imaging physicist, (4) two nuclear medicine technologists, and (5) a nuclear medicine resident. The perceptual trial illustrated in Fig. 7 was conducted on calibrated monitors, under typical reading room conditions (i.e., dimmed lights, quiet room, and closed door). The perception study was approved by The Ottawa Health Science Network Research Ethics Board (REB # 20180722-01H).
Fig. 7.
Web-based perception study tool displaying a test image with crosshairs identifying the lesion in the localization challenge.
Prior to study commencement, the study administrator instructed the observer on the objective of the study and the expected task. Then the perception software provided a tutorial and practice examples to familiarize study participants with the user interface and functionality (e.g., intensity slider). Study participants were free to ask questions until the study commenced and then completed the study in a single sitting without interruption.
2.4.4. Analysis of perception study
Lesions were scored as accurately detected if their observer-indicated location agreed to within () of the center of the synthesized lesion, as per previous similar perception studies.24 Otherwise, or if no location was recorded within the prescribed time window, the lesion was scored as a miss. Perception detection charts were produced as a function of lesion size and intensity for each participant individually and for all participants combined.
Individual and combined observer responses were each used to train a perception model of lesion detection probability as a function of lesion size and background-to-lesion ratio. We used a power-law model of the signal intensity, , consisting of three free parameters: the power of the lesion diameter ; the power of the contrast ; and an amplitude normalization factor.15,26
The signal perception psychometric response was modeled using a Weibull function27 with lapse rate and slope fixed at . Because the experiment consisted of lesion localization, the guess rate was estimated to be low (). Parameters and were arbitrarily fixed as they are redundant with the power-law model parameters , , and .
Model fitting was retrospectively performed using Bayesian expectation maximization using the QUEST+ algorithm28 without a priori estimates of the free model parameters. The 80% and 95% probabilities of lesion detection were arbitrarily selected to represent fair and good levels of performance respectively, and were emphasized graphically on model response plots. Limits of detection were extrapolated from the model outside the range of experimental values as approximations for subsequent research.
3. Results
3.1. Validation of Virtual Positron Emission Tomography Scanner
3.1.1. Validation of virtual positron emission tomography scanner geometry characterization of lesion intensity
The simulated NEMA-inspired numerical phantom and the resulting reconstructed image are shown in Fig. 3. Visual analysis of the error and percentage error images indicated perfect alignment of the simulated structures and accurate geometrical simulation of the PET scanner. Underestimation errors with the greatest magnitude () were focused around the periphery of simulated objects. Spheres in diameter agreed well with simulated activities, within an acceptable error of , and smaller spheres were precipitously underestimated in the reconstructed image (blue curve). In comparison with corresponding results from the physical NEMA phantom (red curve), simulated lesions were higher than expected.
3.1.2. Validation of virtual positron emission tomography scanner activity linearity
The simulated and reconstructed images of the custom numerical phantom are shown in Fig. 4. Visual analysis of the residual and percentage error maps exhibited similar patterns of underestimation as the results in the NEMA-inspired phantom—structures were perfectly aligned, with the most prominent errors around the edges of simulated structures. The sampled activities of all of the spheres were within 5% of the simulated activity. For large spheres (22.5 mm in diameter), errors were below 5% and considered negligible. Errors for smaller spheres trended toward a slight overestimation, growing linearly with specified intensity, which is consistent with edge artifacts (a.k.a. Gibb’s ringing artifact). At a 2:1 contrast ratio, the error was 4.5%.
3.1.3. Validation of attenuation modeling and bed-stitching uniformity
The simulated rod was correctly position within the center of the FOV passing through all transaxial slices of the whole-body FDG patient PET scan. Average extracted rod intensities were slightly underestimated ( of rod activity). The extracted rod axial activity profile did not exhibit spatial patterns correlated to bed positions, ruling out bed-stitching artifacts.
3.2. Perceptual Study
Simulation of the 133 lesions required on a standard desktop computer. Example lesion images are demonstrated in Fig. 8 at varying contrast levels. Seven study-observers successfully completed the liver lesion localization perception study. Mean response time to localize a lesion was ( lesions). On average, the time required for an observer to complete the study was .
Fig. 8.
Example image slices of synthetic liver lesions used in the perception study. All lesions are 10 mm in diameter and have varying lesion-to-background contrast levels (left to right: 4.5, 3.5, 2.5, and 1.5). All images are scaled between 0 and 7 SUVs as per the default image display in the perception study. Note the increasing difficulty of lesion perception with diminishing contrast.
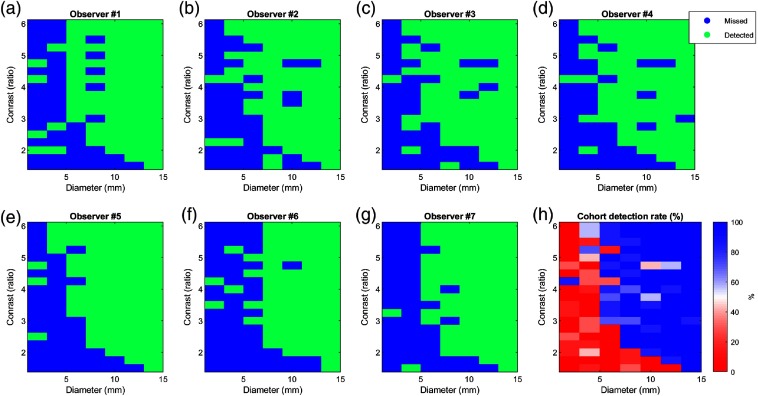
Figure 9 shows all of the recorded accurate detections (localizations) (green) and misses (blue) for each lesion diameter-contrast combination for each observer. The average of all observers () was used to calculate the cohort detection rate as a percentage [Fig. 9(h)]. As expected,13,15 the probability of lesion detection increased with lesion size and background-to-lesion contrast. Lesions with 4-mm () diameter were consistently detected with contrast levels . Smaller lesions with 2-mm () diameter were not reliably detected at any simulated contrast level. The largest lesion (14 mm) was clearly detected at the lowest simulated contrast level (1.5).
Fig. 9.
(a)–(g) Matrices of correct lesion detection (accurate localization) for each of the observers as a function of lesion diameter (millimeter) and background-to-lesion ratio. Green and blue indicate detected and missed lesions, respectively. (h) Percentage accurate detection rate chart for the entire cohort.
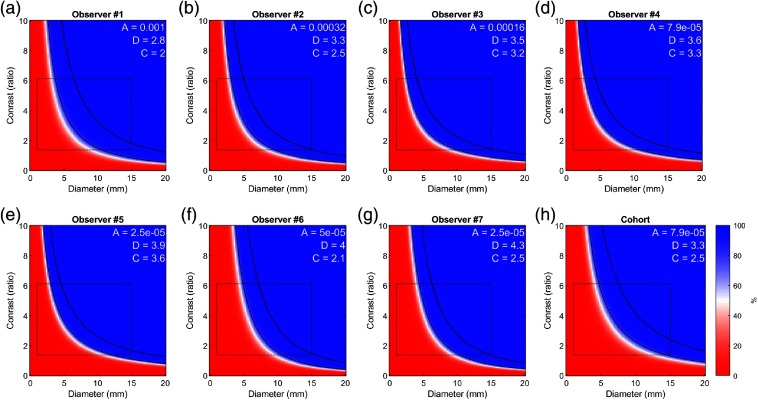
The fitted psychophysical models for each observer and the combined cohort are presented in Fig. 10, representing the probability of lesion detection as a function of lesion size and contrast. The range of data used to fit the models (as in Fig. 9) is delineated with a rectangle, and regions outside this range are extrapolated by the model. The diameter [ (2.79 to 4.31)] and contrast [ (1.97 to 3.62)] power parameters ( and ) were relatively consistent between the seven observers with and 23%, respectively. The CoV of and did not significantly different (-test, ).
Fig. 10.
Psychophysical model responses of observer probability to accurately detect (localize) a lesion as a function of lesion size and lesion-to-background contrast ratio. (a)–(g) Results shown for each observer individually (ordered by fitted parameter ) and (h) all observers combined, corresponding to Fig. 9. Black curves represent the 80% and 95% probability of lesion detection levels. Experimentally sampled space used to train the classifier is indicated by black rectangle, and probabilities outside the rectangle are extrapolated. Fitted model parameters are shown in white text.
4. Discussion
In this work, we have developed fundamental infrastructure to measure the limits of detection of lesions in real PET images. The infrastructure consists of two main software components:
-
1.
The Lesion Synthesis Toolbox is an integrated software package that combines essential functionality for fast simulation of synthetic lesion within real patient data using scanner geometry identical to the one in our clinic. This workflow includes patient data retrieval and archiving, graphical user interface for defining lesions on PET/CT images, lesion simulation, merging of lesion and patient data, image reconstruction, and building a library of lesion images with documented reference truth characteristics of the synthesized lesions. We clearly demonstrated the ease by which well-characterized lesions can be embedded in raw patient PET data prior to image reconstruction to generate a lesion dataset with a reliable reference truth for perception studies.
-
2.
The Perception Study Tool used the synthetic lesion database to perform perception experiments on clinical workstation without the need to install additional software—only a standard internet browser. At the end of the perception study, recorded responses were automatically analyzed to produce a response model of probability of lesion detection for individual participants and for the ensemble of participants.
These tools may be leveraged by nonexpert users to generate data for perception studies and to administer them with relative ease. Nevertheless, some customization of these tools is expected for future studies (e.g., 3-D volume visualization, adaptive selection of images to display,28 support of new scanners); therefore, we have made these tools open source to the research community at Ref. 29.
4.1. Validation of Lesion Synthesis
First, we confirmed the accuracy of the synthetic lesion with a set of specifically crafted experiments that demonstrated the accuracy in placement, size, intensity, attenuation modeling, and bed-stitching of simulated objects using the Lesion Synthesis Toolbox. Errors and biases that were consistent with phenomena seen in physical PET phantom studies were identified.5,10 Small lesions ( in diameter) suffered from partial volume effects, resulting in underestimated activities (Fig. 3). Point spread function (PSF) modeling in the reconstruction, which sharpens object edges, is associated with the ring artifact “moving” activity along the sphere’s perimeter toward the center of small spheres/lesions (Figs. 3 and 4). To better appreciate the accuracy of simulated lesion activity, we compared our results with those of a physical NEMA phantom (Fig. 3), which clearly demonstrated that small simulated lesion overestimated activity by . One possible explanation for this bias is the absence of scatter modeling in the forward projector implemented in the Lesion Synthesis Toolbox. Another explanation may be the presence of thin walls encasing the spheres in the physical phantom that were not modeled in the simulation. Further investigation of this discrepancy is warranted.
In the rod experiment, recovered lesion activities were 1.6% below expected, which is considered negligible within the context of PET imaging. Nevertheless, further investigation of this error is also warranted, and this bias may be partly due to the relatively high activity (due to size and activity concentration in comparison with the background patient activity) of the rod phantom.
4.2. Diversity of Synthetic Lesions
In contrast to previous methods that introduced lesions in a single physical phantom,23 our approach enables easy generation of a clinically realistic dataset consisting of many anatomies. Consequently, we can eliminate observer memory biases associated with familiarity of the image subject.
In the current work, we generated spherical lesions, but future studies could leverage these tools to generate more elaborate lesions, including nongeometrical shapes and heterogonous activity distribution. Because of the flexibility to delineate almost any lesion pattern, even real lesions segmented from high-resolution modalities (e.g., CT or MR) may be used to define a more realistic biodistribution. In fact, this approach has been previously used to compare lesion detectability with alternative PET acquisition and reconstruction methods.24 Real lesions were segmented from clinical PET scans and embedded into lesion-free PET studies using lesion synthesis methodology very similar to those described here, but without TOF or modern 3-D reconstruction. Nevertheless, the advantage of spherical lesions remains that they can be simply characterized using few parameters: location, size, and intensity.
4.3. Lesion Synthesis Computation Time
Simulation times to generate projection planes were on the order of 20 min per single bed position. To improve processing efficiency, only bed positions containing the lesion within the FOV had to be reconstructed. Hence, an 8-bed-position reconstruction with a typical computational cost of 4 h was optimized to by reconstructing a single bed position. Lesions placed in slices corresponding to overlapping bed positions roughly doubled the computational time. Hence, the time required to generate the 133 lesions in this perception study amounted to 150 h of computational time. By employing parallel computing, the lesion generation time was further cut to using a single desktop PC (Intel i7-4790 3.6 GHz, 4 core processor, 16 GB RAM). The simulation of lesion projection planes within a single bed position accounts for approximately one-third of the processing time while two-thirds are attributed to image reconstruction, with negligible overhead from other processing steps. Processing times may be improved with more advanced computing hardware and greater code optimization, including machine-compiled implementation of REGRECON5 (as opposed to MATLAB).
4.4. Lesion Perception Study
In this preliminary perception study, we sought to gain an understanding of the relationship of lesion size and contrast on PET lesion detectability to guide us on the range of lesion parameters to simulate in subsequent studies. We, therefore, elected to focus on the liver region, which is characterized by relatively homogenous activity distribution and reproducible SUVs compared with other organ regions.30 These assumptions were confirmed in Fig. 6. Thus, we were able to focus on the relationship between lesion size and contrast, while ignoring effects from local noise15 (Figs. 8 and 9). Nevertheless, in future studies we intend to broaden the scope of this work to characterize lesion detectability as a function of all three parameters and to other anatomical regions.
Although we only investigated responses between seven observers, their results closely agreed, as illustrated by the similarity of the response curves in Fig. 10, strengthening our confidence in these results. Observers were able to detect lesions smaller than the spatial resolution of the system (), given sufficient contrast. There was good agreement between observers for the detectability of synthetic lesion cases for lesions in diameter. However, results had greater variability between observers in detection of lesions (Fig. 9), which is consistent with the corresponding steep and shallow slopes of the response curve in these diameter ranges (Fig. 10). Notably, some observers were able to detect fainter and small lesions (2 and 4 mm) better than others, but the study was underpowered to determine whether these differences were significant.
Other studies have similarly evaluated the detectability of lesions with respect to image reconstruction techniques.9,31–33 Using a modified Jaszczak experiment, Erdi13 found the limits of detectability of spherical tumors to be in diameter with sufficient contrast (5:1 lesion-to-background ratio) for PET and between 8 and 15 mm for other nuclear imaging technologies. Compared with Erdi, our observers were able to detect fainter and smaller lesions (e.g., in 6-mm lesions). Lesions as small as 2 mm could be consistently detected with lesion-to-background contrast (Fig. 8). These improvements in lesion detection performance may be attributed to PET technological advancements or study design [e.g., the simplification of search in a two-dimensional (2-D) image, physical phantom versus synthetic lesions]. Both studies stop short of explicitly defining a detection limit, but the response model in Fig. 10 depicts two possible values as black lines corresponding to 80% and 95% probability of detection. Limit selection will ideally reflect desired performance for a particular clinical task under consideration.
Morey and Kadrmas8 and Kadrmas et al.23 relied on a relatively sophisticated PET phantom to evaluate the effects of image reconstruction parameters on lesion detectability using confidence-based ROC analysis and modeled numerical observers.14 While their phantom has proven effective in these studies, it is nevertheless limited in the range of anatomies and patient habitus it can model. To our knowledge, our work demonstrates the first study to evaluate the limits of detection for subcentimeter lesions in PET by human observers using realistic patient images, which may better reproduce clinical reality.
Probabilities of detection rate charts illustrated in Fig. 10 demonstrate how our paradigm can be used to compare observers’ performances for a specific task such as lesion detection. This approach may be used to objectively compare task-based performance between competing image reconstruction techniques (types of image reconstruction algorithms, reconstruction parameters, and filters). Similarly, this methodology can also evaluate the effect that image-viewing conditions (e.g., room light intensity), image-rendering conditions (e.g., fused PET/CT versus side by side), and image display technologies (e.g., flat panel display versus virtual reality) have on the limits of detection. These concepts can also be extended to compare viewers to demonstrate the effectiveness of training and experience and to compare human and machine observers.
The observer response functions (Fig. 10) are parametrized functions. These function parameters may serve as figures of merits for quantifying observer limits of detection.15 However, the data presented in this work are too preliminary to determine whether these parameters have sufficient sampling density to serve as figures of merit to compare observer performance under varying conditions. Higher sampling density of lesion parameters and larger sample sizes at the limits of detection are required, which may be manageable to collect in human perception studies using real-time adaptive algorithms that target the limits of perception of each individual observer without wasting participants’ time on obvious lesions and those that are unperceivable, such as QUEST+.28 We intend to evaluate this idea in follow-up studies.
In this work, the lesion detection challenge was performed on a single 2-D slice containing the center of the lesion, while in a clinical setting, physicians read 3-D volumetric images. One may anticipate that performance in lesion detection will improve in 3-D space as structures are correlated between neighboring image slices (and not noise). However, lesion search in 3-D volumes is more difficult due to the ratio between image and lesion spaces. The objective of limiting to a 2-D search (versus 3-D, as well as not providing the CT, and stripping away other clinically available reading tools/practices), was to maximize the image throughput in a short perception study. This work establishes baseline performance values for subsequent studies to which the effect of 3-D search (or reading alongside the CT) can be compared.
4.5. Lesion Simulation Methods
The analytical approach used to synthetize lesions is limited in the physics it models. The approach does not model the associated scatter, random, or dead time associated with the detection of emission data. More complete, Monte Carlo modeling can overcome this limitation, but at the expense of a much longer computation time.17,21 We hypothesize that in relatively small and low-intensity lesions, which produce relatively few detected events compared with those native to the patient scan, these second-order effects are negligible with regard to lesion realism and quantitative accuracy. However, future investigation is required to appreciate the effect sizes.
4.6. Limitations
The main limitation of our Lesion Synthesis Toolbox is its requirement for a clinically relevant image reconstruction method. In our case, we were able to do so through research collaboration with the vendor (GE) and to make our methodology available to other researchers through the GE research community. Adaptation of this methodology to future technologies and to those by other vendors would necessitate further development, possibly depending on industry collaboration.
Another perceived limitation of our study may be the selection of “normal” patient data from a clinical database as the presence of disease in these patients, perceivable or not, does exist. To rule out the presence of disease, we selected patients based on several criteria: screening by two experienced viewers (a physician and a second-year nuclear medicine fellow with PET training) and based on patient history of early staging and no prior-treated disease. Patients were either absent of disease by PET/CT findings or had a single solitary tumor outside of the entire abdominal region and no indication of metastases. Future studies could also evaluate for reproducible erroneously indicated lesion locations to determine if an image contains unintended lesions patterns.
A shortcoming of our study design is that all images contained lesions and we did not record reader level of confidence. Consequently, we were not able to measure false-positive and true-negative rates of lesion perception nor generate receiver operating characteristics (ROC) and localization receiver operating characteristics (LROC) as is common practice in the field. This shortcoming limits comparison of our results with those of others; hence we aim to include ROC and LROC analyses in future studies. Because observers were aware that each image contained a single lesion, they made a best guess at the most likely lesion location. Hence, we speculate that our results produced higher true-positive (detected lesion) rates and lower false-negative (missed lesion) rates than a forced choice type experiment would have yielded.
5. Conclusion
This work demonstrates tools that can be used to easily generate a library of patient images with user-defined synthetic lesions to characterize an observer’s limit of detectability for PET lesions. This platform enables researchers to investigate the contributing factors effecting the perception of medical images for a task-specific goal of lesion detection. The resulting work lays the foundations for subsequent studies to quantitatively evaluate lesion limits of detection performance with new image reconstruction technologies, image display techniques, and AI image readers.
Acknowledgments
We wish to express our gratitude to General Electric Healthcare for enabling this research by making positron emission tomography image reconstruction toolboxes available to us. In particular, we thank Michael Spohn, Charles Stearns, and Kristen Wangerin, who have devoted their time and knowledge to assist us in this endeavor. This work was supported in part by NSERC Discovery #436149-2013 and the Division of Nuclear Medicine, University of Ottawa.
Biographies
Hanif Gabrani-Juma holds a master’s degree in applied science and a bachelor’s degree in biomedical and electrical engineering from Carleton University, Ontario, Canada. He is a research engineer at The Ottawa Hospital within the Department of Nuclear Medicine and specializes in the development and validation of novel medical image analysis tools. His current interests include quantitative medical imaging methods for oncology, the efficient integration of computer-aided diagnosis tools into medical image software, and synthetic disease modeling.
Zamzam Al Bimani is a second-year nuclear medicine clinical fellow at the Division of Nuclear Medicine, University of Ottawa.
Lionel Zuckier is the division head of Nuclear Medicine at Montefiore Medical Center and a professor of radiology at the Albert Einstein College of Medicine. He attended medical school and postgraduate training in nuclear medicine and radiology at the Albert Einstein College of Medicine where he received a five-year N.I.H. research training grant. He has held several academic positions prior to returning to New York, most recently in Ottawa where he served as the chief of the Division of Nuclear Medicine.
Ran Klein holds a PhD in electrical engineering and is an imaging physicist at The Ottawa Hospital, Department of Nuclear Medicine. His greatest impact has been on quantification of myocardial blood flow using positron emission tomography, which has been clinically applied internationally through commercial software and an automated rubidium-82 infusion system. His current interests include quantitative medical imaging, computer-aided diagnosis, and optimization of task-based performance in medical imaging. He is an assistant professor at the University of Ottawa, Department of Medicine, and is an adjunct professor at Carleton University, Department of Systems and Computer Engineering and the Department of Physics.
Disclosures
Ran Klein receives royalty shares from and is a consultant to Jubilant-DRAXimage on rubidium generator technology. He also receives sales shares from FlowQuant© and INVIA Corridor4DM. He has had research collaborations with Hermes Medical Solution, Shelley Medical, and General Electric Healthcare.
Contributor Information
Hanif Gabrani-Juma, Email: hjuma@toh.ca.
Zamzam Al Bimani, Email: zalbimani@toh.ca.
Lionel S. Zuckier, Email: lzuckier@toh.ca.
Ran Klein, Email: rklein@toh.ca.
References
- 1.Selva-O’Callaghan A., et al. , “Conventional cancer screening versus PET/CT in dermatomyositis/polymyositis,” Am. J. Med. 123(6), 558–562 (2010). 10.1016/j.amjmed.2009.11.012 [DOI] [PubMed] [Google Scholar]
- 2.D’Alessandro B., et al. , “Synthetic positron emission tomography–computed tomography images for use in perceptual studies,” Semin. Nucl. Med. 41(6), 437–448 (2011). 10.1053/j.semnuclmed.2011.06.007 [DOI] [PubMed] [Google Scholar]
- 3.Krupinski E. A., “Current perspectives in medical image perception,” Atten. Percept. Psychophys. 72(5), 1205–1217 (2010). 10.3758/APP.72.5.1205 [DOI] [PMC free article] [PubMed] [Google Scholar]
- 4.Teoh E. J., et al. , “Phantom and clinical evaluation of the Bayesian penalized likelihood reconstruction algorithm Q. Clear on an LYSO PET/CT system,” J. Nucl. Med. 56(9), 1447–1452 (2015). 10.2967/jnumed.115.159301 [DOI] [PMC free article] [PubMed] [Google Scholar]
- 5.Andersen T., Hoilund-Carlsen P. F., “The Q. Clear PET reconstruction algorithm: evaluation using the NEMA IQ phantom,” J. Nucl. Med. 57(suppl. 2), 1973–1973 (2016). [Google Scholar]
- 6.Xu J., Gong E., Pauly J., Zaharchuk G., “200x low-dose PET reconstruction using deep learning,” ArXiv:171204119 Cs (2017).
- 7.Kim K., et al. , “Penalized PET reconstruction using deep learning prior and local linear fitting,” IEEE Trans. Med. Imaging 37(6), 1478–1487 (2018). 10.1109/TMI.2018.2832613 [DOI] [PMC free article] [PubMed] [Google Scholar]
- 8.Morey A. M., Kadrmas D. J., “Effect of varying number of OSEM subsets on PET lesion detectability,” J. Nucl. Med. Technol. 41(4), 268–273 (2013). 10.2967/jnmt.113.131904 [DOI] [PMC free article] [PubMed] [Google Scholar]
- 9.Wangerin K. A., et al. , “Evaluation of lesion detectability in positron emission tomography when using a convergent penalized likelihood image reconstruction method,” J. Med. Imaging Bellingham Wash 4(1), 011002 (2017). 10.1117/1.JMI.4.1.011002 [DOI] [PMC free article] [PubMed] [Google Scholar]
- 10.Lantos J., et al. , “Standard OSEM vs. regularized PET image reconstruction: qualitative and quantitative comparison using phantom data and various clinical radiopharmaceuticals,” Am. J. Nucl. Med. Mol. Imaging 8(2), 110–118 (2018). [PMC free article] [PubMed] [Google Scholar]
- 11.Doherty J. O., et al. , “Effect of Bayesian-penalized likelihood reconstruction on [13N]-NH3 rest perfusion quantification,” J. Nucl. Cardiol. 24(1), 282–290 (2017). 10.1007/s12350-016-0554-8 [DOI] [PMC free article] [PubMed] [Google Scholar]
- 12.Wieczorek H., “The image quality of FBP and MLEM reconstruction,” Phys. Med. Biol. 55(11), 3161–3176 (2010). 10.1088/0031-9155/55/11/012 [DOI] [PubMed] [Google Scholar]
- 13.Erdi Y. E., “Limits of tumor detectability in nuclear medicine and PET,” Mol. Imaging Radionucl. Ther. 21(1), 23–28 (2012). 10.4274/Mirt.138 [DOI] [PMC free article] [PubMed] [Google Scholar]
- 14.Kadrmas D. J., Christian P. E., “Comparative evaluation of lesion detectability for 6 PET imaging platforms using a highly reproducible whole-body phantom with 22Na lesions and localization ROC analysis,” J. Nucl. Med. 43(11), 1545–1554 (2002). [PubMed] [Google Scholar]
- 15.Zhou Y., et al. , “On the relationship of minimum detectable contrast to dose and lesion size in abdominal CT,” Phys. Med. Biol. 60(19), 7671–7694 (2015). 10.1088/0031-9155/60/19/7671 [DOI] [PubMed] [Google Scholar]
- 16.Segars W. P., et al. , “4D XCAT phantom for multimodality imaging research,” Med. Phys. 37(9), 4902–4915 (2010). 10.1118/1.3480985 [DOI] [PMC free article] [PubMed] [Google Scholar]
- 17.Harrison R. L., et al. , “Positron range and coincidence non-collinearity in SimSET,” in IEEE Nucl. Sci. Symp. Conf. Rec. 1999 Nucl. Sci. Symp. and Med. Imaging Conf. (Cat. No. 99CH37019), Vol. 3, pp. 1265–1268 (1999). 10.1109/NSSMIC.1999.842787 [DOI] [Google Scholar]
- 18.Buvat I., Castiglioni I., “Monte Carlo simulations in SPET and PET,” Q. J. Nucl. Med. 46(1), 48–61 (2002). [PubMed] [Google Scholar]
- 19.Yu S., “Simulation of PET brain images using Monte Carlo method,” Master of Science, School of Technology and Health, KTH Stockholm (2010).
- 20.Jan S., et al. , “GATE: a simulation toolkit for PET and SPECT,” Phys. Med. Biol. 49(19), 4543–4561 (2004). 10.1088/0031-9155/49/19/007 [DOI] [PMC free article] [PubMed] [Google Scholar]
- 21.Elston B., et al. , “ASIM: An analytic PET simulator,” in Monte Carlo Calculations in Nuclear Medicine: Applications in Diagnostic Imaging, Ljungberg M., et al., Eds., Taylor & Francis Press; (2012). [Google Scholar]
- 22.Berthon B., et al. , “PETSTEP: generation of synthetic PET lesions for fast evaluation of segmentation methods,” Phys. Med. 31(8), 969–980 (2015). 10.1016/j.ejmp.2015.07.139 [DOI] [PMC free article] [PubMed] [Google Scholar]
- 23.Kadrmas D. J., et al. , “Effect of scan time on oncologic lesion detection in whole-body PET,” IEEE Trans. Nucl. Sci. 59(5), 1940–1947 (2012). 10.1109/TNS.2012.2197414 [DOI] [PMC free article] [PubMed] [Google Scholar]
- 24.Farquhar T. H., et al. , “ROC and localization ROC analyses of lesion detection in whole-body FDG PET: effects of acquisition mode, attenuation correction and reconstruction algorithm,” J. Nucl. Med. 40(12), 2043–2052 (1999). [PubMed] [Google Scholar]
- 25.Madsen M. T., et al. , “A new software tool for removing, storing, and adding abnormalities to medical images for perception research studies,” Acad. Radiol. 13(3), 305–312 (2006). 10.1016/j.acra.2005.11.041 [DOI] [PubMed] [Google Scholar]
- 26.Zhou Y., et al. , “Consistent low-contrast detectability for variable patient sizes and corresponding dose in abdominal CT,” Med. Phys. 44(3), 861–872 (2017). 10.1002/mp.12085 [DOI] [PubMed] [Google Scholar]
- 27.Wichmann F. A., Hill N. J., “The psychometric function: I. Fitting, sampling, and goodness of fit,” Percept. Psychophys. 63(8), 1293–1313 (2001). 10.3758/bf03194544 [DOI] [PubMed] [Google Scholar]
- 28.Watson A. B., Pelli D. G., “QUEST: a Bayesian adaptive psychometric method,” Percept. Psychophys. 33(2), 113–120 (1983). 10.3758/bf03202828 [DOI] [PubMed] [Google Scholar]
- 29.Klein R., Research Contributions web-page, http://www.ohri.ca/profile/RanKlein/contributions (2020).
- 30.Boellaard R., et al. , “FDG PET/CT: EANM procedure guidelines for tumour imaging: version 2.0,” Eur. J. Nucl. Med. Mol. Imaging 42(2), 328–354 (2015). 10.1007/s00259-014-2961-x [DOI] [PMC free article] [PubMed] [Google Scholar]
- 31.Munk O. L., et al. , “Point-spread function reconstructed PET images of sub-centimeter lesions are not quantitative,” EJNMMI Phys. 4(1), 5 (2017). 10.1186/s40658-016-0169-9 [DOI] [PMC free article] [PubMed] [Google Scholar]
- 32.Qi J., “Comparison of lesion detection and quantification in MAP reconstruction with Gaussian and non-Gaussian priors,” Int. J. Biomed. Imaging 2006, 87567 (2006). 10.1155/IJBI/2006/87567 [DOI] [PMC free article] [PubMed] [Google Scholar]
- 33.Nuyts J., et al. , “Performance of MAP reconstruction for hot lesion detection in whole-body PET/CT: an evaluation with human and numerical observers,” IEEE Trans. Med. Imaging 28(1), 67–73 (2009). 10.1109/TMI.2008.927349 [DOI] [PubMed] [Google Scholar]


