

Many authors have collected large numbers of cases and described the overall course and prognosis of multiple sclerosis (R.S. Allison 1950; Amato et al 1999; Bonduelle 1967; Bonduelle and Albaranès 1962; V.A. Clark et al 1982; Confavreux et al 1980; 1998a; 2000; 2003; Fog 1966; Fog and Linnemann 1970; Goodkin et al 1989; Kantarci et al 1998; Kremenchutzky et al 1999; Kurtzke 1956; 1965b; 1970; Kurtzke et al 1968a; 1969; 1970a; 1973; 1977; Leibowitz and Alter 1973; McAlpine 1946; 1961; 1964; McAlpine and Compston 1952; McDonnell and Hawkins 1998b; D.H. Miller et al 1992a; Minderhoud et al 1988; R. Müller 1949; 1951; Percy et al 1971; J.F. Phadke 1987; J.G. Phadke 1990; Pittock et al 2004b; S. Poser 1978; S. Poser and Hauptvogel 1973; S. Poser et al 1986; Riise et al 1988; 1992; Riser et al 1971; Runmarker and Andersen 1993; Runmarker et al 1994b; A.J. Thompson et al 1997; Thygesen 1949; 1955; Trojano et al 1995; Wallin et al 2000; 2004; Weinshenker et al 1989a; 1989b; 1991a; 1991b; 1996).
With such a richness of material, our knowledge in this field is materially greater than for any other chronic disease. Simply stated, multiple sclerosis develops early, and runs a protracted clinical course so that life expectancy is barely reduced. The clinical features are extremely variable and the prognosis unpredictable. Nothing seems to be entirely similar or fully predictable. A detailed knowledge of the overall course and prognosis is therefore desirable for the physician wanting to understand the disease and make it comprehensible to the individual patient facing decisions on personal, family, social or professional involvements and commitments. But there has been a real dividend from recent efforts to define and validate features that predict the future course and, as a result, authoritative data on the natural history are now available. However, these features apply more consistently to groups than to individual patients. Nevertheless, this knowledge allows inferences reliably to be drawn regarding the pathophysiology of the disease; it provides information needed by public health services wanting to calculate disease costs and decide on investments in health care resources; it guides health insurance companies with respect to disability and life expectancy calculations; it sets the pharmaceutical industry agenda for investment in research and development programmes; and it plays an essential role in the evaluation of efficacy in clinical trials. That said, more work is still needed to characterize the natural history of multiple sclerosis and, especially, to resolve whether or not the so-called ‘disease modifying agents’ do in fact really modify the course of multiple sclerosis.
METHODOLOGICAL CONSIDERATIONS
Several authors have discussed the qualities required for an epidemiologically ideal natural history cohort of patients with multiple sclerosis (Ebers 1998; Sackett et al 1985). Keys to success are population sampling, clinical assessments and techniques for data analysis.
Population sampling
An essential prerequisite for obtaining relevant information concerning the natural history is to deal with a source population that can be considered representative of the disease as a whole. Ideally, this means that all examples of the disease living in a well-defined geographical area have been ascertained and included in the cohort. As a result, the sample is population based and fully representative of variations in the disease, within the confines of definition and classification. But hospital- and clinic-based series, although open to referral bias – tending towards over-representation of more severe cases (S. Poser et al 1982a; Weinshenker and Ebers 1987) – may also prove representative if the hospital clinic attracts the majority of prevalent patients. For a disease with such a long duration as multiple sclerosis, most cases are likely to attend a specialist centre at least once during the course of their illness. Where this reference centre is especially influential within and beyond the area under study, the probability of a sufficiently representative sample is high. That said, complete ascertainment has always been a challenge in multiple sclerosis. Benign cases tend not to visit neurological departments. Taking this limitation to extreme, the evidence from autopsy series (Engell 1989; Georgi 1961; Gilbert and Sadler 1983; McKay and Hirano 1967), and examples of imaging abnormalities suggestive of multiple sclerosis in asymptomatic individuals (McDonnell et al 2003), emphasize that some affected individuals remain blissfully unaware of their disease status throughout life. Even if they are identified, such cases cannot be included in registers using current diagnostic classifications of multiple sclerosis because overt clinical manifestations are mandatory for diagnosis (W.I. McDonald et al 2001; C.M. Poser et al 1983). Although the effect is small, this bias leads to an overestimation of disease severity.
Another key point is accuracy of diagnosis. There is no diagnostic test for multiple sclerosis. Naming the illness depends on the sum of objective criteria that make the neurologist more or less confident of this formulation. The safeguards are enshrined in the diagnostic algorithms of C.M. Poser et al (1983) and W.I. McDonald et al (2001). We discuss their merits and demerits, and the separate contributions made to paraclinical investigations in illuminating anatomical and mechanistic aspects of the disease process, in Chapter 7.
There is a minimum sample size below which statistical analysis is underpowered, taking into account variations in the clinical course and features of multiple sclerosis. It is difficult to be dogmatic on where this lower limit stands, but studies based on only a few hundred cases are not likely to provide definitive results with narrow confidence intervals. Conversely, although more is better, increasing the sample size should not be at the expense of accuracy, homogeneity and frequency of assessments. One solution is to pool results from different sources; this is best achieved when observations have been made using protocols that are sufficiently compatible to be managed on the same database. The E uropean D atabase for MU ltiple S clerosis (EDMUS) system provides a good example (Confavreux et al 1992). However, an alternative for creating the critical mass of patients needed to address specific questions is to combine cohorts of patients, despite these having been described using different standards. This strategy is being followed at the Sylvia Lawry Centre for multiple sclerosis Research in Münich (Noseworthy et al 2003).
Last but not least, a cohort can only be considered as appropriate for studying the natural history of the disease when the patients under consideration have not received disease modifying treatments. With the advent and widespread prescribing for the beta interferons, glatiramer acetate and, more recently, mitoxantrone, this is increasingly not the case in multiple sclerosis. The number of cohorts that allow accurate characterization and description of the natural history in sufficient numbers of patients with multiple sclerosis is limited. Because the existing data are possibly the last that will become available, they deserve detailed consideration.
Clinical assessments
Ideally, follow-up should be from disease onset until death for all patients included in the database. In practice, this goal is unattainable because the duration of multiple sclerosis is such that results are invariably analysed long before all patients have reached this end point. Modern statistical methods make it possible to take account of patients with varying durations of follow-up but they only provide estimates and these are likely to deviate somewhat from the true position. Furthermore, difficulties may arise in identifying all members of an inception cohort because it may not be possible to date the onset of multiple sclerosis except in retrospect. Restricting the population under study to patients seen from clinical onset introduces its own systematic bias towards more severe cases, since presentation and diagnosis may both be delayed in individuals with benign forms of the disease – as is clearly shown in the London, Ontario, cohort (Weinshenker et al 1989a). This solution is therefore not entirely satisfactory.
Follow-up should be prospective, and made at regular and frequent intervals. Ascertainment of relapses in multiple sclerosis is positively correlated to the frequency of neurological assessments (Fog and Linnemann 1970; Lhermitte et al 1973; U. Patzold and Pocklington 1982). Clinical assessment every 3 or 6 months enables accurate and comprehensive ascertainment of relapses. This is the schedule followed in modern phase III therapeutic trials during the overall study period. Conversely, this ideal is unrealistic for large cohorts of patients seen over a much longer period. Assessment intervals may vary between studies, not only from one patient to another but also for a given individual. It is commonplace for individuals to attend at close intervals during ‘hot’ periods corresponding to the diagnostic phase, a period of increased disease activity, or when new therapeutic opportunities become available, whereas visits become less frequent at other times. But many other factors determine the frequency of routine visits – the level of health care resources, the willingness of the patient to attend neurological appointments, and availability of the physician. As a consequence, structured and standardized follow-up is clearly an unattainable goal in long-term assessment of the natural history in multiple sclerosis.
It is important to be consistent in the use of definitions and scales, even when assessments are made in retrospect, for all the patients seen throughout the study. The importance of training sessions for assessors to reduce inter-examiner variability has been well demonstrated in the conduct of therapeutic trials – a relatively easy task because such studies rarely exceed 2 years. But this control should also be applied to studies of the natural history. Here, the challenge is more demanding because patients are to be followed for several decades and, almost invariably, by different neurologists. In this respect, the adoption of an acknowledged common language facilitates a uniform description throughout the disease, and an electronic database provides for recording, storing and retrieval of information (Confavreux 1994; Confavreux and Paty 1995; Confavreux et al 1992; 1996; Weinshenker 1999). An ideal system has to be quick to complete and user friendly, with an attractive design of the paper forms and screen windows. It must not impose any specific technical demands on the user. The focus must be on basic items and a minimal set of obligatory data that are necessary but also sufficient for comprehensive description of the disease. When EDMUS was developed in the early 1990s under the aegis of the first European Concerted Action, several guiding principles were identified in order to facilitate regular and long-term use of the system, and to avoid compromising the recording physician's daily activities. The EDMUS Steering Committee deliberately gave priority to symptoms rather than signs. Data relating to past events – reported in retrospect by the patient, relatives or attending physician – were recorded in the same language as those derived prospectively. The emphasis was on raw descriptive details assessed directly through interview and examination of the patient. This procedure saves time for the user, ensures a uniform encoding of cases by different applicants, and allows automatic updating of the record whenever additional information becomes available. Scores, indices or classifications derived later are not directly entered in the system, but generated automatically by the program. EDMUS is compatible with any future classifications, since the raw data can be manipulated using new analytical algorithms. Thus, by way of example, EDMUS proved versatile when the need arose to incorporate the McDonald et al (2001) diagnostic classification. These safeguards of standardization and computerization provide considerable clinical and research opportu nities. Medical practice is improved by allowing rapid access to relevant features of patients’ records. Research is made more straightforward. Within and among centres using the same standards, selection of appropriate files, exchange of data, and comparison of individual studies are facilitated. Files from various centres can be pooled for common studies. In this way, information from a critical mass of patients becomes available allowing fundamental issues to be researched with sufficient power, but also encouraging new questions that cannot be addressed by a single centre. These considerations are particularly relevant in a disease such as multiple sclerosis, having a relatively low frequency, and in which clinicians and researchers often use inconsistent terminology.
Data analysis
We have made the point that the researcher does not have access to the entire population from onset to death, and therefore has to provide estimates. For a population of patients studied with respect to a given end point – for instance, the next relapse, a given level of irreversible disability or the onset of progression – any individual fits one of three categories (Figure 4.1 ):
-
•
the end point has already been reached
-
•
the individual is still under scrutiny but has not reached the end point
-
•
the patient has been lost to follow-up since a given date at which the end point had not been reached.
Figure 4.1.

Schematic representation of the distribution of patients in a cohort at the time of survey, according to their status with respect to reaching the end point under scrutiny. Top line: patients who have reached the end point before the closing of the survey. Middle line: patients who have not reached the end point at the time of closure. Bottom line: patients who had not reached the end point at the time they were lost to follow-up.
The last two categories make up the group of censored patients. Obviously, the longer it takes for the outcome of interest to be reached as part of the natural history, the lower the proportion of patients who will actually have reached that end point by the time the study is closed, and the lower will be the reliability of estimates offered, in terms of accuracy and precision.
The classical approach is only to analyse observed data – that proportion of patients who have reached the end point when the survey closes. It is the most straightforward approach, but presently is less favoured because it invariably leads to underestimation of the true interval from inception to end point. Therefore, it overestimates disease severity because patients who have not yet reached this end point by the time of closure, but will do so later, are not taken into account. Much attention must also be paid to the presentation of results when conclusions are based only on observational data. A classical approach is to stratify results. Considering a given disease duration, those patients who are no longer available for follow-up by the neurologist at this time point, because they have died or become homebound or institutionalized and the neurologist does not search for details of current disability, are excluded from the calculations both for this epoch and those that follow. This invariably results in an underestimation for overall severity of the disease. The statement that ‘after 30 years of disease, 50% [of patients] still remain in the benign group’, that is, with a Kurtzke Expanded Disability Status Scale (EDSS) score ≤4.0 (Benedikz et al 2002), illustrates the point. In this Icelandic study, only 108 of the initial 372 (29%) patients were available at 25–29 years of disease duration; 53/372 patients were known to have died at the time of the study. Incorporating these deceased patients into the analysed group would have altered the result so that 51% of the patients had reached an EDSS score of ≥7.0 or were dead, with only 35% remaining in the benign group after 25–29 years’ disease duration. In a study from New Zealand, study outcomes were presented comparatively, with and without such an adjustment, providing an elegant demonstration of why this manipulation, nonetheless incomplete because censored patients are not taken into account, is important in these calculations (Table 4.1 ; D.H. Miller et al 1992a).
Table 4.1.
Distribution of patients (%) in relation to disability status scale (DSS) scores according to time periods of disease duration (years), among 209 patients with multiple sclerosis. Only observed data are taken into consideration. Importance of adjustment of the data for death.
| Disease duration (years) |
||||||
|---|---|---|---|---|---|---|
| 0–5 |
6–10 |
11–15 |
16–20 |
21–25 |
>25 |
|
| Number of patients | 42 | 50 | 28 | 31 | 27 | 31 |
| Disability | ||||||
| Not adjusted | ||||||
| DSS 0–2 | 83 | 46 | 43 | 35 | 30 | 26 |
| DSS 3–5 | 14 | 26 | 25 | 32 | 33 | 35 |
| DSS 6–10 | 2 | 28 | 32 | 32 | 37 | 39 |
| Adjusteda | ||||||
| DSS 0–2 | 83 | 46 | 41 | 32 | 23 | 14 |
| DSS 3–5 | 14 | 26 | 25 | 29 | 25 | 20 |
| DSS 6–10 | 2 | 28 | 34 | 39 | 52 | 66 |
Adjusted percentages after the addition to the DSS 6–10 group of the estimated number of multiple sclerosis-related deaths for a given disease duration within a similar local population of patients with multiple sclerosis.
Adapted from Miller et al (1992a)
© 2006
Another method for presenting results when using observed disability data at a given time point is to construct a ‘progression index’, defined as the ratio of the disability score at any time point to disease duration (see Chapter 6 for a more detailed discussion of disability scales: S. Poser et al 1982b). In order to gain an impression of disease severity in a given patient, this index assumes a linear correlation between disability and time. In a German epidemiological study, the progression index, using the Disability Status Scale (DSS) as numerator, turned out to be remarkably stable in individuals over several years (S. Poser et al 1982b) but this has not always been the case. This concept of the progression index has several shortcomings, as depicted in Figure 4.2 . The index value at any one arbitrary time point does not reveal when in the course of that patient's illness the events determining disability occurred. Conversely, in the patient with stable disability, the progression index decreases with time, ranging from infinity at day 0, through values of 2, 1 and 0.5 for years 2, 4 and 8 to 0.2 at year 20 of disease duration, respectively.
Figure 4.2.

The progression index. (A) Illustration of the different time course of disability accumulation in four fictitious patients (A, B, C, D) with a similar progression index of 0.4 at 10 years of disease duration. (B) Illustration of a fictitious patient with a disability score of EDSS 4 throughout the disease course. The longer the disease duration at the time of the survey, the lower the progression index.
A step forward was made with the introduction of survival analyses (D.R. Cox 1972; Kaplan and Meier 1958). These allow a dichotomized event – that has or has not yet happened – to be considered; but also, when the event has occurred, they reflect the time taken to reach that point. Introduction of the time dimension takes account of patients who have not reached the end point at closure of the study, or are already lost to follow-up. For this reason, probabilistic estimates of time intervals such as those produced by the Kaplan–Meier technique provide longer estimates. These are preferable to analyses based strictly on observational data, but they are not necessarily accurate. The proportion of censored patients has a clear influence on these statistics because the higher this proportion, the longer will be the estimated time intervals (Figure 4.3 ). Life table results can be presented in two ways. The first estimates the survival probability for groups of individuals over time. It aims at illustrating the decreasing proportion of individuals not yet affected by the outcome (‘survivors’) according to time elapsed since the reference point. The second is the opposite; the results illustrate the cumulative proportion of subjects who have been affected by the outcome of interest over time (Figure 4.4 ). In both instances, any inaugural episode occurring early or during the course of the disease can be used as the starting point; and any one of several relevant events taken as the ‘outcome’ or ‘dependent variable’. The date of the last examination is used for the patients who have not reached the end point at closure of the survey (censored cases).
Figure 4.3.

Simulation of Kaplan–Meier estimates for the time from inception (such as the onset of multiple sclerosis) to reaching the end point (such as onset of progression) among the 200 patients with multiple sclerosis in a fictitious cohort, according to the proportion of censored patients at the date of the survey. Medians and 95% confidence intervals (years): 0% censored: median 3.0, 95% CI 2.0–4.0; 20% censored: median 4.6, 95% CI 2.9–6.3; 40% censored: median 7.2, 95% CI 5.0–9.4; 60% censored: median 10.1, 95% CI 6.7–13.5; 80% censored: median 17.9, 95% CIs not assessable; 100% censored: not assessable.
Figure 4.4.
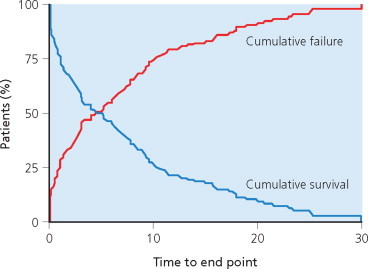
Two methods for displaying Kaplan–Meier estimates of the time to reach the end point under study. Blue: cumulative survival – the proportion of individuals (%) still end-point-free, according to the time elapsed since the date of the reference point. Red: cumulative failure – proportion of individuals (%) who have reached the end point, according to the time elapsed since the date of the reference point.
Survival analyses maximize the use of information available on every patient in making calculations, but are not ideal for assessing the independent or interactive influence of multiple factors occurring simultaneously. In this situation, the requirement is to stratify the initial population into smaller samples, representing each possible explanatory variable. However, this quickly erodes the power of the initial sample. Therefore, the assessment of a single variable is preferable and multivariate analyses are generally impractical, or very soon reveal their limitations. These considerations led to the development of regression models. The most popular, in studies of the natural history of multiple sclerosis, is the Cox proportional hazards regression model (D.R. Cox 1972). This allows the relationship between a set of covariates and the time to a particular event to be estimated by providing risk ratios for reaching that end point between patient groups selected for the different covariates. The proportional hazard model assumes that the risk ratio between two sets of values for covariates is constant over time. Statistical modelling therefore allows for a multivariate analysis and simultaneous weighing of individual factors. It accounts for covariation of the predictors, compensates for censoring, and automatically adjusts for the differences in disease duration (D.R. Cox 1972; Riise et al 1988; 1992). The great strength of this method is to allow the weight of each covariate to the event under study to be estimated over time, and the degree of interdependency for each variable to be considered. This method can be used for the whole population under study, and for preselected strata. Other statistical models have been proposed, based upon Markov transitions (Confavreux and Wolfson 1989; Wolfson and Confavreux 1985; 1987) and, more recently, on Bayesian analysis (Bergamaschi et al 2001). Whether these are more informative, accurate and precise for individual patients than the Cox model remains to be seen.
It is also important to realize that, by their nature, all the statistical analyses mentioned above only provide probabilities at the population level. The results cannot reliably be applied to the individual. A good example is provided by the relationship between pregnancy and multiple sclerosis (Vukusic et al 2004; see below): although the study made it possible to develop mathematical models for the risk of having a relapse in the first trimester of pregnancy, the correct classification was achieved for only 72% of women, even when using the best multivariate model.
The deterministic approach, therefore, also deserves consideration. This differs completely from probabilistic methods, being based upon successive scoring examinations of the individual. These are then plotted on a diagram according to the time of the survey. The mathematical curve best fitting the observed behaviour of the individual can then be identified using a regression analysis. Prediction of the future course of the disease is provided for that individual by extrapolating the regression curve (Figure 4.5 ). Although it has proved worthwhile (Fog and Linnemann 1970; Patzold and Pocklington 1982), the technique is demanding and of limited application in daily practice, because precise and accurate predictions require long periods of observation and frequent assessments.
Figure 4.5.

Deterministic approach. The successive scoring examinations of a given patient over time allow the best fitting mathematical curve to be derived from the observed curve using regression analysis. Future course of the disease of the individual is predicted by extrapolating the regression curve.
Material available for studies on the natural history of multiple sclerosis
Our present knowledge of the natural history of multiple sclerosis is based on long-term studies of cohorts – geographically well defined and subjected to cross-sectional or longitudinal assessments, or both – and on short-term studies that are observational or performed as part of therapeutic trials. Both sources have their merits and demerits but, to some extent, the strengths and weaknesses are complementary. For the long-term natural history studies, precision and reliability of data relating to early phases of the disease are not optimal as, in many instances, these have to be assessed retrospectively. More generally, for the reasons already discussed, precision varies from one patient to another and across different periods of the disease. Conversely, whereas prospective short-term studies may provide precise and robust information regarding the study period, this can seldom be achieved for intervals before and after this brief (and not necessarily fully representative) phase of the disease. Because the period of observation is, by design, limited to several months or years, the value of these studies is restricted to the elucidation only of the short-term course and prognosis. Importantly, such a cohort often provides a narrow representation of the disease in general. Its value can be considered as inversely correlated to the stringency of the inclusion criteria: the more vaguely these are construed, the more variety and breadth creeps into the cohort; the tighter the criteria, the less room there is for variations of the disease spectrum to be included. In practice, we use both sources of information, but as our purpose is to describe the long-term natural history of multiple sclerosis, we focus on the long-term studies in more detail. The number is truly astonishing, many gathered painstakingly in the second half of the 20th century. Perhaps no other disease has been scrutinized in such detail and, as a result, multiple sclerosis stands out as the archetype of chronic diseases, the amazing range of course and prognosis that emerges making it so puzzling to the physician.
The series are listed in Table 4.2 with a summary of the main epidemiological and disease-related features for each. As the table clearly illustrates, many observational natural history studies are based upon more or less complete prevalence material, whereas others rely on samples of patients having contact with a special clinic over a limited period of time (V.A. Clark et al 1982; Detels et al 1982; Leibowitz and Alter 1970; 1973; Leibowitz et al 1964a; 1964b; McAlpine and Compston 1952; R. Müller 1949; 1951; Panelius 1969; S. Poser 1978; Riise et al 1992; Visscher et al 1984). We do not discard these data because, notwithstanding the reservations expressed above, cross-sectional studies can inform the study of natural history in multiple sclerosis, so long as sufficient source information is available on past medical history to allow researchers the opportunity of constructing a reliable neurological history of the patient. In this situation, the availability of additional longitudinal follow-up (Kantarci et al 1998; D.H. Miller et al 1992a; Myhr et al 2001; Phadke 1987; 1990; S. Poser et al 1982a; Trojano et al 1995) improves accuracy and makes the study even more informative. That said, a longitudinal strategy is always to be preferred for reliable assessment of the major outcome criterion – be that relapse occurrence, onset of progression, or time to reach specific landmarks of irreversible disability. In this respect, three cohorts demonstrate features suggesting that they provide reliable information on the natural history of multiple sclerosis:
-
•
a large sample size representative of the population at risk
-
•
prospective long-term longitudinal follow-up with numerous, comprehensive, standardized clinical assessments made at close intervals
-
•
no confounding effects of disease modifying therapeutic interventions
-
•
appropriate statistical analyses, especially the use of survival techniques.
Table 4.2.
Main series of the long-term course and prognosis of multiple sclerosis: epidemiological and disease-related characteristics
| Study | Location | Ascertainment | Follow-up | Population size | Diagnosis classificationa | Overall course of multiple sclerosis at time of study (%) | Time from onset of multiple sclerosis to initial clinic visit (years) | Duration of multiple sclerosis (years) |
|---|---|---|---|---|---|---|---|---|
| Long-term natural history series with cross-sectional and/or some longitudinal assessment | ||||||||
| R. Müller 1949; 1951 | Sweden, multicentre | Clinic based | Cross-sectional | 810 | ’Clinically undoubted’ | Not available | 3 (median) | 15.3 (mean) |
| McAlpine and Compston 1952 | London, United Kingdom | Clinic based | Cross-sectional | 414 | NA |
|
– | 11.3 (mean) |
| Leibowitz et al 1964a; 1964bLeibowitz and Alter 1970; 1973 | Israel, countrywide | Hospital/clinic based | Cross-sectional | 282 | Definite Probable Possible |
|
– | 11.5 (mean) |
| Panelius 1969 | Turku, Finland | Geographically based | Cross-sectional | 146 | Definite | Not available | – | 12.9 (mean) |
| S. Poser 1978 | Germany, multicentre | Hospital/clinic based | Cross-sectional | 812 | Definite Probable Possible |
|
– | 8.7 (mean) |
| S. Poser et al 1982a | Southern Lower Saxony, Germany | Geographically based | Cross-sectional Some longitudinal | 221 | Definite Probable Possible |
|
Not available | 12.1 (mean) |
| V.A. Clark et al 1982; Detels et al 1982Visscher et al 1984 | Washington and Los Angeles, USA | Geographically based | Cross-sectional | 834–941 | Definite Probable | Not available | – | 15 (mean) |
| Phadke 1987; 1990 | Grampian region, Scotland | Geographically based | Cross-sectional Some longitudinal | 1055 | Definite Probable Possible |
|
Not available | 1–60 (range) |
| Minderhoud et al 1988 | Groningen, The Netherlands | Clinic based | Some longitudinal | 342 | Definite Probable |
|
Not available | Not available |
| D.H. Miller et al 1992a | Wellington, New Zealand | Clinic based Geographically based | Cross-sectional Some longitudinal | 209 | Definite Probable |
|
Not available | 14.8 (mean) |
| Riise et al 1992 | Europe, multicentre | Clinic based | Cross-sectional | 574 | Definite Probable Possible | Not available | – | 6.6 (mean) |
| Trojano et al 1995 | Bari, Italy | Clinic based | Cross-sectional Some longitudinal | 309 | Definite |
|
Not available | 9.8 (mean) |
| Kantarci et al 1998 | Turkey, multicentre | Clinic based | Cross-sectional Some longitudinal | 1259 | Definite |
|
Not available | 8.4 ± 6.7 (mean ± SD) 7 (median) |
| Myhr et al 2001 | Hordaland county, Norway | Geographically based | Cross-sectional Some longitudinal | 220 | Definite Probable | Not available | 4.2 ± 0.3 (mean ± SEM) | 14.4 ± 0.2 (mean ± SEM) |
| Long-term natural history cohorts with longitudinal follow-up | ||||||||
| United States Army Veterans World War II cohort | ||||||||
| Kurtzke et al 1968a; 1970; 1973; 1977 | United States | Country based | Longitudinal | 527 | Definite Probable | Not available | 51% seen at onset of multiple sclerosis | 72% followed up at 15 years |
| Lyon, France, multiple sclerosis cohort | ||||||||
| Confavreux 1977Confavreux et al 1980 | Lyon, France | Hospital based | Longitudinal | 349 | Definite Probable Possible |
|
4.7 (mean) | 9.0 (mean) |
| Confavreux et al 2000; 2003 | Lyon, France | Clinic based Geographically based | Longitudinal | 1844 | Definite Probable |
|
6 ± 8 (mean ± SD) | 11 ± 10 (mean ± SD) |
| Gothenburg, Sweden, multiple sclerosis cohort | ||||||||
| Broman et al 1981Runmarker and Andersen 1993Eriksson et al 2003 | Gothenburg, Sweden | Inception cohort Geographically based | Longitudinal | 308 | Definite Probable Possible |
|
60% of cases with relapsing-remitting initial course seen from onset of multiple sclerosis | > 25 |
| London, Ontario, multiple sclerosis cohort | ||||||||
| Weinshenker et al 1989a; 1989b; 1991a; 1991b | London, Ontario | Clinic-based Geographically based | Longitudinal | 1099 | Definite Probable Possible | Not available | 197 patients seen from onset of multiple sclerosis | 11.9 ± 0.3 (mean ± SEM) |
| D.A. Cottrell et al 1999a; 1999bKremenchutzky et al 1999 | London, Ontario | Clinic based Geographically based | Longitudinal | 1044 | Definite Probable Possible |
|
197 patients seen from onset of multiple sclerosis | 24 (mean) |
| Long-term history series from the therapeutic era | ||||||||
| Amato et al 1999Amato and Ponziani 2000 | Florence, Italy | ‘Seen at onset’ Clinic based | Longitudinal | 224 | NA |
|
1.1 ± 0.7 (mean ± SD) | 9.8 (mean) |
SD = standard deviation.
SEM = standard error of the mean.
Whenever necessary, the original criteria used by the authors have been interpreted in order to comply with theC.M. Poser et al (1983) diagnostic criteria. ‘Possible’ is equivalent to ‘suspected’ in this classification.
These originate from Lyon, France (Confavreux 1977; Confavreux et al 1980; 2000; 2003), Gothenburg, Sweden (Broman et al 1981; Eriksson et al 2003; Runmarker and Andersen 1993) and London, Ontario (D.A. Cottrell et al 1999a; 1999b; Kremenchutzky et al 1999; Weinshenker et al 1989a; 1989b; 1991a; 1991b). We add to this list, the United States Army Veterans World War II cohort (Kurtzke et al 1968a; 1970; 1973; 1977) for its pioneer stance in the field. By contrast, we have discarded from this list the extensive Danish study dealing with progression rates in a sample of very carefully and regularly investigated patients observed over long periods (Fog and Linnemann 1970), because this is based on a highly selected population of patients. Lastly, the most recent studies, developed since patients started to receive disease modifying treatments such as interferon β (IFN-β), glatiramer acetate and mitoxantrone, are considered separately (Amato and Ponziani 2000; Amato et al 1999). Because they will repeatedly serve as the major source of information in this chapter, we review briefly the epidemiological and disease-related baseline characteristics of the main long-term natural history cohorts in which longitudinal follow-up is available (Table 4.2).
The United States Army Veterans World War II cohort was set up by John Kurtzke and colleagues based on males diagnosed with multiple sclerosis during Army service between 1942 and 1951 (Kurtzke et al 1968a; 1970a; 1973; 1977). It has the strengths of being drawn from a large geographical base, and with prolonged follow-up. But the cohort undoubtedly provides a biased sample. By definition, it is limited to young males. Pre-service onset of multiple sclerosis prevented men from enlisting, whereas disease onset during service may not have been diagnosed as such prior to discharge. The cohort offers opportunities to describe multiple sclerosis from onset. Later, its value deteriorates, because the diagnosis of multiple sclerosis is a cause for medical discharge from service, and for compensation. For men on active duty in the Army, any symptoms interfering with military activities led to early hospitalization. Whenever multiple sclerosis was suspected, a neurological evaluation immediately took place, thus providing clinical and laboratory information at the time of onset, or very close to it. Follow-up information from the Veterans Administration hospitals, as well as other medical records, was usually extensive because disability compensation depended partly on the degree of neurological deficit. For most men with incomplete Veterans Administration follow-up records, special examinations by private neurologists were performed in the period 1960–1962. Original medical records were abstracted by trained researchers. The information in the hands of the Army physician when making the diagnosis of multiple sclerosis was therefore enriched with serial examinations and interval histories gathered during follow-up. The cohort comprises a total of 527 men, among whom 476 were considered to have definite multiple sclerosis according to criteria for space and time dissemination; conversely, 51 were classified as probable because the criterion for dissemination in time was missing. Two distinct groups were considered. One consisted of 293 patients whose inaugural episode occurred before entry to the military, and was distinct from the relapse allowing for diagnosis whilst serving in the Army – an average of 2–3 years from onset. Detailed neurological information was available for the first attack in 10% of cases. The other group consisted of 234 patients whose inaugural episode occurred during military service. Here, neurological data relating to onset were available in 94% of individuals later shown to have multiple sclerosis. The use of medication taken during the 1942–1962 study period is not known, which leads us to think that the treatments were limited to short courses of corticotropin or corticosteroids administered during relapses, only in the latter part of the study.
A multiple sclerosis Cohort was established in the Lyon Hospital Department of Neurology in 1957 (Confavreux 1977; Confavreux et al 1980; 2000; 2003). The cohort includes all patients with a diagnosis of multiple sclerosis examined on more than one occasion in the department. This serves as the single referral centre for multiple sclerosis in Lyon City and the Rhône-Alpes region. Lyon is located within the ‘département du Rhône’, which listed 1 575 000 inhabitants in 1999. The Rhône-Alpes region is made of eight départements (Ain, Ardèche, Drôme, Isère, Loire, Rhône, Savoie and Haute-Savoie) and counted 5 634 000 inhabitants in 1999. Prevalence of multiple sclerosis in the area has been estimated at approximately 50/105 according to the most recent epidemiological study (Confavreux et al 1987). The Lyon multiple sclerosis Cohort can be considered representative of patients with multiple sclerosis in this area. Data were computerized in 1976 and, since 1990, entered on the EDMUS software (Confavreux et al 1992). Individual case reports document personal and demographic data, medical history, key episodes in the course of the illness (relapses, onset of the progressive phase, dates of assignment for the successive scores of irreversible disability), biological, electrophysiological and imaging studies, and details of treatment. Observations are entered retrospectively when the patient is first seen at the clinic. Effort is always made to obtain data from the original medical files, especially those relating to the first neurological episode, and on the clinical course and disability. Success is facilitated by cooperation from the regional network of neurologists working in the Lyon area. New observations are then collected prospectively whenever the patient returns, usually on a yearly basis, entered and checked automatically by the system for consistency with older information. By April 1997, a cohort of 1844 patients with definite or probable multiple sclerosis according to the C.M. Poser et al (1983) criteria were included (Confavreux et al 2000; 2003). At that time, the database was locked for the purpose of epidemiological studies. Approximately half of the patients in the cohort had received immunosuppressive drugs, usually azathioprine, at some point during their disease, mainly the relapsing–remitting phase, and not before the third episode. None of these drugs has ever been shown to reduce progression of irreversible disability in multiple sclerosis, and the inclusion of these cases is considered not to have biased the chosen disability end point measures (D.A.S. Compston and Coles 2003; Noseworthy et al 2000a; Rudick et al 1997b). Betaseron®, the first putative disease modifying agent approved in multiple sclerosis, became available (in France) in February 1996. As a historical aside, the first life table analysis of disability in multiple sclerosis is that reported for the Lyon cohort (Confavreux et al 1980). The disability scale used was appropriate for 1980 (McAlpine and Compston 1952; McAlpine et al 1972). Thus, what are designated ‘moderate disability’ and ‘severe disability’ correspond to scores of DSS 4 and 7, respectively (Kurtzke 1961; 1965a).
The Gothenburg multiple sclerosis cohort comprised all patients with onset of multiple sclerosis from 1st January 1950 to 31st December 1964, living in Gothenburg, Sweden, at the time of disease onset (Broman et al 1981; Runmarker and Andersen 1993; Svenningsson et al 1990) and satisfying contemporary diagnostic criteria (C.M. Poser et al 1983). The cohort includes 308 patients. Gothenburg is the second largest city in Sweden, with 379 000 inhabitants in 1950 and 431 000 by 1988 (Svenningsson et al 1990). The Sahlgren Hospital Department of Neurology was set up in 1950 and served as the only neurological unit in Gothenburg until 1970 (Broman et al 1981). Almost all neurological patients were referred to the Department because none of the local neurologists had a private practice during this period. After 1970, three part-time neurological outpatient departments were opened, led by neurologists trained at Sahlgren Hospital and maintaining close contacts with the host department. The prevalence of multiple sclerosis ranged from 91 to 96/105 between 1978 and 1988 (Svenningsson et al 1990). The majority of the 308 incident patients were seen early in the disease course: >60% of those with a relapsing– remitting onset attended during the first episode whereas the median time to first examination in the neurological department was 3 years for patients with a progressive initial course of multiple sclerosis. The prognosis of patients seen from onset did not differ from other cases, suggesting that the sample is representative and has the characteristics of an inception cohort. The follow-up has been longitudinal and prospective, extending for ≥25 years from onset in all survivors, with the exception of only four patients (three living abroad) who were lost to follow-up after 13–24 years. Follow-up examinations are mostly carried out by the same neurologists in Sahlgren Hospital, who conducted an average of seven complete neurological examinations on each patient during the follow-up period, and also incorporated data obtained from other neurologists. Primary outcome measures are progression onset for patients with a relapsing– remitting initial course, and reaching DSS 6 for all patients. Data are registered in a specific database. At the times of key analyses, the use of immunological therapies in this population had been limited to short courses of corticotropin in 61 patients. Therefore, although the number of patients included is relatively small, and the study uses a unique scoring system – namely the Regional Functional System Score – and restricts information to DSS 6, 7 and 10 in the database (M. Eriksson et al 2003), the Gothenburg, Sweden, cohort shares several important features qualifying for an appropriate study on the natural history of multiple sclerosis.
The London, Ontario, cohort was established through the multiple sclerosis clinic at the University Hospital in 1972 to provide comprehensive care for patients in the referral area of Southern Ontario (Weinshenker et al 1989a; 1989b; 1991a; 1991b). This cohort retains the characteristics of both a tertiary referral centre for the province of Ontario, and a geographically based clinic serving Middlesex County, where an epidemiological study on 1st January 1984 showed a prevalence of 93/105 with near complete ascertainment: 91% of patients were known to be attending the clinic (Hader et al 1988). Those patients not registered were mainly the chronic institutionalized individuals, most of whom were already severely disabled when the clinic was established. Patients are followed annually or biennially by neurologists with a special interest in multiple sclerosis. Follow-up is maintained even after patients become institutionalized in nursing homes; and every attempt is made to determine the reason why an individual might have become ‘lost to follow-up’. No specific therapies for multiple sclerosis were administered, other than corticosteroids for acute exacerbations, although the clinic has contributed to many therapeutic trials and adopted the prescribing culture now characteristic of centres in North America and Canada. Between 1979 and 1984, the authors reviewed data collected on 1099 consecutive patients evaluated between 1972 and 1984. Information on demographics, clinical course and the progress of disability as a function of time was systematically collected. Data were recorded on standardized forms and entered onto a mainframe computer. They were analysed as a total population but also in two subgroups: the Middlesex County cohort, representing a population-based group for which ascertainment was near complete; and the ‘seen from onset’ subgroup comprising 197 patients seen by a neurologist ≤1 year from onset. Data on this cohort have been updated to the end of 1996 and the mean duration of the disease at that time reached 24 years (D.A. Cottrell et al 1999a; 1999b; Kremenchutzky et al 1999).
THE OUTCOME LANDMARKS OF MULTIPLE SCLEROSIS: DEPENDENT VARIABLES
It has long been recognized that the course of multiple sclerosis can be described in terms of relapses, remissions and chronic progression either from onset or after a period of remissions (Charcot 1868b: 1868c; Marie 1884; McAlpine and Compston 1952). Two major outcome measures usefully describe the clinical course and prognosis: the qualitative description, an expression of the interplay between relapses and progression; and the quantitative description, which refers to the accumulation of neurological deficits and is characterized as disability, impairment or loss of social functions. Both can be used in therapeutic trials. Here, we confine our discussion to the role of clinical variables: surrogate markers are covered in Chapter 18.
Course-related dependent variables
Physicians and people with multiple sclerosis know that the cardinal features that characterize the clinical experience of this disease are:
-
•
episodes with full recovery
-
•
episodes with incomplete recovery
-
•
chronic progression.
In general, these phases follow an orderly sequence; but the relationship between episodes and progression is far from straightforward, and a detailed understanding of their interplay is required in order to understand the evolution and dynamics of disability and other outcomes.
Relapses and progression
Relapses – exacerbations, attacks, bouts or episodes – are defined as the first occurrence, recurrence or worsening of symptoms representing neurological dysfunction and marked by subacute onset and a period of stability followed by partial or complete recovery – the whole process lasting ≥24 hours (see Chapter 16). On a small semantic point, it is not strictly correct to refer to the initial episode as a ‘re lapse’; although this is commonplace, we designate the first experience as the inaugural episode and everything that comes later as a relapse(s). Distinction is made between symptoms attributable only to fatigue, and those associated with fever. Events occurring within a 1-month period are considered part of the same episode (Confavreux et al 1992; W.I. McDonald et al 2001; C.M. Poser et al 1983; G.A. Schumacher et al 1965). The experienced neurologist will recognize that, despite these unambiguous definitions, it is not always easy to decide whether particular neurological symptoms do genuinely constitute a relapse. Every specialist is familiar with the difficult issue of resolving the status of worsening paraesthesia, a change in walking, or blurred vision – to name but a few of the very many challenging examples encountered in daily practice. Efforts have been made to rank the level of certainty appropriate for a putative relapse – ranging from highly suggestive symptoms with and without objective features on examination noted by the neurologist, to distinctly atypical or minimal complaints. Ranking can be based on the severity of the relapse with respect to its consequences for daily activities; the impact on objective neurological scores; the decision to administer corticosteroids and hospitalize the patient; and the distinction between new symptoms, those previously experienced and worsening of current manifestations of multiple sclerosis. Paroxysmal neurological symptoms present particular difficulties. Because very many may occur over a short period, confusion can arise as to their status – individually or collectively. Our view is that the onset of these manifestations of multiple sclerosis in isolation may constitute a new episode indicating a focal area of inflammatory demyelination resulting in ephaptic transmission. In the absence of an agreed classification for relapse assessment, it is necessary to take a pragmatic approach and adopt common definitions, both in therapeutic trials and prospective studies for which the study period lasts ≤2–3 years, using standardized clinical assessments performed at regular and close intervals by an assessor who is blinded to the therapeutic intervention and focus of interest in the study. However, this is not realistic for natural history studies where lifelong follow-up is required. In this setting, relapse ascertainment and assessment are generally less reliable, and differ for a given patient over time, and between individuals studied contemporaneously.
Perhaps no term in the lexicon of multiple sclerosis has become so confused as ‘progression’. The reason is that, in modern therapeutic trials, the word is used merely to describe a worsening of neurological disability with reference to the baseline. Progression is said to be sustained if confirmed at clinic visits, 3–6 months apart. However, disability worsening, even when sustained at 6 months, does not necessarily equate to an irreversible increase in disability (see below; C. Liu and Blumhardt 2000). Originally, the term was used to define steady worsening of symptoms and signs over ≥6 months (Confavreux et al 1992; C.M. Poser et al 1983; G.A. Schumacher et al 1965), or ≥12 months according to more recent criteria (W.I. McDonald et al 2001; A.J. Thompson et al 1997). By that definition, once started, progression continues throughout the disease although occasional plateaus and minor temporary improvements may be observed (Lublin and Reingold 1996). The date at which progression starts is invariably assigned in retrospect, once the required 6- or 12-month duration of continuous neurological worsening is confirmed. Herein lies the uncertainty. Relapses can be superimposed on progression, whenever that first manifests (primary and secondary progressive multiple sclerosis). Therefore, it is not helpful to use the word ‘progression’ both to characterize the worsening of neurological disability attributable to step changes in disability that follow a nasty relapse, and situations in which disability increases systematically over time, even when interspersed with periods of relative stability. For us, this latter is the correct and preferred usage of the term.
The phases of multiple sclerosis
The usual course of multiple sclerosis is characterized by repeated relapses associated, for the majority of patients, with the eventual onset of disease progression. The initial pattern is so characteristic that diagnostic criteria are dependent on the demonstration of dissemination in time. Consequently, it has become commonplace to speak of ‘conversion to multiple sclerosis’ once the inaugural neurological episode has been followed by a first relapse. By definition, ≥2 distinct neurological episodes must be documented in the course of that patient's illness, the events separated by ≥30 days (McAlpine 1961; W.I. McDonald et al 2001; C.M. Poser et al 1983). Taken with the phase of secondary progression, this establishes three distinct clinical situations qualifying for the dissemination in time criterion (Figure 4.6 ). In the relapsing–remitting phase, relapses alternate with periods of clinical inactivity and may or may not be marked by sequelae depending on the presence of neurological deficits between episodes. By definition, periods between relapses during the relapsing–remitting phase are clinically stable. The progressive phase of multiple sclerosis is characterized by a steady increase in deficits, as defined above and either from onset or after a period of episodes, but this designation does not preclude the further occurrence of new relapses. Thus, a full understanding of the natural history requires more than just the two basic contexts of clinical activity to be considered.
Figure 4.6.

Three major patterns of dissemination in time during the course of multiple sclerosis. Top: two consecutive distinct relapses. Middle: inaugural relapse followed by the onset of the progressive phase. Bottom: onset of the progressive phase followed by a superimposed relapse. In these three instances, the time interval required between any two neurological events is ≥ 30 days.
The several forms of the clinical course
Patients do not necessarily convert from the relapsing–remitting to the progressive phase: but if they do, the migration is irreversible even though the transition can initially be hard to recognize, especially when the early secondary progressive phase is characterized by continuing relapses. From the first clinical descriptions of multiple sclerosis, it was recognized that the disease may also follow a progressive course from clinical onset. Given this matrix, for many years classification of the clinical course in patients with multiple sclerosis distinguished three categories: relapsing–remitting; relapsing progressive, describing the situation of a relapsing–remitting phase followed by progression; and progressive multiple sclerosis, to cover the eventuality of a progressive course from onset with or without superimposed relapses (Broman et al 1981; Confavreux 1977; Confavreux et al 1980; Fog and Linnemann 1970; Leibowitz and Alter 1970; 1973; Leibowitz et al 1964a; 1964b; McAlpine and Compston 1952; D.H. Miller et al 1992a; Phadke 1987; 1990; S. Poser 1978; S. Poser et al 1982a; Runmarker and Andersen 1993; Trojano et al 1995; Weinshenker et al 1989a). At that time, a specific terminology was used by some authors to make the distinction between primary progressive forms with superimposed relapses (the so-called ‘relapsing progressive’ or ‘progressive relapsing’ forms, depending on preference) and primary progressive multiple sclerosis without superimposed relapses (the so-called ‘chronic progressive’ forms). To standardize the terminology used in the description of the pattern and course of multiple sclerosis, and to avoid confusion in communication, an international survey of clinicians involved in multiple sclerosis was performed under the auspices of the National multiple sclerosis Society of the USA (Lublin and Reingold 1996). The consensus intended to classify the disease course in four different categories (we regret the use of abbreviations but retain these for clarity of identification):
-
•
Relapsing–remitting MS (RR-MS): ‘clearly defined relapses with full recovery or with sequelae and residual deficit upon recovery; periods between disease relapses characterized by a lack of disease progression’.
-
•
Secondary progressive MS (SP-MS): ‘initial relapsing– remitting disease course followed by progression with or without occasional relapses, minor remissions, and plateaus’.
-
•
Primary progressive MS (PP-MS): ‘disease progression from onset with occasional plateaus and temporary minor improvements allowed’.
-
•
Progressive relapsing MS (PR-MS): ‘progressive disease from onset, with clear acute relapses, with or without full recovery; periods between relapses characterized by continuing progression’.
It must be noted that in this classification the presence of superimposed relapses is allowed in cases of secondary progressive multiple sclerosis, whereas primary progressive cases with superimposed episodes are segregated from primary progressive cases without relapses (PR-MS vs. PP-MS). Furthermore, the term ‘relapsing progressive multiple sclerosis’ is abandoned because the participating clinicians did not agree on its definition and the proposed definitions overlap with other categories. This classification is illustrated in Figure 4.7 . Some authors add ‘transitional progressive multiple sclerosis’ (TP-MS) to this list, in order to identify the few patients with a course that is progressive except for a single relapse at some time (Filippi et al 1995b; Gayou et al 1997; Stevenson et al 1999; 2000). Some authors reserve this term only for cases with a progressive course devoid of superimposed relapses beginning many years after an isolated episode (Gayou et al 1997), whereas others allow the single attack before or after the onset of disease progression (Stevenson et al 1999; 2000). Because there is no consensus amongst these authors, and the efforts of the National multiple sclerosis Society international survey towards standardization and rationalization are sound and deserving of support, our position is that the few cases of transitional progressive multiple sclerosis can easily be accommodated within the recommended classification, assignment to the categories of primary or secondary progressive multiple sclerosis being determined by when the single episode occurs (Lublin and Reingold 1996). But we recognize that this can prove confusing to patients seeking not to be classified as having progressive multiple sclerosis when negotiating guidelines for the use of disease modifying therapies that are only prescribed and reimbursed for individuals with relapsing–remitting multiple sclerosis.
Figure 4.7.

Classification of the course of multiple sclerosis.
Adapted from Lublin and Reingold (1996). © 1996, reprinted with permission of Lippincott Williams & Wilkins (lww.com).
© 2006 Lippincott Williams & Wilkins
Prognosis-related dependent variables
The second dimension in the history of multiple sclerosis is the appearance of disability. This is quantitative and may prove to be transient, partially reversible, or definitely irreversible. A way of describing the natural outcome of multiple sclerosis is therefore to assess the time course to accumulation of disability. We discuss schemes that directly address the rate of progression in Chapter 6; these depend on two closely related scales used in the vast majority of studies that describe the natural history of multiple sclerosis – the DSS (Kurtzke 1961; 1965a) and its more detailed version, the EDSS (Kurtzke 1983a). Until the mid-20th century, standards used to assess the degree of disablement in multiple sclerosis were usually based either upon the capacity to work, or mobility. However, the former criterion is unreliable because it depends on individual fortitude, economic needs, and the nature of employment. The degree of mobility soon emerged as a better standard although it also is subject to potential confounds (McAlpine and Compston 1952). Classifications based mainly on degree of mobility have shortcomings because they do not take account of upper limb function, sensory symptoms, involvement of the bladder and bowel, defective vision, cranial nerve abnormalities, cognitive deficits, mood disorders or fatigue (McAlpine and Compston 1952; Rudick et al 1996a). Furthermore, the normal aging process may confound results based on these classifications, in older individuals where comorbidity with musculoskeletal, cardiovascular and respiratory disturbances may introduce complexities. That said, such classifications do reflect the global impairment caused by multiple sclerosis, first manifest as a disturbance in walking. This undoubtedly explains the popularity gained by Kurtzke's scales amongst the community of clinicians with a special interest in multiple sclerosis. Rather few other systems proposed for use in multiple sclerosis have gained acceptance; and, to date, no one fulfils requirements of the international multiple sclerosis community (Hobart et al 1996; 2001; Sharrack et al 1999). Although new, more sensitive and multidimensional measures have been proposed, particularly for use in clinical trials (Rudick et al 1996a; 1997), Kurtzke's scales are not displaced and remain, so far, the ‘gold standards’ for grading clinical impairment and disability in multiple sclerosis; de facto, they now represent reference criteria for any novel system that challenges their status and seeks to remove John Kurtzke from the podium of international approval built on familiarity and usage despite much criticism and exposition of the deficiencies. Of the two, the EDSS is now more commonly used than the DSS, especially in clinical trials (but see also below).
The limitations of the DSS are that the scale is unresponsive, combines impairment and disability, has often been shown to have only moderate inter-rater reliability, is not entirely objective, and is heavily weighted towards ambulation (Amato et al 1988 Kurtzke's scales are not displaced and remain, so far, the ‘gold standards’ for grading clinical impairment and disability in multiple sclerosis; de facto, they now represent reference criteria for any novel system that challenges their status and seeks to remove John Kurtzke from the podium of international approval built on familiarity and usage despite much criticism and exposition of the deficiencies. Of the two, the EDSS is now more commonly used than the DSS, especially in clinical trials (but see also below).
It must be realized that the EDSS is ordinal and categorical but neither quantitative nor continuous. The assumption that disability naturally continues to progress at a similar rate throughout the course of the disease is clearly contradicted by observations made on different samples: the distribution of patients according to DSS score at the last follow-up is bimodal with distinct peaks at DSS 1–2, and DSS 6–7 (Table 4.3 ) (D.H. Miller et al 1992a; Minderhoud et al 1988; Weinshenker et al 1989a). It follows that the length of time spent by patients at each level of the DSS scale is uneven, being longer for DSS 1–2, and DSS 6–7 (Table 4.4 ) (Weinshenker et al 1991b). Therefore, the progression from one level to the next on the DSS scale cannot be predicted or considered as equivalent. This means that change in the mean DSS, which has often been used in studies on natural history or in therapeutic trials in multiple sclerosis, is not a valid strategy for describing change or comparing groups. Self-evidently, this confusion would not have arisen if letters instead of figures had been proposed to rank the DSS scale. Differences in the proportion of patients changing by a given degree of disability, and the period over which this occurs, are methodologically more acceptable. Ideally, patients might also be stratified by baseline DSS at inclusion (Weinshenker et al 1991b). Our position is that, using classifications such as the Kurtzke scales, survival techniques are currently the best means of assessing the time to reach a selected level of disability.
Table 4.3.
Distribution (%) of patients in relation to disability status scale at last follow-up examination: data from the literature
| Disability status score | Weinshenker et al 1989a: n = 1099 | Miller et al 1992a n = 209 |
|---|---|---|
| 0 | – | 1 |
| 1 | 17 | 28 |
| 2 | 14 | 17 |
| 3 | 11 | 14 |
| 4 | 6 | 10 |
| 5 | 3 | 3 |
| 6 | 19 | 7 |
| 7 | 18 | 11 |
| 8 | 8 | 6 |
| 9 | 2 | 3 |
| 10 | 1 | – |
Table 4.4.
Time spent at each level of the disability status scale, among 1099 patients with multiple sclerosis.
| Disability status scale | Patients entering a given disability status score grade (number) | Patients worsening (%)a | Time spent at disability status scale grade (mean number of years ± SEM) |
|---|---|---|---|
| 1 | 1037 | 82 | 4.1 ± 0.2 |
| 2 | 829 | 81 | 2.8 ± 0.1 |
| 3 | 662 | 82 | 1.9 ± 0.1 |
| 4 | 536 | 88 | 1.2 ± 0.1 |
| 5 | 475 | 94 | 1.2 ± 0.1 |
| 6 | 489 | 60 | 3.1 ± 0.2 |
| 7 | 306 | 37 | 3.8 ± 0.3 |
| 8 | 114 | 28 | 2.4 ± 0.4 |
| 9 | 34 | 41 | 2.5 ± 0.6 |
Percentage of patients who have reached a given disability status scale grade and progressed to the next level of disability during the study period.
Adapted from Weinshenker et al (1991b)
© 2006
THE ONSET OF MULTIPLE SCLEROSIS
The many series that report the natural history of multiple sclerosis provide an excellent basis for describing demographic and disease-related characteristics at the onset of multiple sclerosis, and thereafter. These are summarized in Table 4.5 . The reader may (correctly) detect some familiarity in the structure of our accounts on factors detectable early in the illness that correlate with the later course, severity and survival in multiple sclerosis. The influences of gender, age and symptoms at onset on dynamics of the relapsing–remitting phase, disability and time to progression are so interwoven as to create the impression of repetition in one account. But in reality, these interactions reinforce the evidence for coherence in listing features that describe and predict the natural history of multiple sclerosis, at least amongst groups if not the individual patient.
Table 4.5.
Main series of the long-term course and prognosis of multiple sclerosis: demographic and multiple sclerosis onset characteristics
| Study | Gender: males/females (%) | Age at onset (years) | Initial symptoms of multiple sclerosis (%) | Initial course: relapsing–remitting/progressive (%) | |
|---|---|---|---|---|---|
| Long-term natural history series with cross-sectional and/or some longitudinal assessment | |||||
| R. Müller 1949; 1951 |
44/56 |
24 (median) |
Optic neuritis | 20 | 87/13 |
| Brainstem | 33 | ||||
| Motor | 66 | ||||
| Sensory | 33 | ||||
| Sphincter | 7 | ||||
| McAlpine and Compston 1952 | 35/65 | 29 (median) | Not available | 90/10 | |
|
49/51 |
32.6 (mean) |
Visual | 14 | Not available |
| Brainstem/cerebellar | 11 | ||||
| Motor | 38 | ||||
| Sensory | 13 | ||||
| Motor and sensory | 8 | ||||
| Mixed | 12 | ||||
| Panelius 1969 |
38/62 |
28.8 (mean) |
Visual | 21 | 90/10 |
| Brainstem | 24 | ||||
| Motor/coordination | 33 | ||||
| Sensory | 22 | ||||
| S. Poser 1978 | 36/64 | 31.1 (mean) | Not available | 82/18 | |
| S. Poser et al 1982a | 35/65 | 30 (mean) | Not available | 87/13 | |
|
29/71 |
33 (mean) |
Visual | 20 | Not available |
| Diplopia | 25 | ||||
| Other cranial nerves | 20 | ||||
| Speech | 18 | ||||
| Motor | 63 | ||||
| Sensory | 61 | ||||
| Incoordination | 58 | ||||
| Phadke 1987; 1990 |
35/65 |
30 (median) |
Optic nerve | 11 | 91/9 |
| Brainstem | 24 | ||||
| Cerebellar | 4 | ||||
| Spinal cord | 42 | ||||
| Cerebral | 1 | ||||
| Mixed | 18 | ||||
| Minderhoud et al 1988 | 40/60 | Not available | Not available | 63/37 | |
| D.H. Miller et al1992a |
29/71 |
32.2 (mean) |
Optic neuritis | 21 | 95/5 |
| Brainstem | 23 | ||||
| Limb sensory | 27 | ||||
| Limb motor | 14 | ||||
| Limb motor/sensory | 9 | ||||
| Cerebellar | 2.5 | ||||
| Cerebral | 3.5 | ||||
| Riise et al 1992 |
36/64 |
31.7 (mean) |
Visual | 25 | 88/12 |
| Brainstem | 22 | ||||
| Pyramidal | 35 | ||||
| Cerebellar | 17 | ||||
| Sensory | 46 | ||||
| Trojano et al 1995 | 44/56 | 26 ± 8 (mean ± SD) | Not available | 81/19 | |
| Kantarci et al 1998 |
36/64 |
|
Optic neuritis | 20 | 88/12 |
| Brainstem/cerebellar | 30 | ||||
| Motor | 40 | ||||
| Sensory | 43 | ||||
| Sphincter | 7 | ||||
| Myhr et al 2001 | 38/62 | 32.5 ± 0.6 (mean ± SEM) | Visual | 16 | 81/19 |
| Brainstem/cerebellar | 34 | ||||
| Motor | 32 | ||||
| Sensory | 34 | ||||
| Sphincter | 2 | ||||
| multiple systems involved | 18 | ||||
| Long-term natural history cohorts with longitudinal follow-up | |||||
| United States Army Veterans World War II cohort | |||||
| Kurtzke et al 1968a; 1970a; 1973; 1977 |
Males only |
25 (mean) |
Visual | 31 | Not available |
| Brainstem | 40 | ||||
| Motor limb | 52 | ||||
| Coordination limb | 44 | ||||
| Sensory limb | 42 | ||||
| Bowel/bladder | 14 | ||||
| Cerebral | 13 | ||||
| Lyon, France, multiple sclerosis cohort | |||||
|
40/60 |
|
Not available | 82/18 | |
| Confavreux et al 2000; 2003 |
36/64 |
|
Isolated optic neuritis | 18 | 85/15 |
| Isolated brainstem dysfunction | 9 | ||||
| Isolated dysfunction of long tracts | 52 | ||||
| Combination of symptoms | 21 | ||||
| Gothenburg, Sweden, multiple sclerosis cohort | |||||
|
40/60 | Not available | Not available | 83/17 | |
| London, Ontario, multiple sclerosis cohort | |||||
| Weinshenker et al 1989a; 1989b; 1991a; 1991b | 34/66 |
|
Optic neuritis | 17 | 66/34 |
| Diplopia/vertigo | 13 | ||||
| Acute motor | 6 | ||||
| Insidious motor | 14 | ||||
| Balance/limb ataxia | 13 | ||||
| Sensory | 45 | ||||
| Long-term history series from the therapeutic era | |||||
|
36/64 | 29.8 ± 9.8 (mean ± SD) | Not available | 85/15 | |
SD = standard deviation.
SEM = standard error of the mean.
The sex ratio in multiple sclerosis
A female predominance is apparent in all representative studies (Amato and Ponziani 2000; Amato et al 1999; Bonduelle and Albaranès 1962; V.A. Clark et al 1982; Confavreux et al 1980; 2000; 2003; Detels et al 1982; Kantarci et al 1998; Leibowitz and Alter 1970; 1973; Leibowitz et al 1964a; 1964b; McAlpine 1961; McAlpine and Compston 1952; D.H. Miller et al 1992a; R. Müller 1949; 1951; Myhr et al 2001; Panelius 1969; Phadke 1987; 1990; S. Poser 1978; S. Poser et al 1982a; Riise et al 1992; Runmarker and Andersen 1993; Trojano et al 1995; Visscher et al 1984; Weinshenker et al 1989a; 1989b; 1991a; 1991b). The usual ratio is two females for one male (2F:M). The highest reported proportion of females is 71% (2.5F:M) in series from North America (V.A. Clark et al 1982; Detels et al 1982; Visscher et al 1984) and New Zealand (D.H. Miller et al 1992a). Similarly, of the 324 living cases in all categories of multiple sclerosis from London, Ontario, and Middlesex County on 1st January 1984, 71% (2.5F:M) were females (Hader et al 1988). The lowest proportion reported is 51% (1.04F:M) in Israeli series (Leibowitz et al 1964a; 1964b; Leibowitz and Alter 1970; 1973).
Age at onset
It is not always easy to determine the age at which symptoms of multiple sclerosis first develop. Some symptoms, such as paraesthesia, are nonspecific and often so vague as easily to be overlooked. However, there is consensus for peak onset around 30 years of age (Table 4.6 and Figure 4.8 ) (Amato and Ponziani2000 ; Amato et al 1999; V.A. Clark et al 1982; Confavreux et al 1980; 2000; 2003; Detels et al 1982; Leibowitz and Alter 1970; 1973; Leibowitz et al 1964a; 1964b; McAlpine and Compston 1952; D.H. Miller et al 1992a); Myhr et al 2001; Panelius 1969; Phadke 1987; 1990; S. Poser 1978; S. Poser et al 1982a; Riise et al 1992; Visscher et al 1984); Weinshenker et al 1989a; 1989b; 1991a; 1991b). An earlier onset has been found in some series (Kantarci et al 1998; Kurtzke et al 1968a; 1970a; 1973; 1977; R. Müller 1949; 1951; Trojano et al 1995). R. Müller (1949) observed a median age at onset of 24 years in his comprehensive multicentre Swedish study: 22% of cases first experienced symptoms at <20 years. He emphasized that, for the reasons mentioned above, ‘the anamnesis should be very carefully recorded in order to obtain more exact information as to the age at the outset of the disease.’ This often corrects age at onset to an earlier age by comparison with the spontaneous statements of patients. R. Müller (1949) concluded: ‘the explanation of the low age at the outset of the disease in this material is probably only because I devoted more attention to this point than had actually been the case.’ For the United States Army Veterans cohort (Kurtzke et al 1968a; 1970a; 1973; 1977), the circumstances of enrolment (military service) easily account for the observed low median age at onset (25 years). For the two other series, the explanation is less straightforward (Kantarci et al 1998; Trojano et al 1995). In the majority of representative series, the distribution of patients with multiple sclerosis by age at onset is bell-shaped, with onset at ≤20 years in around 10%, at ages 20–40 years in 70%, and >40 years in 20% of cases (Bonduelle and Albaranès 1962; Confavreux et al 1980; 2000; McAlpine 1961; McAlpine and Compston 1952; 2003; S. Poser et al 1982a). In London, Ontario, onset of multiple sclerosis occurred at <20 years in 11%, and at >40 years in 20% of cases, respectively (Hader et al 1988). The distribution was less restricted in the study of Leibowitz and Alter (1970; 1973).
Table 4.6.
Distribution of patients with multiple sclerosis (%) by age at onset: data from the literature
| Age at onset of multiple sclerosis (years) | R. Müller 1951 n = 793 | McAlpine and Compston 1952 n = 840 | Leibowitz et al 1964a; 1964b n = 266 | Panelius 1969 n = 146 | Confavreux et al 1980 n = 349 | S. Poser et al 1982b n = 1529 | Confavreux et al 2000; 2003 n = 1844 |
|---|---|---|---|---|---|---|---|
| <20 | 22 | 12 | 15 | 11 | 11 | 10 | 12 |
| 20–29 | 46 | 35 | 27 | 48 | 36 | 36 | 37 |
| 30–39 | 24 | 33 | 28 | 31 | 33 | 33 | 30 |
| 40–49 |
7 |
17 |
22 |
9 |
14 |
21 | 15 |
| ≥50 | 1 | 3 | 8 | 1 | 6 | 6 | |
Figure 4.8.

Distribution of patients by age at onset of the disease, among 812 patients with multiple sclerosis.
Adapted from S. Poser (1978). © 1978, reprinted with permission of Springer-Verlag GmbH.
© 2006 Springer-Verlag GmbH
Females often appear to have a slightly younger mean age at onset than males (R. Müller 1949; 1951; McAlpine 1961). In London, Ontario, age at onset of clinically definite multiple sclerosis was 29.7 (±10.1) years for females, with a range of 10–58 years, and 31.7 (±11.8) with a range of 6–66 years for males (Hader et al 1988). In the Israeli series, the difference was even more marked – mean age at onset with multiple sclerosis being 31.9 years in females and 34.4 years in males. Furthermore, the F:M ratio was found to decrease as age at onset increased (Leibowitz and Alter 1970; 1973; Leibowitz et al 1964a; 1964b). Other authors have not considered that gender has a significant impact on age at onset (McAlpine and Compston 1952; Panelius 1969; S. Poser 1978). In the Lyon, France, series (Confavreux et al 1980), mean age at onset of multiple sclerosis was higher in females (32.6 years) than males (29.4 years) with a significantly greater incidence of the disease in females aged >40 years at the time of presentation (p < 0.01).
Symptoms at onset
At least in retrospect, symptoms can conservatively be placed in three categories: those affecting the optic nerves, the brainstem, and the long tracts – the latter designating symptoms related to motor, sensory, cerebellar or sphincter disturbances. It must be acknowledged that these categories do not strictly represent anatomical regions in the central nervous system (Broman et al 1981). For instance, in addition to the effects on bulbar function, eye movements and motor control, brainstem lesions may also affect the long sensory and motor tracts. Long tract symptoms cannot, in many cases, be referred to a specific part of the central nervous system. We consider it difficult, if not actually erroneous, to force too much precision onto the description and classification of inaugural symptoms and signs in multiple sclerosis, at least in the series for which there is an interval of months or years between clinical onset of the disease and first professional evaluation. For instance, cerebellar symptoms, in many cases assessed retrospectively, cannot always be distinguished from those attributable to involvement of motor or sensory tracts. It is often risky to conclude that gait disturbance is due entirely to ataxia, paraparesis or both – based merely on the interpretation of a neurological interview. Whilst acknowledging that the above classification of symptoms into three categories is imperfect and restrictive, we and others nonetheless consider it to be pragmatic, and an acceptable compromise. For instance, in their comprehensive epidemiological surveys in Norway, Riise et al (1988; 1992) changed the classification of initial symptoms for defined categories referable to functional systems of the DSS. For example, ‘motor weakness’ in the first study was subsequently changed to the ‘pyramidal’ category. The authors did, however, admit that ‘the names used apply to the grouping of symptoms and do not necessarily mean that they can be referred to a specific location or lesion. For instance, “pyramidal function” does not mean that the signs are due only to lesions involving the pyramidal tract’ (Riise et al 1992). We entirely endorse these conclusions. Their consequences are clear. It is risky and often erroneous to categorize initial symptoms too strictly, at least when the assessment is sometimes made years after disease onset. Data related to initial symptoms must therefore be treated as not very robust in the majority of long-term natural history series. This should be kept in mind when interpreting results on the possible predictive value of initial symptoms for disease outcome.
The different long-term natural history series in the literature show some consensus with respect to the distribution of initial symptoms in multiple sclerosis (Table 4.5). However, detailed comparisons between series are rendered impossible through the use of variations in terminology and the failure by many authors to distinguish the occurrence of symptoms in isolation and in combination. It is difficult to delineate precisely what is intended by the terms ‘monosymptomatic, polysymptomatic, monoregional and polyregional’ in the studies that adopt these terminologies. That said, an incidence of around 15% for isolated optic neuritis, 10% for isolated brainstem dysfunction, 50% for isolated dysfunction of long tracts, and 25% for various combinations of these features are reasonable estimates for the distribution of initial symptoms in multiple sclerosis (see Chapter 6).
In the rare instances where this issue has been specifically addressed, the influence of gender on symptoms at presentation of multiple sclerosis has been found not to exist (Panelius 1969), or to exert only a marginal effect showing a slightly greater frequency of long tract involvement in men, and of optic neuritis and diplopia in females (Leibowitz and Alter 1973; R. Müller 1949). The latter trend presumably results from the older age at onset of multiple sclerosis in males than females in these series. Indeed, the obvious influence of age at onset has consistently been found in all studies that addressed this issue, with a higher percentage of optic neuritis and diplopia in patients with earlier age at onset, and of motor disturbances in the patients presenting later (Leibowitz and Alter 1973; Leibowitz et al 1964b; R. Müller 1949; 1951). Table 4.7 shows a further illustrative example from the London, Ontario, cohort.
Table 4.7.
Distribution of patients (%) by initial symptoms according to age at onset of multiple sclerosis, among 1096 patients.
| Age at onset of multiple sclerosis (years) | Optic neuritis | Diplopia/vertigo | Acute motor | Insidious motor | Balance/limb ataxia | Sensory |
|---|---|---|---|---|---|---|
| <20 | 23 | 18 | 6 | 4 | 14 | 46 |
| 20–29 | 23 | 12 | 7 | 6 | 11 | 52 |
| 30–39 | 13 | 11 | 7 | 14 | 15 | 44 |
| 40–49 | 9 | 17 | 3 | 31 | 13 | 33 |
| ≥50 | 6 | 13 | 4 | 47 | 11 | 32 |
Adapted from Weinshenker et al (1989a)
© 2006
The initial clinical course
For more than a century, all experts have agreed that multiple sclerosis usually follows an initial relapsing–remitting course, although some individuals progress from onset. Differences emerge amongst series in the literature as to the relative proportions displaying these two patterns (see Table 4.5). Indeed, the frequency of cases with progression from onset has been found to range from 5% (D.H. Miller et al 1992a) to 37% (Minderhoud et al 1988). The latter figure seems to be an outlier, and may be related to recruitment bias because this Dutch study was mainly devoted to an assessment of year at onset of the progressive phase. The estimate of 34% with primary progressive multiple sclerosis coming from the London, Ontario, cohort is, at first sight, more surprising if one considers the comprehensive sampling (Weinshenker et al 1989a; 1989b). Actually, among the subgroup of 197 patients seen from the onset of multiple sclerosis in this series, only 15% exhibited an initial progressive course with or without superimposed relapses, a figure similar to that of the other main long-term longitudinal natural history series (Confavreux et al 1980; 2000; 2003; Eriksson et al 2003; Runmarker and Andersen 1993). According to the Canadian authors, this disparity could reflect a tendency for patients seen for the first time at a later point in their illness to suppress or forget earlier remitting symptoms when progressive disease subsequently intervenes. It is their experience that a patient may recall a remote first relapse only after several clinic visits (Weinshenker et al 1989a). Moreover, when these authors updated details on their cohort in 1996, they had to reassign a significant number of patients with respect to the overall clinical course of the disease (D.A. Cottrell et al 1999a; 1999b; Kremenchutzky et al 1999). This led to a total of 216 cases with primary progressive multiple sclerosis, as defined. This represented 21% of the total cohort, a figure in agreement with that of the other main longitudinal natural history series (Confavreux et al 1980; 2000; 2003; Eriksson et al 2003; Runmarker and Andersen 1993). Noticeably, in all of these longitudinal series, the group of primary progressive multiple sclerosis encompasses cases with and without relapses superimposed on disease progression – that is, progressive relapsing and primary progressive multiple sclerosis according to current definitions (Lublin and Reingold 1996). Taken together, the initial course of multiple sclerosis can be reasonably estimated to be relapsing–remitting in 85% and progressive in 15% of cases (Table 4.5).
It has been appreciated for half a century that men more often show a progressive onset of multiple sclerosis than women (R. Müller 1949; 1951). Symptoms related to dysfunction of long tracts are relatively more frequent in males, whereas optic nerve and brainstem features occur less often in progressive onset than relapsing–remitting multiple sclerosis (Table 4.8 ) (Confavreux et al 1980; McAlpine and Compston 1952; R. Müller 1949; 1951; Riise et al 1992; Trojano et al 1995). The proportion of progressive onset cases rises steadily with age (Table 4.9 ) (Confavreux 1977; Leibowitz et al 1964a; 1964b; McAlpine and Compston 1952; R. Müller 1949; 1951; Phadke 1990; S. Poser 1978; S. Poser et al 1982b); Weinshenker et al 1989a). Gender, clinical features, age and the course at onset are interdependent and there is much potential for confounding of contributing factors in these analyses. The strongest correlation between clinical variables and the initial course of the disease is with age at onset. Thus, we can caricature the progressive onset of multiple sclerosis as a disorder of motor deficits occurring in older males. This analysis says nothing concerning the contribution to disability of manifestations that are clinically silent but discretely contribute to the accumulation of disability preceding presentation. But whatever came before, the recognition of motor symptoms attributable to multiple sclerosis at onset indicates and predicts a more advanced subsequent course of the disease.
Table 4.8.
Distribution of patients (%) by initial symptoms according to the initial course of multiple sclerosis, among 574 patients.
| Initial course of multiple sclerosis |
||
|---|---|---|
| Relapsing–remitting | Progressive | |
| Pyramidal | 32 | 54 |
| Cerebellar | 16 | 23 |
| Brainstem | 24 | 7 |
| Sensory | 48 | 32 |
| Visual | 26 | 17 |
Adapted from Riise et al (1992)
© 2006
Table 4.9.
Percentages of patients with a progressive initial course of multiple sclerosis according to age at onset: data from the literature
| Age at onset of multiple sclerosis (years) | McAlpine and Compston 1952 n = 414 | Confavreux 1977 n = 349 | S. Poser et al 1982b n = 1529 | Weinshenker et al 1989a n = 1099 | Phadke 1990 n = 1055 |
|---|---|---|---|---|---|
| <20 | 0 | 3 | 9 | 18 | 3 |
| 20–29 | 5 | 10 | 13 | 19 | 4 |
| 30–39 | 14 | 25 | 27 | 38 | 5 |
| 40–49 |
24 |
24 |
41 | 63 |
14 |
| ≥50 | 29 | 45 | 74 | 27 | |
THE OVERALL COURSE OF MULTIPLE SCLEROSIS
Most patients with multiple sclerosis experience changes in their condition that are distinct and hence recognizable – but sometimes only in retrospect – each constituting a pivotal event in the course of the illness. Easiest to recognize are the individual relapses; more elusive, but of considerable significance for the eventual level of disability, is onset of the progressive phase. In recent years, it has become commonplace to refer to a first neurological episode suggestive of multiple sclerosis as the ‘clinically isolated syndrome’, provided this can reasonably be attributed to the dysfunction of optic nerves, brainstem or spinal cord, with acute or subacute onset followed by recovery, and in the context of paraclinical investigations excluding an explanation other than that of suspected multiple sclerosis (Barkhof et al 1997a; Filippi et al 1994; Morrissey et al 1993a; O’ Riordan et al 1998; Tintoré et al 2000). Some physicians restrict this term to situations in which the features are monosymptomatic, but these represent only a proportion of such episodes. Others also allow the term to indicate polysymptomatic presentations not attributable to a single central nervous system lesion, or any initial remitting episode whatever its neuroanatomical complexity. Amongst the subset of 1562 patients with an exacerbating–remitting onset of the disease in the Lyon, France, series, initial episodes were classified as monofocal or multifocal in 78% and 22% of cases, respectively. However, these monofocal initial episodes represent only 66% of the cases among the total cohort of 1844 patients with multiple sclerosis (Confavreux et al 2003). There is no evidence to suggest that the long-term course and prognosis of the disease are determined by the pattern of this initial episode – variously described by authors as monosymptomatic, polysymptomatic, monofocal or multifocal. Quite what they always mean is obscure and, as explained above, in order to avoid confusion, we use the term ‘initial neurological episode’ to cover these complexities of nomenclature.
Recovery from the initial neurological episode
On average, 85% of inaugural neurological episodes will remit, at least partially. The issue of spontaneous remission from symptoms at onset in multiple sclerosis has been studied in a series of 220 hospitalized male patients: the key predictive factor for remission was duration of the ongoing neurological episode prior to hospital admission (Kurtzke 1956). There was an inverse relationship between duration of the episode prior to admission and the probability of improvement (Table 4.10 ). The proportion of patients who improved decreased from 86%, when the episode lasted ≤7 days, to no improvement at all for the episodes lasting >2 years before admission. Interestingly, this decrease in the probability of improvement was steady throughout the 2-year interval prior to admission, without any discrete change allowing a recognizable frontier between exacerbation and progression to be established. The outcome of the ongoing neurological episode could not be correlated with age at onset of multiple sclerosis, duration of the disease at admission, age at admission, or symptoms, signs and severity of the neurological episode. However, conclusions regarding the possible lack of influence of age should be treated with caution due to the particular circumstances of inclusion in this Army series. However, the results – consistent with some earlier observations (R. Müller 1949) – were confirmed and extended in the cohort of 527 United States Army World War II Veterans (Kurtzke et al 1973). Here, both duration of the episode prior to admission and its severity as assessed on the DSS scale, showed additive effects: the shorter and more severe the episode, the more likely was improvement at discharge from hospital, a finding consistent with the common experience of physicians involved in the care of people with multiple sclerosis. Significantly, only one patient received corticosteroid treatment during hospitalization.
Table 4.10.
Chance of recovery (%) from the first neurological episode subsequent to hospitalization according to duration of the neurological episode, prior to admission, among 220 patients with multiple sclerosis.
| Duration of the episode before admission | Probability (%) of improvement of the episode |
|---|---|
| ≤7 days | 86 |
| 8–14 days | 64 |
| 15–31 days | 38 |
| 1.1–2.0 months | 18 |
| 2.1–6.0 months | 14 |
| 6.1–12 months | 18 |
| 1.1–2 years | 7 |
| >2 years | 0 |
Adapted from Kurtzke (1956)
© 2006
There is no consensus in the literature on just what should reasonably qualify as incomplete recovery from the first neurological episode. This is particularly difficult to assess in retrospect, by the time disability has accumulated inexorably. Therefore, we are still surprisingly ill-informed on just how good is recovery from the initial attack. For instance, 18% of the 1562 patients with an exacerbating–remitting disease course in the Lyon, France, series (Confavreux et al 2003) matched the definition of incomplete recovery – being the persistence of at least a minimum ambulation-related disability or a significant non-ambulation-related problem qualifying for a score of DSS 3 or more after the first neurological episode. Using a similar definition, Trojano et al (1995) observed incomplete recovery in 16% of 180 patients with relapsing–remitting multiple sclerosis and in 32% of 69 patients who had matured into the secondary phase during their earlier experience of relapsing–remitting multiple sclerosis. Using their own criteria, Eriksson et al (2003) observed incomplete recovery in 30% of 220 patients with a first acute episode suggestive of multiple sclerosis.
Taken together, these data clearly illustrate the difficulty that the clinician faces in deciding the nature, duration and consequences of early episodes when coming at the problem in retrospect, especially after the onset of secondary progressive multiple sclerosis (Goodkin et al 1989).
Development of the second neurological episode
This topic has recently stimulated renewed attention with the advent of possibilities for treatment. The occasion of a second neurological episode is sufficient for establishing that a person in the suspected category has converted to definite multiple sclerosis provided that the second episode involves a new site within the central nervous system (C.M. Poser et al 1983). This altered status may provide additional rationale for offering the patient disease modifying therapy.
McAlpine and Compston (1952) first demonstrated that the chance of a second neurological episode is highest immediately following the initial episode with a diminishing risk thereafter (Table 4.11 ). Their analysis was based upon crude data observed in 354 patients with ≥2 neurological episodes. According to this and other series, 65%, 45% and 25% of patients with a relapsing–remitting initial course of multiple sclerosis remain free from a second neurological episode at 1, 2 and 5 years of disease duration, respectively. A similar distribution was observed in the Lyon, France, series with median time interval of 2 years between the inaugural episode and the first relapse, both when performing the survival analyses early in the course (Confavreux 1977; Confavreux et al 1980) and when the cohort was larger and more mature (Table 4.12 and Figure 4.9 ; Confavreux et al 2000; 2003). These results are supported by a Norwegian study showing a 3.5-year mean time to reach the second neurological episode (Myhr et al 2001) compared with 4.2 years in the Lyon series (Confavreux et al 2000; 2003). That said, given the exponential decay of time to the second neurological episode, medians are to be preferred to means for its description. In fact, only a Swedish study has shown markedly different results (Eriksson et al 2003), with a median time to the second neurological episode of 3.25 years, as estimated by survival analysis. In this study, however, the assessments were restricted to cases with a ‘clinically isolated syndrome’ (see above) among the cases with an exacerbating–remitting onset of multiple sclerosis. In some of these long-term natural history series, analyses were performed to reveal clinical factors predictive of the time from onset of multiple sclerosis to the second neurological episode. Gender and age at onset of the disease had no effect (Confavreux et al 1980; Eriksson et al 2003), and neither did the mono- or multifocal nature of initial symptoms, or degree of recovery from the initial episode (Eriksson et al 2003; also C. Confavreaux and S. Vukusic, unpublished data) and overall course of multiple sclerosis – whether that is relapsing– remitting or secondary progressive at the time of assessment (Confavreux et al 1980). By contrast, visual or sensory symptoms at onset have been associated with a longer time to the second episode, and any spinal cord syndrome with a shorter interval (Eriksson et al 2003; Tintoré et al 2005; C. Confavreux and S. Vukusic, unpublished data).
Table 4.11.
Second neurological episode in multiple sclerosis: data from the main series of the long-term course and prognosis in multiple sclerosis
| Study | Time from the relapsing– remitting onset of multiple sclerosis to the second neurological episode (years) | Factors predictive of time from the relapsing– remitting onset of multiple sclerosis to the second neurological episode |
|---|---|---|
| Long-term natural history series with cross-sectional and/or some longitudinal assessment | ||
| McAlpine and Compston 1952 |
|
Not available |
| Myhr et al 2001 |
|
Not available |
| Long-term natural history cohorts with longitudinal follow-up | ||
| Lyon, France, multiple sclerosis cohort | ||
| Confavreux 1977 | Observed data | Observed data |
| Confavreux et al 1980 | 2 (median) |
|
| Confavreux et al 2000; 2003 |
|
Not available |
| Gothenburg, Sweden, multiple sclerosis cohort | ||
| Broman et al 1981 | Life table analysis | Life table analysis |
| Runmarker and Andersen 1993 | Cases with a ‘clinically isolated | Cox regression analysis |
| Eriksson et al 2003 |
|
|
SD = standard deviation.
SEM = standard error of the mean.
Table 4.12.
Kaplan–Meier estimates of the time (years) from onset of multiple sclerosis to the second neurological episode, among the 1562 patients with a relapsing-remitting initial course from the Lyon, France, multiple sclerosis cohort.
| Time (years) | 0 | 0.5 | 1 | 2 | 3 | 4 | 5 | 6 | 7 | 8 | 9 | 10 | 11 | 12 | 13 | 14 | 15 | 16 | 17 | 18 | 19 | 20 |
|---|---|---|---|---|---|---|---|---|---|---|---|---|---|---|---|---|---|---|---|---|---|---|
| Patients (%) free from second neurological episode | 100 | 81 | 63 | 47 | 37 | 30 | 26 | 22 | 18 | 15 | 14 | 12 | 10 | 9 | 8 | 7 | 6 | 5 | 4 | 4 | 3 | 3 |
| Median time (years) | Patients (%) who did not reach the end pointa | |
|---|---|---|
| Time to second neurological episode | 1.9 [95% CI 1.7–2.1] | 12 |
Data on patients who did not reach the end point were censored at the time of the last clinic visit.
Adapted from Confavreux et al (2003)
© 2006
Figure 4.9.
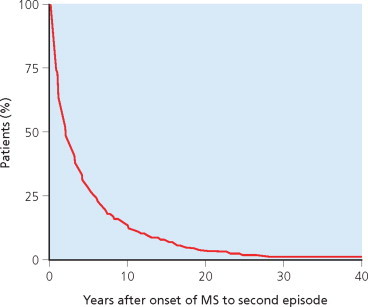
Kaplan–Meier estimates for the time (years) from onset of multiple sclerosis to the second episode, among the 1562 patients with a relapsing–remitting initial course in the Lyon, France, multiple sclerosis cohort.
Adapted from Confavreux et al (2003).
© 2006
A second source of information comes from the placebo arms of randomized controlled trials that specifically enrolled patients with a first neurological episode suggestive of multiple sclerosis – the Optic Neuritis Treatment Trial (ONTT: Beck 1995; Beck et al 1992; 1993a), Controlled High Risk Subjects Avonex® multiple sclerosis Prevention Study (CHAMPS: Beck et al 2002; Jacobs et al 2000) and Early Treatment Of multiple sclerosis (ETOMS: Comi et al 2001a) therapeutic trials. The cumulative probability according to Kaplan–Meier estimates of developing a second neurological episode qualifying for multiple sclerosis at 2 years was 18% in ONTT, 38% in CHAMPS, and 45% in ETOMS. By definition, only patients suffering from acute optic neuritis were enrolled in the ONTT trial whatever the results of brain MRI, while the CHAMPS trial enrolled patients with a monofocal episode involving the optic nerve (50%), spinal cord (28%) or brainstem/cerebellum (22%) with ≥2 T2 lesions on brain MRI at entry. In the ETOMS trial, patients were enrolled following either a monofocal (61%) or multifocal (39%) episode with ≥4 T2 lesions on brain MRI. These recruitment criteria presumably explain observed differences between these trials on the risk of developing a second neurological episode. It is well known that a significant proportion of acute optic neuritis will never convert to multiple sclerosis (Hickman et al 2002b). By contrast, recruitment criteria for the ETOMS trial were not restrictive with respect to clinical symptomatology of the initial episode. In this trial, median time to the second neurological episode was close to 2 years, consistent with the interval observed in long-term natural history series. According to the CHAMPS trial, the 2-year cumulative probability of developing a second episode is similar for optic neuritis, spinal cord syndromes, and brainstem/cerebellar syndromes (Beck et al 2002). The conversion rate was two times higher for multifocal than monofocal presentations in the ETOMS trial (Comi et al 2001a). Lastly, results from the ONTT, CHAMPS and ETOMS trials consistently showed a correlation between T2 lesion number on brain MRI at entry and the development of a second episode (Beck et al 1993a; CHAMPS Study Group 2002; Comi et al 2001a; Optic Neuritis Study Group 1997a). The presence of enhancing lesions on the baseline MRI proved the strongest predictor for development of a second episode in CHAMPS (CHAMPS Study Group 2002) but was not influential in ETOMS (Comi et al 2001a).
Although usually offering a small sample size, and possibly biased by substantial numbers of patients lost to follow-up, prospective observational studies devoted to patients presenting with clinically isolated episodes have consistently provided results of considerable interest regarding the predictive value of baseline MRI. Although these data are discussed fully in Chapter 7, the story is summarized here in order to supplement the clinically orientated studies under discussion. The presence of multifocal brain MRI abnormalities markedly increases the probability of a second neurological episode within 1–3 years (Barkhof et al 1997c; Brex et al 2001a; Ford et al 1992; Frederiksen et al 1991b; Lee et al 1991; Martinelli et al 1991; D.H. Miller et al 1988a; 1989b; Paty et al 1988; Tintoré et al 2000; 2003), but also after 5 (Morrissey et al 1993a), 10 (O’ Riordan et al 1998) and 14 years follow-up (Brex et al 2002). In the National Hospital, London, series of 89 patients, for instance, conversion to clinically definite multiple sclerosis was observed within 5 years in 65% of 57 cases with abnormal baseline T2 brain MRI (defined as ≥1 lesions compatible with multiple sclerosis) compared with 3% of 32 cases with normal MRI (Morrissey et al 1993a). For the 81 patients still followed at 10 years, the corresponding figures were 83% and 11% (O’ Riordan et al 1998). At 14 years, among the 71 patients still under scrutiny, conversion was observed in 88% and 19%, respectively (Brex et al 2002). The T2 lesion volume on brain MRI at presentation also plays a role, correlating positively with the risk of developing a second episode (Filippi et al 1994; Brex et al 2002). An inverse relationship between the initial T2 lesion load and time to development of a second episode has also been demonstrated (Filippi et al 1994). Several studies have shown that the presence of gadolinium enhancing lesions on T1-weighted brain MRI is a stronger predictor than the presence of T2 lesions for the probability of developing a second episode (Barkhof et al 1997a; Brex et al 2001a). An extensive analysis of the T2 and T1 parameters has also demonstrated that the presence of juxtacortical, infratentorial and periventricular lesions are all independent predictors for the short-term occurrence of a second neurological episode (Barkhof et al 1997a). Data gathered from early serial brain MRI add significantly to these predictions. The presence of new T2 lesions or gadolinium enhancing lesions on a brain MRI performed 3 months after the baseline MRI (Brex et al 2001a) or 12 months after the initial episode (Tintoré et al 2003) are both predictors for the appearance of a second episode. For instance, among 68 patients presenting with a monofocal episode in the United Kingdom study (Brex et al 2001a), the development of a second episode at 1 year was observed in 33% of the ‘baseline MRI T2 positive’ patients, 52% of the ‘baseline MRI T1 positive’ cases, 57% of the ‘repeatedly T2 positive’ individuals (defined by the presence of T2 lesions on baseline MRI and of new T2 lesions on the second scan performed 3 months later) and 70% of the ‘repeatedly T1 positive’ patients. Information gathered from the second MRI therefore improves the positive predictive value and the specificity of MRI for the development of a second episode. These results are obtained whilst still maintaining sensitivity at >80% for T2 criteria, but decreasing sensitivity from 61% with the baseline MRI only, to 39% with both brain sets of images using the T1 criteria. These data served as the rationale for adopting serial early brain MRI as a surrogate for dissemination in time in patients still at the clinical stage of a single neurological episode (W.I. McDonald et al 2001).
As discussed in Chapters 3, 7 and 11, typical abnormalities in the cerebrospinal fluid and evoked potentials, sampled at baseline, and the presence of HLA-DR15 antigen are all associated with a shorter time to the second episode. However, their predictive value has been found to be much lower than that of brain MRI features in studies that compared these predictors (Frederiksen et al 1991b; Lee et al 1991; Martinelli et al 1991; Morrissey et al 1993a; Paty et al 1988). Lately, in a study involving 103 patients with an initial monofocal episode, the presence of serum anti-myelin antibodies was associated with an adjusted hazard ratio for developing a second episode of 76 (95% CI 21–285), as compared with the seronegative patients (Berger et al 2003). Confirmation of these potentially promising data is required.
Relapse frequency
Despite much heated debate, consensus has not been reached on how often relapses actually occur in the relapsing–remitting phase of multiple sclerosis: estimates range from 0.1 to >1 per year. Such variability is not, in fact, surprising. We have already addressed the difficulties frequently encountered by the clinician in deciding whether the intensity of newly reported symptoms, or an increase in those that already exist, corresponds to recent activation of the disease process. But this judgment also relates to the frequency and timing of assessments. It has been well demonstrated that there are clear-cut differences in estimates of relapse frequency when comparing retrospective and prospective assessments, the latter usually yielding higher figures, and with more frequent scrutiny of the affected person with multiple sclerosis (Fog and Linnemann 1970; Patzold and Pocklington 1982). Therefore, prospective examinations at close intervals would appear the most sensitive strategy for the accurate assessment of relapse frequency. However, matters are not that simple. Indeed, the experience gathered lately from protocols using prospective follow-up of patients at monthly intervals has shown how often clinical assessors are faced with the difficult choice of calling subtle and transitory symptoms given the awareness of daily fluctuations in the experience of symptoms attributable to multiple sclerosis. Suspending judgment before taking a final decision is often wise. Moreover, for the reasons already discussed, prospective assessments at regular and close intervals throughout the duration of the disease for a large cohort of patients are not practical. Ambiguity and inaccuracy are therefore inevitably introduced, from the methodological standpoint, in the ascertainment of relapses in multiple sclerosis. But there is also true variation in relapse frequency – probably for biological reasons. This is clearly seen from the long-term follow-up of many individual patients, and in therapeutic trials recruiting participants with relapsing–remitting multiple sclerosis. Focusing on the untreated group, relapse rate is regularly found to be higher during the one or two years prior to inclusion than during the trial itself. ‘Regression to the mean’ arises from the fact that patients are often selected during periods of atypical disease activity before resuming their regular habits. Lastly, there are discrepancies in the methods for estimating relapse frequency. Some authors divide the total number of relapses by disease duration (in years) for all the patients in the cohort, whereas others only count relapses occurring during the relapsing–remitting phase of the disease. These sources of variability in evaluating the relapse rate are so influential that it is somewhat risky to compare results between various series; and experience gained from historical controls must not serve as a reference for the study of interest.
The available literature does, however, provide several interesting indicators. In the cross-sectional studies with ensuing retrospective assessment, the relapse rate is usually ≤0.5 per year: rates of 0.39, 0.28, 0.26 and 0.32 per year were observed by McAlpine and Compston (1952), Leibowitz et al (1964a), Panelius (1969), and Myhr et al (2001), respectively. Conversely, in studies with longitudinal prospective assessments, the relapse rate is usually >0.5 per year: estimates of 0.56, 0.86, 1.1 and 0.64 were reported by Fog and Linnemann (1970), Confavreux et al (1980), Patzold and Pocklington (1982), and Goodkin et al (1989), respectively. The results of these prospective studies are fairly consistent with the figure of 2 years for the median time from onset of multiple sclerosis to the second episode, and the same interval before the next in subsequent epochs, during the relapsing–remitting phase of the disease (C. Confavreux and S. Vukusic, unpublished data). It may be concluded that 0.5 or slightly more is a reasonable estimate of the yearly relapse rate in a standard, representative population of patients with relapsing–remitting multiple sclerosis.
Gender and age at onset have consistently been found not to influence the frequency of episodes (Confavreux et al 1980; Leibowitz and Alter 1973; Leibowitz et al 1964a; 1964b; McAlpine and Compston 1952; Panelius 1969), with the exception of a Swedish study in which age at onset correlated inversely with relapse rate (Broman et al 1981). Many authors consider that relapse rate declines with disease duration (Broman et al 1981; Leibowitz et al 1964a; McAlpine and Compston 1952; R. Müller 1949; Myhr et al 2001; Panelius 1969; Patzold and Pocklington 1982). For instance, McAlpine and Compston (1952) found an average relapse rate of 0.4 during the first 5 years of the disease, falling to 0.22 at 20–24 years. This has been challenged by a North American study in which the relapse rate, determined prospectively, was stable during the 3-year follow-up and uninfluenced by overall disease duration (Goodkin et al 1989). The evidence for a stable rate matches our own results, at least when calculations are restricted to the relapsing–remitting phase (Confavreux et al 1980). Furthermore, once the disease has entered its progressive and chronic disabling stage, relapse detection tends to become less prioritized and therefore more easily overlooked, resulting in an under-ascertainment of new episodes.
Onset of progression
Despite the methodological difficulties already discussed, inter-examiner reliability in assessing the onset of progression is reasonable. For instance, in a Dutch study involving 236 patients with primary or secondary progressive multiple sclerosis, agreement between three observers in determining the year of onset for progression was obtained in 62% of the secondary progressive cases and 78% of those with primary progressive multiple sclerosis (Minderhoud et al 1988). In the collaborative multicentre EVALUED study – involving six European centres, 180 patients with multiple sclerosis and, for each centre, two examiners and 30 patients – inter-examiner reliability was almost perfect with a kappa value of 0.92 when cases had to be categorized according to an exacerbating–remitting or progressive onset (Amato et al 2004). When both examiners had to decide on the development of secondary progression, agreement was again substantial with a kappa value of 0.76. When they had to date the onset of secondary progression, agreement was reached between both examiners within 1 year in 72% of cases.
Our current knowledge on the onset of progression in multiple sclerosis has a reasonably secure evidence base (Table 4.13 ). Considering a cohort of patients with multiple sclerosis, including those with progression from onset, estimates of the time from onset of multiple sclerosis to progression are reasonably consistent. With calculations based upon observational data only, R. Müller (1949; 1951) found a median time to progression of 10 years. Using survival techniques, median time to progression turned out to be 11 years in the Lyon, France, series (Confavreux 1977; Confavreux et al 1980) and 9 years in the Gothenburg, Sweden, cohort (Eriksson et al 2003; Runmarker and Andersen 1993). In the cases from London, Ontario, the corresponding figure was only 5.8 years (Weinshenker et al 1989a) but it must be remembered that the proportion of cases classified as progressive from onset was unusually high in this cohort. In all these studies, age at onset was a strong predictor of time to progression, as expected from the observation that the proportion of progressive from onset relative to relapsing– remitting multiple sclerosis increases with age at presentation (see above).
Table 4.13.
Progression in multiple sclerosis: data from the main series describing the long-term course and prognosis
| Study | Time from onset of multiple sclerosis to progression (years) | Factors predictive of time from onset of multiple sclerosis to progression (years) |
|---|---|---|
| Long-term natural history series with cross-sectional and/or some longitudinal assessment | ||
| R. Müller 1949; 1951 |
|
|
| McAlpine and Compston 1952 |
|
|
| Riise et al 1992 | Not available |
|
| Trojano et al 1995 | Not available |
|
| Myhr et al 2001 |
|
Not available |
| Long-term natural history cohorts with longitudinal follow-up | ||
| Lyon, France, multiple sclerosis cohort | ||
|
|
|
|
|
|
| Gothenburg, Sweden, multiple sclerosis cohort | ||
|
|
|
| London, Ontario, multiple sclerosis cohort | ||
| Weinshenker et al 1989a; 1989b |
|
Not available |
| Long-term history series from the therapeutic era | ||
|
|
|
SD = standard deviation.
SEM = standard error of the mean.
Time to end point (onset of progression) estimated by the survival analysis using the second episode as starting point.
Time to end point (onset of progression) estimated by the survival analysis using 5 years after onset as starting point.
The other strategy for addressing the onset of progression is to consider only the population of cases with an exacerbating– remitting onset of multiple sclerosis. This focuses on an issue of utmost importance for many patients and clinicians, because the emergence of secondary progression predicts disability and sets the stage for a less optimistic prognosis from that point forwards. Here, the literature is consistent (Table 4.13). McAlpine and Compston (1952) are to be credited with first clearly demonstrating that ‘there is a fairly constant rate of change from a remitting to a progressive course, and a gradual rise in the total percentage of progressive cases as the disease advances’. A similar distribution has been found with analyses restricted to observational data by Broman et al (1981) and with survival analyses in the Lyon, France, series (Confavreux 1977; Confavreux et al 1980; Vukusic and Confavreux 2003b). The median time to secondary progression among the 1562 patients with an exacerbating–remitting onset in the Lyon, France, series was 19.1 years (Table 4.14 and Figure 4.10 ). From their population of 220 patients presenting with a ‘distinct clinically isolated syndrome’, Swedish authors observed a median of 19.0 years (Eriksson et al 2003). In their series of 190 patients with an exacerbating–remitting onset of multiple sclerosis, Italian authors estimated the 70th percentile time to onset of secondary progression at 11 years (Amato and Ponziani 2000; Amato et al 1999), a figure precisely matching those from Lyon, France. Lastly, among their 179 patients with an exacerbating–remitting onset of multiple sclerosis, Myhr et al (2001) identified the 57th percentile time to onset of secondary progression at 19 years. It seems reasonable to conclude that 19 years is a reasonable estimate for the median time to secondary progression following an exacerbating–remitting onset in multiple sclerosis.
Table 4.14.
Kaplan–Meier estimates of the time (years) from onset of multiple sclerosis to the onset of secondary progression, among the 1562 patients with a relapsing–remitting initial course from the Lyon multiple sclerosis cohort.
| Time (years) | 0 | 0.5 | 1 | 2 | 3 | 4 | 5 | 6 | 7 | 8 | 9 | 10 | 11 | 12 | 13 | 14 | 15 | 20 | 25 | 30 | 35 | 40 |
|---|---|---|---|---|---|---|---|---|---|---|---|---|---|---|---|---|---|---|---|---|---|---|
| Patients (%) free of secondary progression | 100 | 99 | 98 | 96 | 93 | 90 | 87 | 84 | 82 | 79 | 76 | 73 | 70 | 67 | 64 | 62 | 60 | 48 | 42 | 33 | 23 | 18 |
| Median time (years) | Patients (%) who did not reach the end pointa | |
|---|---|---|
| Time to secondary progression | 19.1 [95% CI 17.1–21.1] | 68 |
Data on patients who did not reach the end point were censored at the time of the last clinic visit.
Adapted from Vukusic and Confavreux (2003b)
© 2006
Figure 4.10.

Kaplan–Meier estimates for the time (years) from onset to the secondary progressive phase among the 1562 patients with a relapsing–remitting initial course in the Lyon, France, multiple sclerosis cohort.
Adapted from Vukusic and Confavreux (2003b).
© 2006
Age at onset of multiple sclerosis is, by far, the strongest predictor of the conversion to secondary progression (see Table 4.13): the older the age at onset, the shorter the time to onset of progression (Confavreux et al 1980; Eriksson et al 2003; R. Müller 1949; 1951; Riise et al 1992; Runmarker and Andersen 1993; Trojano et al 1995); Vukusic and Confavreux 2003b). In contradistinction to these rather consistent observa tions, the cohort from Italy is the only one to conclude that age at onset of multiple sclerosis does not influence time to secondary progression (Amato and Ponziani 2000). The effect of clinical variables, other than age at onset, on the time to secondary progression is weaker or nonexistent. For example, male gender is associated with a shorter time to progression in many series (Eriksson et al 2003; R. Müller 1949; 1951; Runmarker and Andersen 1993; Vukusic and Confavreux 2003b) but not in others (Amato and Ponziani 2000; Confavreux et al 1980; McAlpine and Compston 1952; Riise et al 1992; Trojano et al 1995). No study has detected a deleterious influence of female gender on the time to progression. With respect to initial symptoms, most series indicate that symptoms related to the optic nerve, the sensory tracts and, sometimes, the brainstem are associated with a longer time to secondary progression, whereas spinal cord-related manifestations correlate with a shorter interval (Confavreux et al 2003); Eriksson et al 2003; R. Müller 1949; 1951; Riise et al 1992; Runmarker and Andersen 1993; Vukusic and Confavreux 2003b). In a series from southern Italy, initial symptoms had no influence on the time to secondary progression (Trojano et al 1995). The Florence, Italy, study led to discordant results, because visual symptoms at onset were associated with a shorter conversion to progression (Amato and Ponziani 2000). An incomplete recovery from the initial exacerbation has regularly been associated with a shorter time to secondary progression (Amato and Ponziani 2000; Eriksson et al 2003; Trojano et al 1995). The same is true for the effect of a brief period between onset of multiple sclerosis and the second episode (Amato and Ponziani 2000; Confavreux et al 1980; Trojano et al 1995); Vukusic and Confavreux 2003b); but this is not observed in all series (Eriksson et al 2003). Surprisingly, in the Florence, Italy, study (Amato and Ponziani 2000), a shorter time to the second episode was associated with a longer interval before the onset of secondary progression. R. Müller (1949; 1951) described an inverse relationship between relapse rate in the first 2–5 years of the disease and time to secondary progression. This has not been observed in other series (Amato and Ponziani 2000; Amato et al 1999); Eriksson et al 2003; Trojano et al 1995). In a Norwegian study, the clinical status observed five years after the onset of multiple sclerosis provided additional information: time to progression correlated inversely with disability score and the number of affected functional systems (Eriksson et al 2003). Lastly, in the only study that has addressed this issue to date, there is some indication that the presence of IgG oligoclonal bands in the cerebrospinal fluid, or abnormalities on the brain MRI at presentation, are associated with faster conversion to secondary progression (Amato and Ponziani 2000; Amato et al 1999).
Taken together, the evidence is that relapsing–remitting multiple sclerosis in males, with older age at onset, involvement of long tracts, a shorter interval between the inaugural episode and first relapse, and incomplete recovery from attacks show a shorter time to onset of progression and more disability at five years.
THE PROGNOSIS IN MULTIPLE SCLEROSIS
Every patient is anxious to know, at various stages throughout the illness, whether the prognosis for disability can be predicted. In fact, details of the time course over which irreversible disability evolves in multiple sclerosis and the eventual outcome do have a reasonable evidence base. But, although the various informative series in the literature show reasonable consistency, it is also worth emphasizing that these conclusions are smoothed out by statistical analysis of populations of patients; and the apparent homogeneity between series conceals extensive individual variation in the course of multiple sclerosis. A third rather unexpected element, but known since the 1970s, is the apparent predictable rate at which disability accumulates.
Accumulation of Disability
The long-term follow-up of natural history cohorts from Lyon, France (Confavreux 1977; Confavreux et al 1980; 2000; 2003), Gothenburg, Sweden (Broman et al 1981; Eriksson et al 2003; Runmarker and Andersen 1993) and London, Ontario (Weinshenker et al 1989a; 1989b; 1991a) provides useful information on the accumulation of disability. Several other natural history cohorts providing cross-sectional follow-up (Kantarci et al 1998; Myhr et al 2001), or shorter but nevertheless long-term study of a cohort (Amato and Ponziani 2000; Amato et al 1999), have also proved informative (Table 4.15 ). Each of these series is, in many respects, representative of the disease in an essentially untreated population. The issue of time from onset of multiple sclerosis to assignment of disability landmarks is addressed using life table analysis techniques. Each took DSS 6 to represent a major outcome, describing this as ‘assistance required for walking’ (Kurtzke 1961) or, more precisely, as the need for unilateral support to walk ≤100 metres without rest. Conversely, they differed in their treatment of other disability milestones. At the lower end of the disability spectrum, the London, Ontario, study (Weinshenker et al 1989a; 1989b; 1991a) and a Turkish study (Kantarci et al 1998) focused on DSS 3, describing this as ‘moderate dysfunction (monoparesis or mild hemiparesis)’ (Kurtzke 1961; Kurtzke et al 1973). In Lyon, France (Confavreux et al 1980; 2000; 2003), Gothenburg, Sweden (Eriksson et al 2003; Runmarker and Andersen 1993) and Florence, Italy (Amato and Ponziani 2000) the investigators favoured DSS 4, describing this as ‘relatively severe dysfunction not interfering with ability to work’ (Kurtzke 1961; Kurtzke et al 1973) or, more precisely, as limited walking ability without aid or rest for ≥500 metres. When dealing with higher levels of disability, the London, Ontario, and the Turkish studies considered DSS 8, describing this as ‘restricted to bed but with effective use of arms’ (Kurtzke 1961; Kurtzke et al 1973), while the French and Norwegian studies focused on DSS 7, defining this as ‘restricted to wheelchair’ (Kurtzke 1961; Kurtzke et al 1973) or, more precisely, as an ability to walk ≤10 metres without rest, while leaning against a wall or holding onto furniture. In the Lyon, France, study the emphasis was on irreversible disability; this was assigned only when a given score had persisted for ≥6 months, excluding any transient worsening of disability related to relapse. By definition, when irreversible disability at a given DSS level had been reached, all disability scores during the follow-up of that patient were either equal to or higher than that score. This was automatically checked by the EDMUS software through an appropriate algorithm, and the long duration of follow-up inherent to this natural history study allowed a sufficient period of observation to ensure that, sadly, the disability was indeed irreversible.
Table 4.15.
Time course of irreversible disability in multiple sclerosis.
| Study | Time from onset of multiple sclerosis to reach selected levels of irreversible disability (years) | Factors predictive of time from onset of multiple sclerosis to irreversible disability |
|---|---|---|
| Long-term natural history series with cross-sectional and/or some longitudinal assessment | ||
| R. Müller 1949; 1951 | Not available |
|
|
Not available |
|
| Panelius 1969 | Not available |
|
| S. Poser 1978 | Not available |
|
| S. Poser et al 1982b | Not available |
|
|
Not available |
|
| Phadke 1987; 1990 | Not available |
|
| D.H. Miller et al 1992a | Not available |
|
| Riise et al 1992 | Not available |
|
| Kantarci et al 1998 |
|
|
| Myhr et al 2001 |
|
|
| Long-term natural history cohorts with longitudinal follow-up | ||
| United States Army Veterans World War II multiple sclerosis cohort | ||
| Kurtzke et al 1968a; 1970a; 1973; 1977 | Not available |
|
| Lyon, France, multiple sclerosis cohort | ||
|
|
|
| Confavreux et al 2000; 2003 |
|
|
| Gothenburg multiple sclerosis cohort | ||
|
|
|
| London, Ontario, multiple sclerosis cohort | ||
| Weinshenker et al 1989a; 1989b; 1991a |
|
|
| Long-term history series from the therapeutic era | ||
|
|
|
SD = standard deviation.
SEM = standard error of the mean.
Time to end point (DSS 6) estimated by the survival analysis using the second episode as starting point.
Time to end point (DSS 6) estimated by the survival analysis using five years after onset of multiple sclerosis as starting point.
Time to end point (DSS 6) estimated by the survival analysis using time of assignment of DSS 3 as starting point.
Data from the main series of the long-term course and prognosis of multiple sclerosis
The different points of interest regarding disability landmarks in series from the literature inform just about the full spectrum of disability in multiple sclerosis (Table 4.15). The median time from onset of multiple sclerosis to assignment of DSS 3 was estimated at 7.7 years in the London, Ontario, series (Weinshenker et al 1989a); and at 11 years in the Turkish study (Kantarci et al 1998). Time to DSS 4 has been variously estimated at 6 years (Confavreux et al 1980), 8.4 years (Confavreux et al 2000; 2003) and 12.7 years (Amato and Ponziani 2000). Perhaps the last figure is overestimated, because the difference in median times to reach DSS 4 and DSS 6 is only 1.4 years in the Florence, Italy, series. Most information is available for DSS 6 and, here, the evidence is generally consistent. The median time from onset of multiple sclerosis to assignment of DSS 6 is 15.0 years in the London, Ontario, series (Weinshenker et al 1989a); 18 years in the Gothenburg, Sweden, study (Runmarker and Andersen 1993) and the Turkish study (Kantarci et al 1998); 14.1 years in Florence, Italy (Amato and Ponziani 2000); 20 years in the Norwegian study (Myhr et al 2001); and 20.1 years in Lyon, France (Confavreux et al 2000; 2003). As for DSS 7, the estimated median time in the Lyon, France, series was variously estimated at 18 years (Confavreux et al 1980) and 29.9 years (Confavreux et al 2000; 2003). In another series Myhr et al (2001) found the 76th percentile time to reach DSS 7 to be 15 years. Our interpretation of this difference over a 20-year period is that, in 1980, the median time was underestimated because the French sample was then exclusively hospital based. Lastly, for DSS 8 the median time was 46.4 years in the London, Ontario, series and the 75th percentile was reached at 28 years in Turkey. Kaplan–Meier estimates for times from onset of multiple sclerosis to assignment of irreversible disability scores of DSS 4, DSS 6 and DSS 7 among the 1844 patients with multiple sclerosis in the Lyon multiple sclerosis cohort are 8.4 years (95% CI 7.6–9.2), 20.1 years (95% CI 18.2–22.0), and 29.9 years (95% CI 25.8–34.1), respectively (Table 4.16 and Figure 4.11 ).
Table 4.16.
Kaplan–Meier estimates of the time (years) from onset of multiple sclerosis to the assignment of disability DSS scores, among the 1844 patients in the Lyon, France, multiple sclerosis cohort.
| Time (years) | 0 | 0.5 | 1 | 2 | 3 | 4 | 5 | 6 | 7 | 8 | 9 | 10 | 11 | 12 | 13 | 14 | 15 | 20 | 25 | 30 | 35 | 40 |
|---|---|---|---|---|---|---|---|---|---|---|---|---|---|---|---|---|---|---|---|---|---|---|
| Patients (%) free of | ||||||||||||||||||||||
| DSS 4 | 100 | 82 | 79 | 73 | 69 | 65 | 61 | 58 | 56 | 52 | 49 | 47 | 44 | 41 | 39 | 37 | 35 | 26 | 17 | 13 | 6 | 0 |
| DSS 6 | 100 | 99 | 98 | 96 | 92 | 89 | 86 | 83 | 80 | 77 | 74 | 72 | 70 | 67 | 63 | 62 | 59 | 50 | 42 | 36 | 28 | 23 |
| DSS 7 | 100 | 100 | 100 | 99 | 98 | 97 | 95 | 93 | 91 | 89 | 87 | 85 | 83 | 81 | 79 | 77 | 75 | 65 | 55 | 50 | 43 | 37 |
| Median time (years) | Patients (%) who did not reach the end pointa | |
|---|---|---|
| Time to DSS 4 | 8.4 [95% CI 7.6–9.2] | 44 |
| Time to DSS 6 | 20.1 [95% CI 18.2–22.0] | 68 |
| Time to DSS 7 | 29.9 [95% CI 25.8–34.1] | 79 |
Data on patients who did not reach the end point and were censored at the time of the last clinic visit.
Adapted from Confavreux et al (2000; 2003)
© 2006
Figure 4.11.

Kaplan–Meier estimates for the time (years) from onset of multiple sclerosis to the assignment of DSS 4, 6, 7 and 10, among the 1844 patients in the Lyon, France, multiple sclerosis cohort.
Adapted from Confavreux et al (2000; 2003).
© 2006
Inter-Individual Variability
The time intervals offered in the previous section are only global estimates for the prognosis of multiple sclerosis. They allow the archetypal profile of severity to be summarized. The reality is somewhat different. Disease severity may vary considerably from one person to another, as is made clear both to patients and physicians on a daily basis. Considering individuals, the full spectrum of disease is observed – ranging from asymptomatic multiple sclerosis, to benign forms compatible with normal life, so-called malignant variants that prove rapidly disabling, and cases where the condition is immediately life threatening. This variability is represented by the 95% confidence intervals of the time to reach disability landmarks estimated by survival analyses. Self-evidently, they are wide but, thus far, this aspect has not received sufficient critical attention in the literature. The first thorough attempt at documenting and quantifying inter-individual variability in the severity of multiple sclerosis can be credited to Fog and Linnemann (1970). In their prospective longitudinal study of 73 patients followed at 3-month intervals over several years, these Danish authors were able to show how the slope of neurological deterioration, derived from a quantitative neurological examination, could vary from one patient to another. They depicted their observations as a ‘fan diagram’ (Figure 4.12 ).
Figure 4.12.
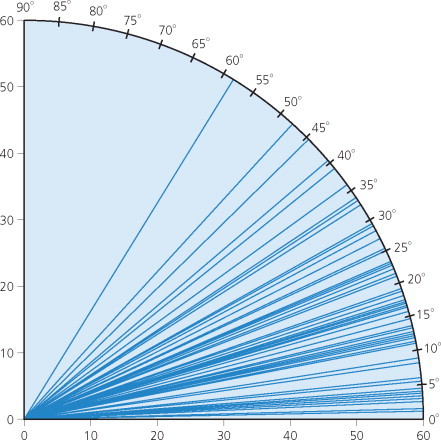
Individual slopes of neurological deterioration as assessed from serial quantitative neurological examinations performed at 3-month intervals over several years, among 73 patients with multiple sclerosis. For each patient, the recorded slope has been converted to a linear curve following a regression analysis.
Adapted from Fog and Linnemann (1970). © 1970, with permission from Blackwell Publishing Ltd.
© 2006 Blackwell Publishing Ltd.
Another approach has been to distribute patients by combining the score of irreversible disability last registered with disease duration to generate a severity classification. This method was applied to the Lyon, France, study (Confavreux et al 1980). ‘Benign’ forms corresponded to DSS score ≤3 after 10 years, or 4–6 after 15 years of disease duration. ‘Hyperacute’, ‘acute’, ‘subacute’ and ‘intermediate’ forms corresponded to DSS ≥7 reached within <5, 5–10, 10–15 and >15 years, respectively. With this classification, benign multiple sclerosis represented 14% in the French series whereas hyperacute, acute, subacute and intermediate forms applied to 8%, 8%, 5% and 4%, respectively. A similar classification has been used in a Scottish study, leading to an estimate of 26% benign cases (Phadke 1990). An inherent limitation to this approach is the great number of ‘nonclassified’ cases (60% in the Lyon, France, series) owing to the limited disease duration at the time of assessment. Self-evidently, some patients initially distributed in the benign group may change course as the disease advances leading to more rapid accumulation of disability. This approach to classification of severity is not therefore satisfactory and should be abandoned, at least when follow-up is short.
The distribution of patients by progression index, calculated for each individual by dividing the DSS score at last follow-up with disease duration (years), was studied in 221 patients with multiple sclerosis in southern Lower Saxony (Figure 4.13 ; S. Poser et al 1982a). The distribution of progression index was linear, notably within the 0–1.2 range, and then reached a ceiling. This did not provide very discriminating results. Benign cases were defined in this study by a progression index of ≤0.2, indicating disability worsening by ≤1 point within a 5-year period. For malignant cases, the progression index was ≥1.4, which equates to a worsening of ≥7 steps within a 5-year period. Applying these definitions, 36% and 2% of the cases could be categorized as benign and malignant, respectively.
Figure 4.13.

Cumulative percentages of patients according to the progression index, among 221 patients with multiple sclerosis from southern Lower Saxony, Germany.
Adapted from S. Poser et al (1982b). © 1982, with permission from Blackwell Publishing Ltd.
© 2006 Blackwell Publishing Ltd.
Another device for distributing patients at a given level of disability according to severity focuses on the time taken to reach a given milestone (Confavreux 1977; Weinshenker et al 1989b). Alternatively, patients are distributed by disability according to given intervals of disease duration. Thus, Achiron et al (2003) considered serial EDSS assessments of 1317 Israeli patients with definite relapsing–remitting multiple sclerosis followed at 3–6-month intervals for ≤10 years after onset. As discussed in Chapter 6, the most recent approach has been to assign an integral of disability and duration to a particular decile within the distribution observed in a large cohort of cases having equivalent disease durations (Roxburgh et al 2005a). Although based upon observational data only and not restricted to the first time a given irreversible level of disability has been assigned during the disease course, both indices allow inferences to be made concerning the estimated median times to reach disability levels. Their results show consistency with those provided by survival analyses in the long-term longitudinal natural history cohorts (see above).
Intra-Individual Consistency
For any clinician experienced in the management of multiple sclerosis, initially the dominant clinical feature in the majority of patients is the succession of relapses alternating with periods of apparent clinical stability. It may therefore come as something of a surprise to spot that serial quantitative neurological examinations over several years chart steady progression of neurological abnormalities showing, after regression analysis, a linear or curvilinear (with a small inflexion) pattern. This is no less true for cases with a purely relapsing–remitting course than for those with relapses superimposed on disease progression. Again, this was first demonstrated by Fog and Linnemann (1970) in their 73 patients with multiple sclerosis, and later confirmed, using a similar approach, by Patzold and Pocklington (1982) in a study of 102 patients (Figure 4.14 ). For the majority of patients, it has thus become possible to draw a slope of neurological deterioration that is remarkably stable over many years. According to Fog and Linnemann (1970), once this has been allocated to an individual, it is possible to extrapolate the future course and make prognostic predictions tailored to that individual. Unfortunately, in order to get an accurate and sufficiently precise assessment, suitable for reliable predictions, several years of serial examination are necessary, justifiably attracting the criticism that this is now a post hoc prognostication, and therefore of limited clinical application.
Figure 4.14.

Serial quantitative neurological examinations over several years in two individual patients with multiple sclerosis (A and B). In both cases, the observed clinical ‘saw-toothed’ curve could, after regression analysis, be transformed into mathematical curves. The ‘best’ fitting curve is selected from the highest correlation coefficient with the clinical curve.
Adapted from (A) Fog and Linnemann (1970). © 1970, with permission from Blackwell Publishing Ltd. (B) Patzold and Pocklington (1982). © 1982, with permission from Blackwell Publishing Ltd.
© 2006 Blackwell Publishing Ltd.
That said, rather a similar linear evolution has subsequently been observed for the T2 hyperintense lesion load, the T1 hypointense lesion load, the ventricular volume and the partial brain volume on brain MRI, and for the cervical area on spinal cord MRI in 41 patients with primary progressive multiple sclerosis followed prospectively for 5 years (Ingle et al 2003). In this study, rates of change for MR measures were consistent within individuals but different between patients, in agreement with the intra-individual fixity and the inter-individual variability observed clinically by Fog and Linnemann (1970) and Patzold and Pocklington (1982). Correlations between the clinical changes, as assessed by the EDSS and the multiple sclerosis Severity Score, and the MR measures were either absent or weak.
Factors affecting prognosis
The results of the many long-term studies of natural history cohorts provide consistent clues (Table 4.15). Here, we focus on demographic and clinical variables; paraclinical features, including MRI, are discussed in Chapter 7. Our discussion follows the same pattern as for other indices in considering the effects of gender, symptoms at onset, and the initial clinical course on prognosis.
Features at onset
The three long-term longitudinal studies from London, Ontario (Weinshenker et al 1989a; 1989b; 1991a), Gothenburg, Sweden (Eriksson et al 2003; Runmarker and Andersen 1993), and Lyon, France (Confavreux et al 2000; 2003) each found an association between male gender and shorter time to reach disability landmarks. A similar trend has been observed in several cross-sectional studies (Detels et al 1982; Kantarci et al 1998; D.H. Miller et al 1992a); R. Müller 1949; 1951; Panelius 1969) whereas others found no effect of gender (Amato and Ponziani 2000; Myhr et al 2001; Phadke 1987; S. Poser 1978; Riise et al 1992; Thygesen 1955). Only in an Israeli study did female sex turn out to be associated with worse outcome (Leibowitz and Alter 1970; 1973; Leibowitz et al 1964a; 1964b). All studies lead to the conclusion that, when present, the influence of gender on prognosis is weak.
The vast majority of the studies consistently reveal that age at onset of multiple sclerosis is predictive of disability: the older the age at onset, the shorter the time to disability. This has been observed in the long-term longitudinal studies (Broman et al 1981; Confavreux et al 1980; 2000; 2003; Eriksson et al 2003; Runmarker and Andersen 1993; Weinshenker et al 1989a; 1989b; 1991a) and other series (Bonduelle 1967; Kantarci et al 1998; Leibowitz et al 1964a; 1964b; McAlpine 1961; D.H. Miller et al 1992a); R. Müller 1949; 1951; Myhr et al 2001; Panelius 1969; Phadke 1987; 1990; S. Poser et al 1982b); Riise et al 1992; Thygesen 1955; Visscher et al 1984). Only German (S. Poser 1978) and Italian studies (Amato and Ponziani 2000) concluded that age at onset of multiple sclerosis does not influence the prognosis; the United States Army Veterans World War II cohort provides a similar result but this may reflect the criterion only to enrol military personnel in this series (Kurtzke et al 1968a; 1970a; 1973; 1977).
Presentation with optic neuritis is associated with longer time to disability landmarks, whilst onset with a spinal cord syndrome, or motor and cerebellar features, correlates with shorter time to disability (V.A. Clark et al 1982; Confavreux et al 2000; 2003; Detels et al 1982; Eriksson et al 2003; Kantarci et al 1998; McAlpine 1961; D.H. Miller et al 1992a); R. Müller 1949; 1951; Phadke 1987; 1990; S. Poser et al 1982b); Riise et al 1992; Runmarker and Andersen 1993; Visscher et al 1984); Weinshenker et al 1989a; 1989b; 1991a). Some authors have not detected a significant influence of initial symptoms on the final outcome (Kurtzke et al 1968a; 1970a; 1973; 1977; Leibowitz and Alter 1970; 1973; Leibowitz et al 1964a; 1964b; Myhr et al 2001). In an Italian study, visual symptoms at onset were associated with a more rapid course of the disease (Amato and Ponziani 2000). For some authors, the greater the number of affected functional systems at onset, the shorter the time to disability (Amato and Ponziani 2000), but others disagree (Kantarci et al 1998).
The initial course of multiple sclerosis is the strongest clinical predictor of disability: a progressive course from onset is associated with a shorter time to reach disability landmarks, compared with cases with relapsing–remitting multiple sclerosis. This conclusion is consistent in the essentially cross-sectional series (Amato and Ponziani 2000; Kantarci et al 1998; Leibowitz and Alter 1970; 1973; Leibowitz et al 1964a; 1964b; D.H. Miller et al 1992a); R. Müller 1949; 1951; Myhr et al 2001; Phadke 1987; 1990; S. Poser 1978; S. Poser et al 1982b); Riise et al 1992) and longitudinal series (Broman et al 1981; Confavreux et al 1980; 2000; 2003; Eriksson et al 2003; Runmarker and Andersen 1993;Weinshenker et al 1989a; 1989b; 1991a). Using the Kaplan–Meier method of life table analysis for 1844 patients with multiple sclerosis in the Lyon, France, cohort (Confavreux et al 2000; 2003), the difference in median interval from onset to reach DSS 4, 6 and 7 between cases with an initial exacerbating–remitting and progressive course, was 11, 16 and 20 years, respectively (p < 0.001, for each comparison: Table 4.17 and Figure 4.15 ). Taking DSS 6 and 7 as the outcomes, life table analysis of the Norwegian study also shows that patients with an exacerbating–remitting initial course have a much more favourable outcome than those with primary progressive multiple sclerosis (p < 0.001; Table 4.18 ; Myhr et al 2001).
Table 4.17.
Kaplan–Meier estimates of the time (years) from onset of multiple sclerosis to the assignment of disability status scale scores among the 1844 patients from the Lyon multiple sclerosis cohort. Influence of the initial course of the disease. A: estimates for the 1562 patients with a relapsing–remitting initial course of multiple sclerosis (see Figure 4.15A). B: estimates for the 282 patients with a progressive initial course of multiple sclerosis (see Figure 4.15B).
| A: Patients with a relapsing–remitting initial course of multiple sclerosis (n = 1562) | ||||||||||||||||||||||
|---|---|---|---|---|---|---|---|---|---|---|---|---|---|---|---|---|---|---|---|---|---|---|
| Time (years) | 0 | 0.5 | 1 | 2 | 3 | 4 | 5 | 6 | 7 | 8 | 9 | 10 | 11 | 12 | 13 | 14 | 15 | 16 | 17 | 18 | 19 | 20 |
| Patients (%) free of | ||||||||||||||||||||||
| DSS 4 | 100 | 91 | 89 | 84 | 79 | 75 | 71 | 68 | 65 | 61 | 58 | 56 | 52 | 49 | 46 | 44 | 42 | 40 | 38 | 35 | 34 | 31 |
| DSS 6 | 100 | 99 | 98 | 97 | 95 | 93 | 91 | 89 | 86 | 84 | 82 | 80 | 77 | 75 | 71 | 69 | 66 | 63 | 62 | 60 | 59 | 57 |
| DSS 7 | 100 | 100 | 100 | 99 | 99 | 97 | 96 | 95 | 94 | 92 | 90 | 88 | 87 | 85 | 83 | 82 | 80 | 79 | 76 | 73 | 72 | 71 |
| Median time (years) | Patients (%) who did not reach the end pointa | |
|---|---|---|
| Time to DSS 4 | 11.4 [95% CI 10.5–12.3] | 52 |
| Time to DSS 6 | 23.1 [95% CI 20.1–26.1 | 73 |
| Time to DSS 7 | 33.1 [95% CI 29.2–37.0 | 82 |
| B: Patients with a progressive initial course of multiple sclerosis (n = 282) | ||||||||||||||||||||||
|---|---|---|---|---|---|---|---|---|---|---|---|---|---|---|---|---|---|---|---|---|---|---|
| Time (years) | 0 | 0.5 | 1 | 2 | 3 | 4 | 5 | 6 | 7 | 8 | 9 | 10 | 11 | 12 | 13 | 14 | 15 | 16 | 17 | 18 | 19 | 20 |
| Patients (%) free of | ||||||||||||||||||||||
| DSS 4 | 100 | 32 | 28 | 16 | 12 | 9 | 8 | 6 | 5 | 4 | 3 | 2 | 1 | 1 | 1 | 1 | 0 | 0 | 0 | 0 | 0 | 0 |
| DSS 6 | 100 | 98 | 96 | 91 | 82 | 73 | 63 | 57 | 51 | 43 | 37 | 32 | 30 | 27 | 26 | 26 | 25 | 23 | 22 | 21 | 19 | 17 |
| DSS 7 | 100 | 100 | 99 | 98 | 95 | 93 | 89 | 83 | 79 | 75 | 69 | 67 | 61 | 57 | 52 | 48 | 45 | 40 | 40 | 33 | 31 | 28 |
| Median time (years) | Patients (%) who did not reach the end pointa | |
|---|---|---|
| Time to DSS 4 | 0.0 | 4 |
| Time to DSS 6 | 7.1 [95% CI 6.3–7.9] | 40 |
| Time to DSS 7 | 13.4 [95% CI 11.0–15.9] | 64 |
DSS = Disability Status Scale.
Data on patients who did not reach the end point were censored at the time of the last clinic visit.
Data on patients who did not reach the end point were censored at the time of the last clinic visit.
Adapted from Confavreux et al (2000, 2003)
© 2006
Figure 4.15.
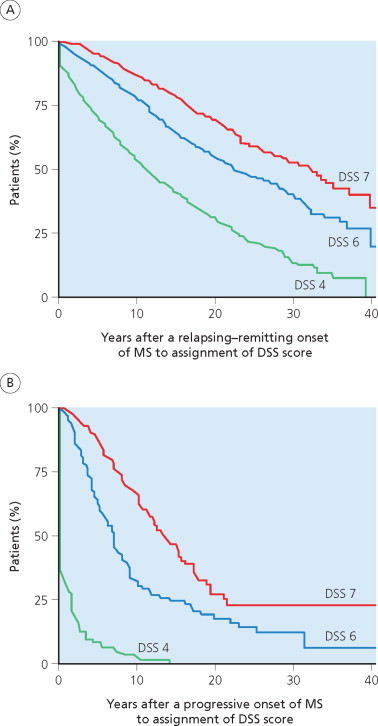
Kaplan–Meier estimates for the time (years) from onset of multiple sclerosis to the assignment of DSS 4, 6 and 7 among the 1844 patients in the Lyon, France, multiple sclerosis cohort. Influence of the initial course of the disease. (A) Estimates for the 1562 patients with a relapsing–remitting initial course. (B) Estimates for the 282 patients with a progressive initial course of multiple sclerosis.
Adapted from Confavreux et al (2000; 2003).
© 2006
Table 4.18.
Influence of the initial course of multiple sclerosis on prognosis. Life table analysis showing the probability (%) for patients with multiple sclerosis not to reach the end point according to disease duration (years), among 220 patients with multiple sclerosis.
| Disease duration (years) |
|||||
|---|---|---|---|---|---|
| 5 | 10 | 15 | 19 | p value | |
| DSS 6 | |||||
| Relapsing–remitting | 95 | 81 | 72 | 61 | <0.001 |
| Progressive | 66 | 22 | 10 | 10 | |
| DSS 7 | |||||
| Relapsing–remitting |
99 |
91 |
84 |
77 |
<0.001 |
| Progressive | 84 | 61 | 42 | 26 | |
Adapted from Myhr et al (2001)
© 2006
In the Israeli studies, involving 282 patients with multiple sclerosis, the symptoms, course and prognosis appeared remarkably similar in affected individuals from Western Europe and Israel, despite the fact that the latter came from three equally distributed ethnic groups – European, Afro-Asian and native Israeli-born (Leibowitz and Alter 1970; 1973; Leibowitz et al 1964a; 1964b). In a large study involving 2934 Australian patients with multiple sclerosis, S.R. Hammond et al (1988; 2000b) demonstrated that the course, prognosis and clinical predictive factors were remarkably similar to those observed in populations living in the northern hemisphere; and there were no distinctions between affected individuals from different parts of Australia. Contrasting with this homogeneous clinical pattern in the populations of European origin, whatever the geographical area under consideration, Asian populations affected with multiple sclerosis present several distinguishing features (see Chapters 2, 5 and 6; Kira 2003).
The potential prognostic influence of many other factors has been explored: socioeconomic status (Kurtzke et al 1970a; Phadke 1990) and the month, season or year of onset (Eriksson et al 2003; Kurtzke et al 1970a; Runmarker and Andersen 1993) but all with negative results. An increase in the subjective intensity of neurological symptoms with exposure to heat (see Chapter 13) has been studied in one series and reported, when present, to be associated with a worse outcome (V.A. Clark et al 1982). By classifying 1055 patients with multiple sclerosis according to a disease severity algorithm, Phadke (1990) concluded that those with a family history of multiple sclerosis had a more severe course of the disease. By contrast, comparing 143 familial multiple sclerosis patients with 956 sporadic multiple sclerosis patients, Weinshenker et al (1990) were unable to find any difference between familial and sporadic multiple sclerosis with respect to demographic and clinical features, including outcome. Similarly, in a long-term natural history study including 220 patients, a family history of multiple sclerosis did not influence the overall outcome of the disease (Myhr et al 2001).
Time to landmarks and clinical status
Few studies have dealt with the issue of the degree of recovery, perhaps due to methodological difficulties in assessment; but there is agreement that the degree of recovery from the initial neurological episode correlates with an improved prognosis (Amato and Ponziani 2000; Confavreux et al 2003); Eriksson et al 2003; Runmarker and Andersen 1993). Conversely, the criterion of time from onset of the disease to the second neurological episode has received much attention. The usual conclusion is that the shorter this interval, the worse the prognosis (Bonduelle and Albaranès 1962; Confavreux et al 1980; 2003; McAlpine 1961; Myhr et al 2001; Phadke 1987; 1990; Riser et al 1971; Weinshenker et al 1989a; 1989b; 1991a). However, this feature has not emerged as influential when survival estimates are dated from onset of the second episode, as in the Gothenburg, Sweden, study (Eriksson et al 2003; Runmarker and Andersen 1993); and in an Italian series an inverse relationship between time to the second neurological episode and subsequent disability landmarks has been observed (Amato and Ponziani 2000).
Fog and Linnemann (1970) and Patzold and Pocklington (1982) did not find a correlation between relapse frequency and disease progression. In these series, follow-up lasted only a few years, sample size included only 73 and 102 patients, respectively, and progression was indexed to the period of observation rather than to the entire course from onset of multiple sclerosis. In the United States Army Veterans series, Kurtzke et al (1977) were also unable to correlate number of relapses during the first 5 years with disability status at 10 or 15 years’ duration. However, assessments were very infrequent during the 20-year follow-up in this series and relapse ascertainment during the initial course not optimal. By contrast, the longitudinal studies from Lyon, France, and London, Ontario (Confavreux et al 1980; 2003; Weinshenker et al 1989a) and what is essentially a cross-sectional study from Turkey (Kantarci et al 1998) have consistently found an association between the number of relapses during the first 2–5 years and subsequent prognosis: the greater the number of early episodes, the shorter the interval to disability landmarks. However, the effect is quite weak, and was not seen at all in the Swedish study when time dependency of the variable was accounted for, and survival analysis estimates of time to DSS 6 calculated using 5 years after onset of multiple sclerosis as the starting point (Eriksson et al 2003; Runmarker and Andersen 1993). Others have also concluded that the number of relapses during the first 2–3 years does not influence the final outcome (Amato and Ponziani 2000; D.H. Miller et al 1992a).
John Kurtzke should be credited with first emphasizing the prognostic significance of clinical status at 5 years’ disease duration (Kurtzke et al 1977): higher DSS scores, the presence of pyramidal or cerebellar signs, and the number of affected functional systems best predict outcome. His study dealt with young soldiers, and the cohort contains almost no cases with a progressive onset. This and the other recruitment biases, already mentioned, may explain why age at onset and initial disease pattern were not shown to influence the clinical course. That said, whenever the possible predictive value of early accumulation of disability has been assessed in other series, much the same conclusion has been reached (V.A. Clark et al 1982; Detels et al 1982; D.H. Miller et al 1992a); Visscher et al 1984); Weinshenker et al 1989a; 1989b). Moreover, the Gothenburg, Sweden, study has demonstrated that the effect was still present when the time to end point (DSS 6 in this series) was estimated by survival analysis using 5 years from onset as the starting point (Eriksson et al 2003; Runmarker and Andersen 1993). Taken together, these observations corroborate, to some extent, the ‘individual slope’ concept derived from an earlier analysis (Fog and Linnemann 1970).
The literature on assessing the influence of early accumulation of disability on the long-term outcome is reasonably consistent, and supports the conclusion already reached concerning clinical status at 5 years. The time taken to reach higher landmarks of disability correlates with the interval between onset and assignment of DSS 3 (Weinshenker et al 1989a; 1989b; 1991a) or DSS 4 (Confavreux et al 2003). The same effect was apparent in the London, Ontario, series where the time to DSS 6 was estimated by survival analysis from the point at which DSS 3 had been reached. Conversely, in the Lyon, France, series, the influence of time from onset to DSS 4 was reproduced in the subsequent time to DSS 6 and DSS 7 (p < 0.001, for each) when onset of multiple sclerosis was used as starting point, but vanished when the period of scrutiny was taken forward to assignment of DSS 4 as baseline (Confavreux et al 2003).
Time to secondary progression has only been analysed in a single study, perhaps because secondary progression is an end point that occurs relatively late in the course of multiple sclerosis. Using a disease severity classification, we found that shorter times to secondary progression were associated with worse outcomes (Confavreux et al 1980). However, survival analyses have not yet been used to assess the prognostic significance of this descriptor.
Multivariate analysis
The list of clinical, imaging and laboratory variables that may bear some predictive value on the time course of disability accumulation in multiple sclerosis is long. Some have a stronger influence than others. None appears to make more than a trivial contribution to the prognosis, and univariate analysis is therefore of little value. To improve the accuracy of these predictions, a logical approach is to combine information provided by the separate factors. But, as it turns out, these combinations of predictors are soon shown to exhibit neither synergistic nor additive effects. Many are interdependent but not additive in their prognostic effect and therefore share predictive influence thus risking the introduction of partially confounding effects. However disappointing hierarchical multivariate analyses may have proved in delivering customized predictions in the clinical setting, some interesting observations have emerged. Those researchers using crude observational data (V.A. Clark et al 1982; Detels et al 1982; Leibowitz and Alter 1970; 1973; Leibowitz et al 1964a; 1964b; D.H. Miller et al 1992a); R. Müller 1949; 1951; Panelius 1969; Phadke 1987; 1990; S. Poser 1978; S. Poser et al 1982b); Visscher et al 1984) and modern statistical techniques (Amato and Ponziani 2000; Confavreux et al 1980; 2003; Eriksson et al 2003; Kantarci et al 1998; Myhr et al 2001; Riise et al 1992; Runmarker and Andersen 1993; Weinshenker et al 1989b; 1991a) have reached consistent conclusions. The most influential cluster gathers sex, age at onset, initial symptoms and initial course. We rationalize the only exception (Kurtzke et al 1977)) on the basis of recruitment bias, as already discussed. Older age at onset, early symptoms referable to long tracts, an initial progressive course and male gender are associated with a worse outcome. Conversely, the combination of younger age at onset, optic neuritis as the initial symptom, an early exacerbating–remitting course and female sex are significantly associated with a better prognosis. How the illness starts is the factor most influencing the prognosis. Age at onset comes next in the rankings. Initial symptoms and gender have a marginal or possibly no effect once initial course and age at onset have been considered. A second cluster emerges, gathering features that define clinical status after a reasonable period − 5 years in most studies (V.A. Clark et al 1982; Detels et al 1982; Eriksson et al 2003; Kurtzke et al 1977); D.H. Miller et al 1992a); Runmarker and Andersen 1993; Visscher et al 1984); Weinshenker et al 1989a; 1989b). A higher disability score, more affected functional systems, and the presence of pyramidal or cerebellar symptoms all contribute to a worse prognosis. But again to emphasize the point, although highly significant at the statistical level, the prognostic effect of these variables is modest at best, even when combined. Thus, although of undeniable interest in thinking about the generality of patients with multiple sclerosis, application to the individual is of limited value.
Adding currently available laboratory data to the algorithm does not make these predictions any more precise. The expectation that information obtained from MRI examinations of the brain and spinal cord at baseline, and during the early years of the illness, may improve long-term predictions remains to be proven for representative cohorts of patients with multiple sclerosis followed longitudinally over a prolonged period. Simply stated, the clinician remains in the uncomfortable position of being unable to predict prognosis in the individual. More sophisticated models developed to solve this type of problem (see above) have also proven disappointing. They confirm such predictive value as exists for univariate and multivariate analyses; and they provide predictions tailored to the individual by accounting for demographic and disease-related characteristics; but, unfortunately, as illustrated by the London, Ontario, series (Weinshenker et al 1991a), the lack of precision renders these models of limited practical value. That said, as expected, the predictive factors for disability accumulation in multiple sclerosis are essentially the same as those that predict secondary progression. Two phenomena seem to be operating – a weak interplay between relapses and prognosis, and a strong connection between age and prognosis (see below).
Benign multiple sclerosis
The previous sections introduced a few distinct features of multiple sclerosis. For instance, with onset at age >50 years, multiple sclerosis is usually characterized by motor and sphincter disturbances, a primary progressive course with few or no superimposed relapses, a lower F:M sex ratio, and more rapid accumulation of disability than in younger patients (Noseworthy et al 1983). Here, we focus on one form of multiple sclerosis that evokes strong interest for the affected person, who (understandably) craves reassurance that their condition will follow a benign course. Whilst we can offer group definitions based on the progression index or MSSS (see Chapter 6), the real need is for a catalogue of prognostic features, applicable to the individual, that sustains optimism throughout the duration of the disease.
The existence of benign multiple sclerosis is not disputed: indeed, the reality of the concept is reinforced by the well-known finding of incidental multiple sclerosis at autopsy (Engell 1989; Georgi 1961; Gilbert and Sadler 1983; R.P. McKay and Hirano 1967), and on imaging examinations (McDonnell et al 2003). There is also a strong consensus about the archetypal clinical phenotype of benign multiple sclerosis: this is characterized by young females with predominant sensory symptoms and an initial exacerbating–remitting course (Bonduelle 1967; Lehoczky and Halasy-Lehoczky 1963; McAlpine 1961; 1964; R.P. McKay and Hirano 1967; M. Rodriguez et al 1994b; D.S. Thompson et al 1986). However, working criteria for the definition of benign multiple sclerosis are still debated. According to the results of an international survey undertaken by the National multiple sclerosis Society of the United States (Lublin and Reingold 1996), the consensus definition is ‘disease in which the patient remains fully functional in all neurological systems 15 years after disease onset’. The boundaries of ‘fully functional’ are somewhat vague. Furthermore, slightly different definitions are applied, depending on the authors. It is therefore difficult to compare the results from one study with another, and even more problematic to provide a reasonable estimate for the actual frequency of benign multiple sclerosis.
As the architect of many clinicopathological descriptions of multiple sclerosis, Charcot (1872) was the first to suggest that the disease might become completely quiescent or individuals even recover:
Enfin, il n’ est pas rare de voir des intermissions complètes qui ont pu faire espérer une guérison définitive [in fact, it is not so unusual to see complete remissions that may even indicate full healing from the illness].
Six decades later, Brain (1936) endorsed the same opinion:
If a remission may last thirty years, why not for a lifetime? The overwhelming number of patients in whom the disease is progressive should not blind us to the probability that the continuous series from the most acute to the most benign forms extends further to include those in whom a first attack is never followed by another.
But it was the seminal work of McAlpine (1961; 1964) that popularized the concept of benign multiple sclerosis. By studying an essentially hospital-based population of 241 patients seen ≤3 years of onset and followed up until ≥15 years of the disease, Douglas McAlpine and his younger colleague were able to demonstrate that 62 patients (26%) were still ‘without restriction of activity for normal employment and domestic purpose but not necessarily symptom free’ (McAlpine and Compston 1952), after a mean disease duration of 18.2 years. All these patients were able to walk for >500 metres without rest or support from a stick. This would equate with a score of DSS ≤4. The figure of 26% is strikingly consistent with results obtained using survival analysis techniques in long-term follow-up studies of large natural history cohorts. For instance, in the Lyon, France, sample of 1844 patients including those with an initial progressive course, 35% and 26% of the patients had not reached the DSS 4 landmark after 15 years and 20 years of disease duration, respectively (see Figure 4.11). The proportion was 13% at 30 years’ disease duration. Considering the subgroup of 1562 patients with an initial exacerbating–remitting course, 42% and 31% still had disability scores <DSS 4 after 15 years and 20 years duration, respectively (Figure 4.15). Furthermore, late reassessment of the Gothenburg, Sweden, cohort after a 37–50-year follow-up by Kaplan–Meier analysis allowed the proportion of benign cases to be estimated at 26% and 21% after 30 and 40 years, respectively (Skoog et al 2004). To be classified as benign in this study, patients had not yet entered the secondary progressive phase, and must have retained an EDSS score of ≤4 at the last assessment.
The difficulty arising from the fact that patients with benign multiple sclerosis often escape neurological notice, is well demonstrated by a German study (S. Poser et al 1982a). The authors analysed any person suspected of having multiple sclerosis, and living in the geographical area of southern Lower Saxony. There were 221 patients. This group was compared with 1837 cases collected throughout Germany, mainly in hospitals taking part in a national epidemiological programme devoted to multiple sclerosis. There were many individuals in the geographically based series who had never attended a hospital or outpatient department. Although mean disease duration was longer in the Saxony (12.1 years) than the hospital cohort (10.5 years), the percentage of patients unrestricted or minimally affected at the time of the survey was 52% and 26%, respectively. These findings emphasize the high frequency of a benign course in multiple sclerosis likely to escape evaluation in any hospital-based series. Another point deserves comment: it is always difficult, if not risky, to believe that an individual classified as having benign multiple sclerosis will always remain in that category. Indeed, the survival curves show a steady decrease in the proportion of individuals still free from that disability end point, however defined, as the disease advances. This is also illustrated by comparative serial analyses for a given population of patients with multiple sclerosis over time (Hawkins and McDonnell 1999; McAlpine 1964; Pittock et al 2004a; 2004b; 2004c). Collectively, these analyses are valuable for discussions with patients and their relatives about the prognosis of the disease, notably at the time of diagnosis. We consider that around 30% of incident patients will prove to have a benign form of multiple sclerosis.
SURVIVAL IN MULTIPLE SCLEROSIS
Lay persons are usually aware that multiple sclerosis is a chronic disabling disease but uncertain whether it is fatal. Not surprisingly, at the time of diagnosis, considerations about life expectancy loom large in the mind of each patient. Recent additions to knowledge concerning when and how the person with multiple sclerosis may die, and factors predicting survival, provide the clinician with an evidence base from which answers both for the patient and their relatives can be derived. Professional perceptions of survival in multiple sclerosis have changed since the 1950s. Earlier surveys had suggested that mean survival from onset was no more than 17 years (Brain 1936; Bramwell 1917; Carter et al 1950; Ipsen 1950; Lazarte 1950). Now, this figure is considered to be an underestimate, explained by the series being hospital based and reflecting life expectancy in the pre-antibiotic era.
Lessons from the long-term follow-up natural history cohorts
The issue of survival in multiple sclerosis has been addressed in most long-term follow-up studies of natural history cohorts using both cross-sectional (Table 4.19 ; Kantarci et al 1998; Leibowitz et al 1969; D.H. Miller et al 1992a); R. Müller 1949; 1951; Myhr et al 2001; Phadke 1987; S. Poser et al 1986; Visscher et al 1984) and longitudinal assessments (Broman et al 1981; Confavreux 1977; Confavreux et al 1980; Eriksson et al 2003; Kurtzke et al 1969; 1970a; Runmarker and Andersen 1993; Wallin et al 2000; Weinshenker et al 1989a; 1989b). At their inception, the major objective of these series was to describe the natural history of multiple sclerosis from onset. Therefore, patients were enrolled mainly in the first years of the illness. The duration of follow-up still being limited, the number of deaths relative to the total enrolled population observed in these series was small. For instance, the number of patients dead at closure out of the total number enrolled in the French series was 20/349 (Confavreux et al 1980), 16/1099 in the London, Ontario, study (Weinshenker et al 1989a), 49/308 in the Gothenburg, Sweden, study (Runmarker and Andersen 1993), and 11/220 in the Norway study (Myhr et al 2001). The only exception is the United States Army Veterans series, with 127 deceased patients out of 527 young male soldiers (with a median age of 25 years at onset) at closure of the study (Kurtzke et al 1970a). Table 4.19 shows that the analyses, whether based upon crude observational data (R. Müller 1949; 1951; Phadke 1987) or survival analyses (Confavreux et al 1980; Kurtzke et al 1970a; D.H. Miller et al 1992a)), are consistent in showing a median time, from onset of multiple sclerosis to death, of around 30 years. The outlier is Israel where mean time to death, calculated from 52 deceased patients, was 17.4 years (Leibowitz et al 1969). The remaining studies provide an estimate for the 90th percentile time to death of 20 (range 15–40) years (Kantarci et al 1998; Myhr et al 2001; Runmarker and Andersen 1993; Weinshenker et al 1989a).
Table 4.19.
Death in multiple sclerosis.
| Study | Population size | Time from onset of multiple sclerosis to death (years) | Factors predictive of time from onset of multiple sclerosis to death |
|---|---|---|---|
| Long-term natural history series with cross-sectional and/or some longitudinal assessment | |||
| R. Müller 1949; 1951 | 810 |
|
|
| Leibowitz et al 1969 | 282 |
|
|
| Visscher et al 1984 | 941 | Not available |
|
| S. Poser et al 1986 | 1926 |
|
|
| Phadke 1987 | 1055 |
|
|
| D.H. Miller et al 1992a | 107 |
|
Not available |
| Kantarci et al 1998 | 1259 |
|
Not available |
| Myhr et al 2001 | 220 |
|
Not available |
| Long-term natural history cohorts with longitudinal follow-up | |||
| United States Army Veterans World War II multiple sclerosis cohort | |||
| Kurtzke et al 1970 | 527 |
|
|
| Lyon, France, multiple sclerosis cohort | |||
| Confavreux 1977 | |||
| Confavreux et al 1980 | 349 |
|
|
| Gothenburg, Sweden, multiple sclerosis cohort | |||
|
308 |
|
|
| London, Ontario, multiple sclerosis cohort | |||
| Weinshenker et al 1989a; 1989b | 1099 |
|
Not available |
| D.A. Cottrell et al 1999a | 928 |
|
Not available |
| Series of survival in multiple sclerosis | |||
| Riise et al 1988 | 598 |
|
|
| Wynn et al 1990 | 152 |
|
|
| Midgard et al 1995 | 251 |
|
|
| Wallin et al 2000 | 2489 |
|
|
| Sumelahti et al 2002 | 1614 |
|
|
| Brønnum-Hansen et al 2004 | 9881 |
|
|
SD = standard deviation.
SEM = standard error of the mean.
Data from the main series of the long-term course and prognosis, and from the main series of survival in multiple sclerosis
Several of these studies dealing with the issue of clinical factors observed at onset and predictive of death provide consistent results (Table 4.19; Leibowitz et al 1969; R. Müller 1949; 1951; Phadke 1987; S. Poser et al 1986; Runmarker and Andersen 1993; Visscher et al 1984). Gender usually appears noncontributory, although a trend for shorter time to death has emerged for males in some series. With the notable exception of the United States Army Veterans series (Kurtzke et al 1970a), for the reasons already mentioned, all the studies conclude that age at onset of multiple sclerosis is a strong predictor of reduced survival: the older the age at onset, the shorter the time to death. Motor, cerebellar or multiple symptoms at onset are usually associated with a worse prognosis, whereas this is the reverse for optic neuritis or oculomotor manifestations. A progressive initial course has also regularly been associated with a shorter time to death.
Details on the causes of death are to be regarded with some caution because the majority of patients with multiple sclerosis die at home or in institutions for the chronically sick, and not in hospital. Autopsies are seldom performed; this was an issue even for McAlpine and Compston (1952) working at a time when the culture for post-mortem examination was less constrained. Death certificates often prove misleading. For example, death was coded as due to multiple sclerosis in only 53% of 438 instances recorded in 2329 patients with multiple sclerosis from a Californian study (Malmgren et al 1983). In a recent study comprising 9881 patients with multiple sclerosis listed in the Danish multiple sclerosis Registry, only 82% of death certificates mentioned multiple sclerosis as an underlying or contributing cause of death (Brønnum-Hansen et al 2004). The same misclassifications presumably exist for other causes of death. That said, R. Müller (1949; 1951) concluded that 90% of cases died as a result of multiple sclerosis, of whom 5/190 had committed suicide. Amongst the remaining 10%, dying from causes unrelated to multiple sclerosis, three individuals had cancer and two suffered from fatal ischaemic heart disease. Of the 121 deaths amongst 476 patients with definite multiple sclerosis in the United States Army Veterans series (Kurtzke et al 1970a), 93 (77%) were attributable to multiple sclerosis, 24 (20%) to unrelated conditions, and 4 (3%) of unknown cause. Of the 24 deaths unrelated to multiple sclerosis in this population of young soldiers, trauma, coronary heart disease, cancer and suicide were considered to be the cause of death in 8, 3, 2 and 1, respectively. In his study of 1055 patients, Phadke (1987) registered 216 deaths, 132 of which (61%) were related to multiple sclerosis. Amongst the remaining 84 (39%), cancer and cardiovascular diseases accounted for the vast majority − 25 (12%) and 41 (19%), respectively. No conspicuous over-representation of any one disease, including suicide, has been noted in these deaths unrelated to multiple sclerosis. D.H. Miller et al (1992a), in their longitudinal study of 107 individuals with multiple sclerosis, registered 36 deaths. In two-thirds of these cases, death was considered to be related to multiple sclerosis. The two most common remaining causes were cancer and ischaemic heart disease. Nine hundred and twenty-eight patients from the London, Ontario, series could be traced up to 1996 when the survey was closed (D.A. Cottrell et al 1999a). By that date, 286/928 (31%) had died, 179 (63%) of multiple sclerosis and the remaining 107 (37%) from other causes, notably cardiac disease (12%), cancer (10%), cerebrovascular events (5%) and suicide (2%). The distribution of causes was remarkably similar whether the onset of multiple sclerosis had been relapsing–remitting or progressive.
Lessons from the survival series
Several series have been set up specifically to address the issue of survival in multiple sclerosis (Table 4.20 ). In fact, with the notable exceptions of the United States Army Veterans study (Wallin et al 2000) and the Danish study (Brønnum-Hansen et al 2004), most have followed a rather similar epidemiological approach to that of the long-term follow-up studies on natural history cohorts (see above; Midgard et al 1995; Riise et al 1988; Sadovnick et al 1991b; 1992; Sumelahti et al 2002; Wynn et al 1990). Therefore, the number of patients dead at closure of the survey was only 136/598 and 70/251 in the Norwegian surveys (Midgard et al 1995; Riise et al 1988), 219/1614 in Finland (Sumelahti et al 2002), 43/152 in the Olmsted County, United States, series (Wynn et al 1990), and 145/3126 and 115/2348 (Sadovnick et al 1991b; 1992) in the Canadian sample. Median time to death was given as 27 years by Riise et al (1988) but this is probably an underestimate because diagnosis of multiple sclerosis was used rather than onset as the baseline for subsequent calculations. In Finland (Sumelahti et al 2002) survival was estimated at 40 years from initial symptoms of multiple sclerosis. The other studies estimated the 75th percentile of time from diagnosis of multiple sclerosis to death, at around 20 years (Wynn et al 1990; Midgard et al 1995).
Table 4.20.
Main survival series in multiple sclerosis: epidemiological and disease-related characteristics
| Study | Location | Ascertainment | Follow-up | Population size | Gender: males/females (%) | Age at onset of multiple sclerosis (years) | Initial symptoms of multiple sclerosis (%) | Initial course: relapsing– remitting/progressive (%) | Time from onset of multiple sclerosis to diagnosis (years) | Duration of multiple sclerosis (years) | Overall course of multiple sclerosis at time of study (%) | Diagnosis classificationa |
|---|---|---|---|---|---|---|---|---|---|---|---|---|
| Riise et al 1988 | Hordaland and Vestfold counties, Norway | Geographically based | Cross-sectional Some longitudinal | 598 | 41/59 | 32.7 (mean) |
|
79/21 | Not available | Not available | Not available | Definite Probable Possible |
| Wynn et al 1990 | Olmsted County, USA | Geographically based | Cross-sectional Some longitudinal | 152 | 24/76 | 33 (median at diagnosis of multiple sclerosis) | Not available | Not available | Not available | 14 (median) (from diagnosis of multiple sclerosis) | Not available | Definite Probable Possible |
| Midgard et al 1995 | Möre and Romsdal County, Norway | Geographically based | Cross-sectional Some longitudinal | 251 | 44/56 | 33.6 (mean) |
|
85/15 | 5.7 (mean) | 18.1 (mean) | Not available | Definite Probable Possible |
| Sumelahti et al 2002 | Southern and Western districts, Finland | Hospital based | Cross-sectional Some longitudinal | 1614 | 34/66 | 31.5 |
|
76/24 | 4.2 (mean) | Not available | Not available | Definite |
| Brønnum-Hansen et al 2004 | Denmark | Country based | Longitudinal | 9881 | 40/60 | Not available | Not available | Not available | Not available (mean) | 21 | Not available Probable | Definite Possible |
Whenever necessary, the original criteria used by the authors have been interpreted in order to comply withC.M. Poser et al (1983)diagnostic criteria. ‘Possible’ is equivalent to ‘suspected’ in this classification.
Wynn et al (1990) associated male gender with a significantly shorter time to death whereas this only emerged as a trend, at best, in the Scandinavian studies (Midgard et al 1995; Riise et al 1988; Sumehlati et al 2002). The results of these three studies indicate that younger age at onset of multiple sclerosis, presentation with optic neuritis or paraesthesiae, and an exacerbating– remitting initial disease course are all associated with a significantly longer time from onset to death. From the multivariate Cox regression analyses, Riise et al (1988) observed that age at onset of multiple sclerosis is the variable most strongly predicting survival; after correction, the apparent effect of initial course on survival is markedly reduced. But, using a similar technique, Midgard et al (1995) concluded that age at onset of multiple sclerosis and initial course of the disease do exert independent effects on survival. The Olmsted County, United States, study (Wynn et al 1990) was unable to demonstrate a change in the time to death according to year of diagnosis over the period from 1905 to 1985.
Cause of death has been analysed in several survival studies. Sadovnick et al (1991b) attributed death directly to multiple sclerosis in 56 (47%) of the 119/145 (82%) deceased patients in whom information was available. Of the remaining 63 deaths, 29% were suicides, 30% had cancers, 21% suffered acute myocardial infarctions, 11% had strokes and 9% died from miscellaneous causes. Among the population with multiple sclerosis, the proportion of deaths due to suicide was 7.5 times higher and that due to malignancy 0.7 times the rate seen in the age-matched general population. The proportion of deaths due to acute myocardial infarction or stroke was similar in both populations. At conclusion of the follow-up period, 70 Norwegian patients with multiple sclerosis had died (Midgard et al 1995): in 54 (77%) instances, death was related to multiple sclerosis, directly or as a contributing factor in 42 and 12 individuals, respectively. In the Finnish study, multiple sclerosis-related causes accounted for 70% of the 219 recorded deaths (Sumelahti et al 2002). By comparison with the general population, the proportion of deaths resulting from violence or cancer was higher in the context of multiple sclerosis whereas mortality due to cardiovascular diseases was less frequent.
The United States Army Veterans Study (Wallin et al 2000) deserves special consideration for its size, duration of follow-up, and high proportion of patients reaching the end point under scrutiny. It comprises 2489 veterans of the Second World War and the Korean conflict ascertained in 1956 as ‘service connected’ for multiple sclerosis. They were ascertained for vital status to June 1996 using the Beneficiary Identification and Records Locator Subsystem. At the time of the survey, 2059 (83%) veterans had died. Each patient with multiple sclerosis was matched to a military control referred to year of birth, date of entry into military service, branch of series, and survival throughout the war. Several demographic and disease-related data were systematically recorded: year of birth, sex, race, latitude of residence in the United States (arranged in tiers: north, middle and south) on entry to active duty, socioeconomic status, and age at onset of multiple sclerosis. Nonetheless, there were weaknesses in the study. The population under scrutiny essentially comprises males (96%) and whites (97%), bringing into question the reliability of analyses addressing the possible influence of sex and race on survival, because there is no evidence that women and blacks share the same demographic and socioeconomic profile as white males at entry into military service. Furthermore, for obvious reasons, age at onset of multiple sclerosis (median at around 25 years) was younger than for a general population of patients with multiple sclerosis. Comments on the possible influence of age at onset must therefore be treated with caution, and the estimates of time to death are presumably correspondingly exaggerated. That said, the Veterans study does provide robust estimates for life expectancy in this population of young soldiers. Life table analysis for white males (93% of the total cohort) provides a median time from onset of multiple sclerosis to death of 34 years. From univariate and multivariate analyses, age at onset of multiple sclerosis, sex and socioeconomic status each have independent and significant influences on survival. Younger age at onset, female sex and lower socioeconomic status are associated with enhanced survival. Neither race nor latitude of residence at entry in the army have a significant effect on survival, although they are known to correlate with the frequency (i.e. susceptibility) of multiple sclerosis. Furthermore, this study shows that soldiers with multiple sclerosis generally have reduced survival by comparison with their fellow veterans. White male case survival could be estimated at about 2/3 and 1/3 of that for white male veteran controls by 20 years and 40 years after joining the army, respectively. Using the slightly different comparator of standardized mortality ratios, the study also showed reduced survival in army veterans with multiple sclerosis in comparison with the general United States population.
The national Danish study
The national Danish study makes an especially important contribution to the study of survival in multiple sclerosis (Brønnum-Hansen et al 1994; 2004; Koch-Henriksen et al 1998; Stenager et al 1992). At the most recent update, 9881 patients with multiple sclerosis were registered, amongst whom 4254 (43%) had died during follow-up (Brønnum-Hansen 2004). The cohort takes advantage of the Danish multiple sclerosis Registry established on the back of a prevalence survey completed in 1956, and includes information about patients in Denmark with onset of multiple sclerosis from 1949. Virtually all Danish inhabitants with multiple sclerosis are registered on the database, and information is systematically validated and updated. The study is also linked to the Danish Civil Registration System established in 1968, and the Cause of Death Registry comprising data on all deaths since 1943. These two official registers gather data on emigration, death and cause of death for the patients with multiple sclerosis, and for the general Danish population. The recent reassessment included patients whose initial symptoms began in the period 1949–1996, and were logged before 1st January 1997.
Follow-up was scheduled to end in 1999. At that time, the mean duration of observation was 21 years. Of the 9881 registered patients, 40% were males. Mean age at onset of multiple sclerosis was 34.7 years. Median survival time from onset of multiple sclerosis to death was estimated at 31 years (Figure 4.16 ). The survival curves indicate a median time from onset of multiple sclerosis to death that is about 10 years shorter for patients with multiple sclerosis than for the age-matched general population. The standardized mortality ratio, which is the quotient of the observed death number (in the population with multiple sclerosis) by the expected death number (in the general population) for the period 1949–1999 was 2.89 (95% CI 2.82–2.98). The excess death rate, which is the observed death number less the expected death number per 1000 person-years, was 13.4 (95% CI 12.8–14.0) for the total period of 0–50 years after onset of multiple sclerosis. This rose steadily from 1.8 for the period of 0–1 year, to 24.6 for the interval of 20–50 years after onset of the disease.
Figure 4.16.

Actuarial probability of survival amongst 9881 patients with multiple sclerosis, of whom 4254 had died before the end of follow-up on 1st January 2000, and the matched general population in Denmark.
Adapted from Brønnum-Hansen et al (2004).
© 2006
Life expectancy was significantly greater in females than males according to the results of the survival analysis (Figure 4.17 ), the standardized mortality ratios, and the excess death rates. Survival improved significantly during the 50-year period of observation, the median 10-year shorter life expectancy being almost halved during that period (Figure 4.18 ). This change was independent of the general decline in mortality enjoyed by Danes since the 1950s and presumably related to improved medical management in the modern era. According to available certificates, 56% of deaths were related to multiple sclerosis. Those unrelated were mainly attributable to cardiovascular diseases (15%), cancer (10%), infectious and respiratory diseases (5%) and accidents and suicide (5%). Compared with the general population, there was excess mortality due to cardiovascular disease, infections, respiratory causes, accidents and suicide, but a lower risk of death from cancer.
Figure 4.17.

Influence of gender on actuarial probability of survival amongst 9881 patients with multiple sclerosis, of whom 4254 had died before the end of follow-up on 1st January 2000, and the matched general population in Denmark.
Adapted from Brønnum-Hansen et al (2004).
© 2006
Figure 4.18.

Influence of calendar period of onset for multiple sclerosis on actuarial probability of survival amongst 9881 patients with multiple sclerosis, of whom 4254 had died before the end of follow-up on 1st January 2000, and the matched general population in Denmark.
Adapted from Brønnum-Hansen et al (2004).
© 2006
In summary, a reasonable estimate of the median time from disease onset to death in people with multiple sclerosis is 31 years. This represents a 5–10 year reduction in life expectancy compared with the general population. It seems likely that the modest difference is progressively being eroded with advances in medical management. Female sex, younger age at disease onset, an initial exacerbating–remitting clinical course, and optic neuritis, diplopia or paraesthesiae as initial symptoms are all associated with improved survival. Death is attributable to multiple sclerosis in about two-thirds of patients. It is rare for death to result from involvement of vital centres in the central nervous system. Rather, the reduced life expectancy can be attributed to the bedridden state and its complications in chronically disabled patients. In individuals dying from causes unrelated to multiple sclerosis, the excess is due to suicide compensated by reduced mortality from cancer. Therefore, multiple sclerosis is chronic and disabling but not a fatal disease.
DISEASE MECHANISMS UNDERLYING THE CLINICAL COURSE
For the clinician, the conundrum presented by the clinical course of multiple sclerosis starts with the awareness of at least three different types of clinical evolution, and variable rates of accumulation of disability between patients. Do these patterns indicate the existence of altogether different disorders or are they merely a function of complexity (see also Chapter 14)? Understanding how these patterns come about is fundamental to a sophisticated understanding of multiple sclerosis; and, although this might be considered more the terrain of the expert in physiology or neurobiology, there is much to be learned on this topic from detailed scrutiny of the natural history. Our discussion of mechanisms underlying the disease course in multiple sclerosis necessarily first rehearses, in summary, the experimental evidence.
Inflammation and degeneration
The course of multiple sclerosis may be considered as the expression of two clinical phenomena, relapses and progression, the latter being defined as steady worsening of symptoms and signs over ≥6 months. In turn, this analysis brings into the equation the interplay between two biological activities: inflammation (focal, disseminated, acute or recurrent) and degeneration (diffuse, early, chronic and progressive) (Figure 4.19 ; for other versions of the same cartoon, see Figures 14.2 and 18.1). There is strong evidence that relapses are mainly the expression of acute focal inflammation occurring within the central nervous system. For each clinical episode, there is an average of ten new MRI lesions (Figure 4.20 ; see Chapters 7 and 13). One could say that ‘multiple sclerosis never sleeps’. This is also one explanation for the strikingly loose correlations with which authorities working in the 19th century struggled in seeking to match clinical abnormalities to the anatomical lesions observed in their pathological specimens. This so-called dissociation anatomo-clinique (clinico-pathological dissociation) was, for these pioneers, a hallmark of sclérose en plaques (multiple sclerosis). Relapses are therefore a direct but also a ‘filtered’ clinical expression of inflammation. This ‘filtering phenomenon’ may have different origins relating to the complex relationship between injury and repair, plasticity, and the presence of structural abnormality with and without functional perturbations in conduction of the nerve impulse (see Chapters 10 and 13; M. Lee et al 2000; Pantano et al 2002; H. Reddy et al 2000; 2002; Rocca et al 2002a; Staffen et al 2002). There is also increasing evidence that multiple sclerosis is a neurodegenerative disease, the diffuse and chronic axonal loss correlating with progression and accumulation of disability (see Chapters 1, 10, 12 and 13).
Figure 4.19.

Schematic representation of the interplay between relapses and progression, and focal inflammation and diffuse degeneration in multiple sclerosis. NAWM = normal-appearing white matter.
Figure 4.20.

Consecutive gadolinium enhanced brain MRI scans from a patient with relapsing–remitting multiple sclerosis. The MRI activity is high despite clinical quiescence during the study period.
One of the central issues with respect to outcome in multiple sclerosis is the mechanism whereby irreversible disability accrues (Figure 4.21 ; Confavreux 2002b; Confavreux and Vukusic 2002; Confavreux et al 2000). From the clinical perspective, this could simply result from relapses with sequelae. Under these circumstances, the pattern of accumulation would be stepwise. Alternatively there may be a contribution from superimposed progression. Therefore, it becomes important to reconcile the relative contributions of relapses and progression, and of focal inflammation and diffuse degeneration, in the accumulation of disability. One analysis is that inflammation is directly and exclusively responsible for the initiation of degeneration. This does not necessarily mean that inflammation is also entirely responsible for the perpetuation of degeneration and progression once these have gathered their own momentum (see Chapter 10). But, according to this analysis, relapse and the underlying inflammatory component is the major cause of irreversible disability in multiple sclerosis.
Figure 4.21.

Schematic representation of the possible interplay between relapses and progression, and focal inflammation and diffuse degeneration in multiple sclerosis. 1: Relapses and focal inflammation are the major cause of irreversible disability; neurodegeneration follows the phase of active inflammation. 2: Relapses and focal inflammation are not the major cause of irreversible disability; these have independent mechanisms and proceed at different rates. 3: The initial process is neurodegenerative, and damaged tissue stimulates a secondary inflammatory reaction. 4: The initial process is autoimmune with secondary autonomous self-perpetuating neurodegeneration.
At first glance this assertion is attractive. Among the 1562 patients of the Lyon Natural History Cohort with a relapsing– remitting onset of multiple sclerosis, 274 (18%) did suffer from an initial relapse with irreversible incomplete recovery as defined by a score of DSS ≥3. Among the 1288 patients making a complete recovery, as defined by a score of DSS ≤2, after the initial relapse, 391 (30%) later experienced incomplete recovery from a subsequent episode (Confavreux et al 2003). A detailed analysis of pooled data from 224 patients with relapsing–remitting multiple sclerosis enrolled in the placebo arms of several randomized clinical trials allows comparisons between EDSS assessments before, at the time of, and after a relapse (Lublin et al 2003). The baseline EDSS assessment is defined as the closest measurement preceding the relapse in question. Comparing post-relapse and baseline evaluations, the net increase in the EDSS score was 0.27 (±1.04). This corresponds to 42% of the patients with ≥0.5, and 28% with ≥1.0 increase in EDSS scores. However, the median time between evaluations performed during and after the relapse was only 63 (range 32–140) days.
Similarly, assessment of possible effects from the degree of recovery after the initial episode, time to the next event, and number of attacks during the first years of the disease on the disability accrual process provide consistent results in natural history cohorts. An incomplete recovery from the initial relapse, a short interval between the first two episodes, a high number of relapses overall, or a brisk relapse rate during the first years of the illness are associated with rapid accumulation of irreversible disability (Confavreux et al 1980; 2003; Weinshenker et al 1989b; 1991a).
However, the real contribution of relapses to disability accumulation is more complex. Evidence from the primary progressive form of multiple sclerosis indicates that progression of irreversible disability may occur without superimposed relapses (Lublin and Reingold 1996), or inflammation defined using standard pathological and MRI criteria. The rate of disability in these cases with progression from onset is similar to that seen in relapsing progressive forms of multiple sclerosis (Confavreux et al 2000); D.A. Cottrell et al 1999a; Kremenchutzky et al 1999).
Informative observations have been made on pooled data from 313 patients with relapsing–remitting multiple sclerosis enrolled in the placebo arms of two large phase III trials of interferon-β1a (PRISMS Study Group 1998) and glatiramer acetate (K.P. Johnson et al 1995), assessed at 3-month intervals with a 2-year follow-up (Figure 4.22 : C. Liu and Blumhardt 2000). Analyses were performed on the 289 patients with complete EDSS assessments. A significant change was defined as a change of ≥1.0 EDSS points if baseline EDSS was between 0 and 5.0, or ≥0.5 EDSS point change if baseline EDSS was ≥5.5. Patients were distributed into six categories according to the observed course of EDSS scores throughout the 2 years of follow-up:
-
•
20% exhibited no significant change
-
•
37% had a fluctuating course with a significant EDSS change but not confirmed at 3 months
-
•
14% showed an erroneous progression as defined by a significant EDSS increase confirmed at 3 months but not sustained until the end of the observation period
-
•
15% had a sustained progression with a significant EDSS increase confirmed at 3 months and sustained until the end of the trial
-
•
8% showed an erroneous improvement with a significant EDSS decrease confirmed at 3 months but not sustained until the end of the trial
-
•
6% showed a sustained improvement with a significant EDSS decrease confirmed at 3 months and sustained until the end of the trial.
Figure 4.22.

Total series of individual plots for EDSS changes from baseline versus days in study, for 289 patients with relapsing– remitting multiple sclerosis enrolled in placebo arms of two phase III trials of interferon-β1a and glatiramer acetate. A significant change is defined as ≥1.0 point EDSS change if baseline EDSS was 0–5.0, or a ≥0.5 point EDSS change if baseline EDSS was >5.5. Patients are distributed into six categories according to the observed course of their EDSS scores throughout the two years of follow-up (see text for precise definitions): minimal changes (20% of the patients); fluctuating course (37%); erroneous progression (14%); sustained progression (15%); erroneous improvement (8%) and sustained improvement (6%).
Adapted from C. Liu and Blumhardt (2000). Reproduced with permission from the BMJ Publishing Group.
© 2006
In these series, 29% of the patients could therefore be classified as showing progression in the trial with confirmation at 3 months but, among those who progressed, the EDSS increase was still present at conclusion of the follow-up period in about half the participants. The probability of misclassification at the end of the trial regarding the progression status was 0.52. Applying the more stringent definitions of ≥2.0 EDSS increase and/or a confirmation at 6 months led to essentially the same estimation for the probability of misclassification (range 0.33–0.47). These results clearly show that an increase in disability confirmed at 3 or even 6 months must not be considered as equivalent to an irreversible increase in disability. Interestingly, as discussed above using similar resources, Lublin et al (2003) also found a ≥1.0 point EDSS increase relative to baseline in 28% of patients at a median of 63 days after a relapse. This suggests that, in the available placebo cohorts of patients with relapsing–remitting multiple sclerosis, the confirmed disability increases were mainly relapse driven. It seems logical to con clude that short-term confirmed increase in disability depends primarily on relapses and is often reversible.
Totally different is the issue of long-term irreversible disability. Lessons from natural history cohorts have been instructive in this respect. For the statistical analysis of the 1844 patients of the Lyon Natural History multiple sclerosis Cohort, focus was placed on robust landmarks of disability that could easily be identified through successive neurological assessments as well as by retrospective interview of the patient, whenever necessary. The landmarks were:
-
•
DSS 4: defined by walking without aid, although limited, but >500 metres without rest.
-
•
DSS 6: walking with unilateral support and limited to ≤100 metres without rest.
-
•
DSS 7: home restriction with a few steps still possible holding onto a wall or furniture but limited to ≤10 metres without rest.
Disability was defined as irreversible when one of these steps had been reached and persisted for ≥6 months, excluding any transient worsening related to relapses. This irreversibility was confirmed at any subsequent assessment during follow-up of the patient in subsequent years. From this cohort, the well-known difference between cases with a relapsing–remitting onset and those with progressive disease is again apparent: median time from the onset of multiple sclerosis to assignment of a score of DSS 4, indicating irreversible disability, was significantly longer in the relapsing–remitting than progressive onset cases. The same observation was made for time of onset to assignment of DSS 6 or 7 (Figure 4.23 and Table 4.21 ). This is in agreement with former analyses of this cohort (Confavreux et al 1980) and with results from many other series (Eriksson et al 2003; Kantarci et al 1998; Phadke 1990; Pittock et al 2004b; Runmarker and Andersen 1993; Runmarker et al 1994b; Trojano et al 1995); Weinshenker et al 1989b; 1991a). Nevertheless, progression of irreversible disability from the assignment of DSS 4 to DSS 6 was similar in cases both with a relapsing– remitting and a progressive onset (Figure 4.23 and Table 4.21). This was also true for the progression of disability from DSS 4 to DSS 7, and from DSS 6 to DSS 7 (Confavreux et al 2000)). This could be interpreted as follows: the rate of progression of irreversible disability from the assignment of DSS 4 is not affected by the presence or the absence of relapses preceding onset of the chronic progressive phase. Confirmation can be found by looking at the influence of current age on the course of multiple sclerosis: age at onset of the progressive phase is similar in primary and secondary progressive multiple sclerosis. It is therefore unaffected by the presence or the absence of relapses preceding disease progression.
Figure 4.23.

(A) Kaplan–Meier estimates for the time from onset of multiple sclerosis to the assignment of DSS 4. (B) Time from assignment of DSS 4 to DSS 6 among 1844 patients according to the initial course of the disease.
Adapted from Confavreux et al (2000).
© 2006
Table 4.21.
Kaplan–Meier estimates of the time from onset of multiple sclerosis to the onset of irreversible disability, and of the time course of irreversible disability among 1844 patients with multiple sclerosis, according to the initial course of the disease.a
| Relapsing–remitting onset |
Progressive onset |
||||
|---|---|---|---|---|---|
| Variable | Number of patients (n = 1562) | Median time (95% CI) in years | Number of patients (n = 282) | Median time (95% CI) in years | p valueb |
| Time from onset of multiple sclerosis to assignment of a score of DSS 4 | 1562 | 11.4 (10.5–12.3) | 282 | 0.0 | <0.001 |
| Time from onset of multiple sclerosis to assignment of a score of DSS 6 | 1562 | 23.1 (20.1–26.1) | 282 | 7.1 (6.3–7.9) | <0.001 |
| Time from onset of multiple sclerosis to assignment of a score of DSS 7 | 1562 | 33.1 (29.2–37.0) | 282 | 13.4 (11.0–15.9) | <0.001 |
| Time from assignment of a score of DSS 4 to assignment of a score of DSS 6 | 755 | 5.7 (4.9–6.4) | 271 | 5.4 (4.3–6.6) | 0.74 |
| Time from assignment of a score of DSS 4 to assignment of a score of DSS 7 | 755 | 12.1 (10.0–14.2) | 271 | 12.0 (10.1–13.9) | 0.70 |
| Time from assignment of a score of DSS 6 to assignment of a score of DSS 7 | 426 | 3.3 (2.8–3.9) | 169 | 4.0 (2.9–5.1) | 0.48 |
Kurtzke Disability Status Scale (DSS) was used to determine the extent of disability.
p values were calculated using the log-rank test.
Adapted from Confavreux et al (2000)
© 2006
The same material allows assessment of the possible influence of superimposed relapses during either the primary or secondary phase (Figure 4.24 and Table 4.22 ; Confavreux et al 2000)). Progression of irreversible disability from the assignment of DSS 4 to DSS 6 in the cases with either a primary or secondary progressive course was similar whether or not relapses were superimposed on the progressive phase. Paradoxically, the time from the assignment of DSS 4 to DSS 7, and from DSS 6 to DSS 7, was longer when relapses occurred on the background of progression than when there were no relapses. At the very least, it appears as though the rate of irreversible progression of disability from the assignment of DSS 4 is unaffected by relapses occurring during the progressive phase. Therefore, the evidence is for dissociation between relapses and progression in multiple sclerosis. These results match and extend those from other large studies on the natural history of multiple sclerosis. Data from the London, Ontario, multiple sclerosis Cohort show that, by comparison with primary progressive multiple sclerosis, patients with secondary progressive disease take longer to reach end points when survival curves are drawn from the time of disease onset, but a shorter interval when these are taken from onset of the progressive phase (D.A. Cottrell et al 1999a; Kremenchutzky et al 1999). The same group also showed that the survival curves are almost identical when primary progressive forms with superimposed relapses (progressive relapsing multiple sclerosis) are compared with those without (primary progressive multiple sclerosis sensu stricto) with respect to the time from onset to the assignment of DSS 6, DSS 8 and death (Kremenchutzky et al 1999). Similar conclusions have been reached by others studying primary progressive forms of multiple sclerosis for the time to DSS 6 (Andersson et al 1999).
Figure 4.24.

(A) Kaplan–Meier estimates for the time from the assignment of DSS 4 to DSS 6 amongst 496 patients with secondary progressive multiple sclerosis. (B) Kaplan–Meier estimates for the time from the assignment of DSS 4 to DSS 6 amongst 282 patients with primary progressive multiple sclerosis. Both graphs are according to the presence or absence of superimposed relapses during progression.
Adapted from Confavreux et al (2000).
© 2006
Table 4.22.
Kaplan–Meier estimates of the time course of irreversible disability among patients with secondary progressive multiple sclerosis or with progressive disease from onset, according to the presence or absence of superimposed relapses during progression.a
| Progressive course without superimposed relapses |
Progressive course with superimposed relapses |
||||
|---|---|---|---|---|---|
| Variable | Number of patients | Median time (95% CI) in years | Number of patients | Median time (95% CI) in years | p valueb |
| Secondary progressive multiple sclerosis | |||||
| Time from assignment of a disability status score of 4 to assignment of a score of 6 | 292 | 4.0 (3.1–4.9) | 191 | 4.4 (3.9–5.0) | 0.68 |
| Time from assignment of a disability status score of 4 to assignment of a score of 7 | 292 | 7.8 (6.8–8.7) | 191 | 10.0 (7.6–12.4) | 0.04 |
| Time from assignment of a disability status score of 6 to assignment of a score of 7 | 223 | 2.6 (2.1–3.1) | 133 | 4.3 (3.0–5.7) | 0.002 |
| Progressive multiple sclerosis from onset | |||||
| Time from assignment of a disability status score of 4 to assignment of a score of 6 | 163 | 5.5 (4.5–6.5) | 108 | 5.4 (3.3–7.5) | 0.71 |
| Time from assignment of a disability status score of 4 to assignment of a score of 7 | 163 | 12.4 (10.2–14.7) | 108 | 11.3 (7.8–14.7) | 0.65 |
| Time from assignment of a disability status score of 6 to assignment of a score of 7 | 104 | 4.0 (2.8–5.2) | 65 | 3.6 (2.2–5.0) | 0.68 |
Kurtzke Disability Status Scale was used to determine the extent of disability.
p values were calculated using the log-rank test.
Adapted from Confavreux et al (2000)
© 2006
These results from the Lyon, France, cohort have been reached by dichotomizing the status of relapses as present or not. When analysing the possible influence of relapses at onset and during the early years of the disease, similar results are obtained when the degree of recovery, time to the second relapse, and the number and frequency of episodes are considered (Figure 4.25 ). For instance, time to a second neurological episode positively influences median times from onset of multiple sclerosis to the assignment of DSS 4, DSS 6 and DSS 7 (Confavreux et al 2003). Similar observations have been made in many other series (V.A. Clark et al 1982; Confavreux et al 1980; Ebers 1998; Fog and Linnemann 1970; Hyllested 1961; Kantarci et al 1998; Kurtzke et al 1977); Leibowitz and Alter 1973; McAlpine 1961; Midgard et al 1995; Minderhoud et al 1988; R. Müller 1949; Phadke 1987; 1990; S. Poser and Hauptvogel 1973; 1986; Riise et al 1992; Runmarker and Andersen 1993; Thygesen 1949; Trojano et al 1995); Weinshenker et al 1989a; 1989b; 1991a; 1991b). The originality of the French study is that it assessed the possible influence of the same clinical variables on the progression of irreversible disability from the time of assignment of DSS 4 to DSS 6, and also from DSS 4 to DSS 7 and DSS 6 to DSS 7 (Confavreux et al 2003). None of these variables remained predictive of the time course of disability past this point (Figure 4.25). Progression of irreversible disability is seemingly ‘amnesic’ with respect to the clinical characteristics of relapses that occurred during the initial stages of the disease. More generally, long-term progression of irreversible disability is mainly relapse dissociated and progression driven. These observations are reminiscent of those regarding sex and age at onset of multiple sclerosis in the Gothenburg, Sweden, series: both variables showed a correlation with prognosis when analysed from the onset of multiple sclerosis but not when the analyses were repeated taking 5 years after onset as the starting point (Runmarker and Andersen 1993).
Figure 4.25.
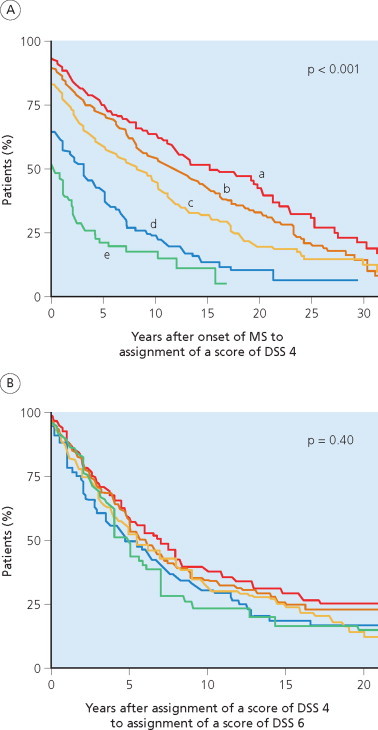
(A) Kaplan–Meier estimates for the time from onset of multiple sclerosis to the assignment of DSS 4. (B) Time from assignment of DSS 4 to DSS 6 among 1844 patients according to age of the patient at disease onset. a: 0–19 years; b: 20–29 years; c: 30–39 years; d: 40–49 years; e: ≥50 years.
Adapted from Confavreux et al (2003).
© 2006
All these observations have been collected using statistical analysis of groups of patients with multiple sclerosis. They are consistent with that claimed for individuals in the 1970s. From his prospective analysis of 73 patients, Fog concluded that the two components of the clinical course of multiple sclerosis are mutually independent. Relapses occur in an unpredictable way. Their frequency varies between individuals but also within a given individual. By contrast, the clinical progression of the neurological deficit can be subjected to mathematical analysis. In an individual patient, it is often very constant in degree and its slope decisive for prognosis. Relapses can be superimposed above the process of progression, but progression apparently pursues its course independent of the individual relapses.
To me at least, it seems strange that such a [steady progression] … could be explained solely by the summation of single attacks. … It seems therefore reasonable to believe that the phase of progression represents another biological process than the attack.
Fog and Linnemann (1970)
Course and prognosis: an age-dependent process
The influence of age on the course and prognosis of multiple sclerosis has been much studied, allowing the conclusion that patients with a late onset of disease tend to follow a primary progressive course whereas the majority of those developing symptoms earlier show an initial exacerbating–remitting pattern but with a constant rate of conversion to secondary progressive disease throughout the course of the illness (McAlpine and Compston 1952; A.R. McLean and Berkson 1951; R. Müller 1949; 1951).
More recent studies suggest that age at onset of the relapsing– remitting phase is equivalent in patients later classified either as having relapsing–remitting or secondary progressive multiple sclerosis at the time of study (Confavreux 1977; Confavreux et al 1980; Fog and Linnemann 1970; Leibowitz and Alter 1973; S. Poser 1978). In their 73 patients with multiple sclerosis, Fog and Linnemann (1970) found that mean age at onset of the relapsing–remitting phase was 28.5 years, and that this was similar in those remaining with relapsing–remitting multiple sclerosis (27.5 years) or converting to the secondary progressive phase (28.8 years). For onset of the progressive phase, they found a figure of 36.3 years, with no difference between primary (36.3 years) and secondary progressive (36.3 years) forms. In the Israeli series of 266 patients with multiple sclerosis, Leibowitz and Alter (1973) concluded that mean age at onset is 29.4 and 37.4 years for relapsing–remitting and primary progressive cases, respectively. In a cross-sectional study of 812 German patients, age at onset was 28.6 ± 8.9 years for relapsing– remitting multiple sclerosis, 31.2 ± 8.8 years for secondary progressive, and 36.8 ± 9.8 for primary progressive multiple sclerosis (p < 0.001: S. Poser 1978). In a cross-sectional survey of 342 Dutch patients (Minderhoud et al 1988), age at onset of the relapsing–remitting phase was the same in 106 individuals with relapsing–remitting multiple sclerosis (28.8 ± 10.8 years) and 108 patients with secondary progressive multiple sclerosis (29.3 ± 8.1 years). Age at onset of the progressive phase was also found to be similar in secondary (37.5 ± 8.3 years) and primary progressive multiple sclerosis (35.7 ± 11.8 years). In the updated London, Ontario, series comprising 1044 cases (D.A. Cottrell et al 1999a; Kremenchutzky et al 1999), mean age at onset was 28.6 years for cases with an initial exacerbating–remitting course and 38.5 years for multiple sclerosis that was progressive from onset.
At a time when the Lyon, France, cohort contained only 349 patients, multiple sclerosis was considered in the categories of relapsing–remitting and progressive disease (Confavreux 1977; Confavreux et al 1980). Mean age at onset was 30.0 years for all individuals. There was no difference in age at onset between patients who maintained the relapsing–remitting course (29.2 years) and those who subsequently converted to secondary progressive disease (31.7 years). Mean age at onset of disease progression was similar whether this occurred in the context of primary (37.3 years) or secondary (38.5 years) progressive multiple sclerosis. Later, the relapsing–remitting phase was itself considered in two stages: pure relapses and relapses with sequelae which, taken with the onset of disease progression, created three phases of the disease for consideration. In practice, these interact in various combinations to generate several different disease patterns, but there is no difference in the ages at onset for pure relapses (29.2 years) and relapses with sequelae (33.9 years). Conversion to disease progression occurs at 38.0 years, with no difference depending on whether this starts de novo (37.3 years) or is preceded by a relapsing–remitting phase (38.5 years; Figure 4.26 ).
Figure 4.26.

Comparative demographic and disease-related characteristics of secondary progressive multiple sclerosis and cases with a progressive initial course, among 1844 patients with multiple sclerosis from the Lyon, France, multiple sclerosis cohort.
Adapted from Confavreux et al (2000) and Confavreux et al (2005b)
© 2006
Locking the Lyon, France, natural history cohort in April 1997, when it had accumulated 1844 patients, provided an opportunity not only to readdress the possible influence of current age on the course, but now also on the prognosis of multiple sclerosis (Confavreux et al 2005a). Median age at onset was 29.0 years amongst the 1562 patients with relapsing– remitting multiple sclerosis, 28.7 years in the 1066 patients who continued only to experience episodes, and 29.5 years in those who converted to secondary progression (Figure 4.27 ). For the 778 patients who experienced disease progression, either from onset or secondary to an earlier relapsing–remitting phase, median age at onset of the progressive phase was 39.1 years. This was no different when the 496 patients with a secondary progressive course were compared with the 282 patients with an overall course progressive from onset: 39.1 and 40.1 years, respectively (Figure 4.27).
Figure 4.27.

(A) Kaplan–Meier estimates for the age at onset of the relapsing–remitting phase of multiple sclerosis. (B) Kaplan– Meier estimates for the age at onset of the progressive phase of multiple sclerosis among 1844 patients with multiple sclerosis, according to the overall course of the disease.
Adapted from Confavreux et al (2005b).
© 2006
In the same series (Confavreux et al 2005a), the Kaplan–Meier analysis provided estimates for the median age of patients at the time irreversible disability scores were reached: 44.3 years for DSS 4; 54.7 years for DSS 6; and 63.1 years for DSS 7 (Table 4.23 ). The 1562 patients with an exacerbating–remitting initial course were compared with 282 patients having a progressive course from onset with respect to age at the time of reaching irreversible scores of disability. Patients with a relapsing–remitting onset were older than those progressing from onset, for assignment of DSS 4 and DSS 6. However, the differences were only 2.7 and 2.3 years for median ages at assignment of DSS 4 and 6, respectively, for a disease usually encompassing several decades of life. There was overlap in the 95% confidence intervals of these medians for both assignments, but no difference when the two groups of patients were compared with respect to DSS 7 (Figure 4.28 and Table 4.23). Furthermore, patients with a secondary progressive course were younger at the time of reaching DSS 4, DSS 6 and DSS 7 than those with a course progressive from onset (see below). Conversion from the initial relapsing–remitting phase to secondary progression occurs at a constant rate throughout the course of the disease. Considering a cohort of patients with multiple sclerosis studied at a given time, patients with the secondary progressive course represent a subgroup of more rapidly worsening forms of multiple sclerosis within the entire group of patients with exacerbating–remitting disease at onset. Therefore, the actual age at assignment of irreversible disability in patients with an exacerbating–remitting initial course lies between boundaries for this whole group of patients and ages for patients with the secondary progressive course, and closer to ages found in patients with a progressive course from onset. Taken together, it could therefore be concluded that age at time of reaching disability landmarks is not substantially influenced by the initial course of multiple sclerosis, or the mixture of relapses and progression. This formulation provides further evidence that neurological relapses have essentially no influence on the progression of irreversible disability in the long term.
Table 4.23.
Kaplan–Meier estimates of the age of patients at the time when irreversible disability scores of DSS 4, DSS 6 and DSS 7 were obtained in 1844 patients with multiple sclerosis.a
| Age at assignment of a score of DSS 4 |
Age at assignment of a score of DSS 6 |
Age at assignment of a score of DSS 7 |
||||||||
|---|---|---|---|---|---|---|---|---|---|---|
| Variable | No. of patients (n = 1844) | Median (years) | (95% CI) | p valueb | Median (years) | (95% CI) | p valueb | Median (years) | (95% CI) | p valueb |
| Overall | 1844 | 44.3 | (43.3–45.2) | NA | 54.7 | (53.5–55.8) | NA | 63.1 | (61.0–65.1) | NA |
| Initial course of multiple sclerosis Relapsing– remitting | 1562 | 44.8 | (43.8–45.9) | Baseline comparator | 55.3 | (54.2–56.7) | Baseline comparator | 62.8 | (60.3–65.4) | Baseline comparator |
| Progressive | 282 | 42.1 | (40.2–44.0) | <0.001 | 53.0 | (51.1–54.9) | 0.002 | 63.1 | (60.0–66.2) | 0.24 |
Kurtzke Disability Status Scale (DSS) was used to determine the extent of disability.
p values were calculated using the log-rank test.
Adapted from Confavreux et al (2005a)
© 2006
Figure 4.28.
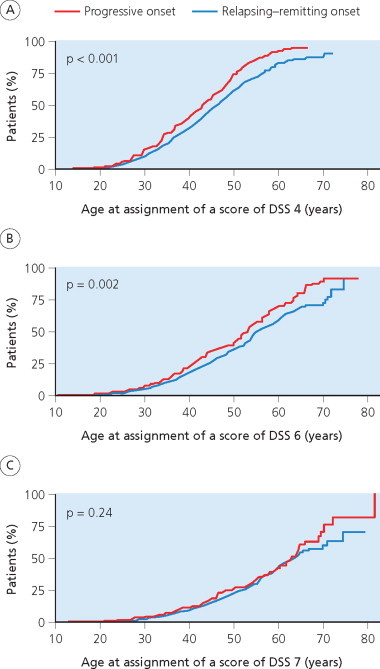
Kaplan–Meier estimates for the age at assignment of DSS 4 (A), DSS 6 (B) and DSS 7 (C) amongst 1844 patients with multiple sclerosis, according to the initial course.
Adapted from Confavreux et al (2005a).
© 2006
However, it would be an oversimplification to consider disability in multiple sclerosis as strictly age dependent. Age at onset also influences prognosis: the earlier the onset of the disease, the younger the age at disability landmarks (Confavreux et al 1980; 2005a). This is well illustrated in Figure 4.29 drawn from the 1980 analysis of the Lyon, France, cohort. Similarly, in a large hospital-based study of 1463 Italian patients with multiple sclerosis (Trojano et al 2002), age at onset and current age of the patients both correlated with disease severity – the effect of the former being smaller by comparison. Furthermore, these results, obtained in a cohort of patients, do not contradict the high variability in age at onset of the relapsing–remitting and progressive phases, and times of reaching disability landmarks, observed among individuals with multiple sclerosis. However, the age dependency phenomenon surmounts this variability showing no influence of the initial course on age at disability milestones. The dependency of course and prognosis on current age suggests that mechanisms related to aging play a role in the neurodegenerative process operating in multiple sclerosis. As discussed in Chapter 10, these may operate through unrelated endogenous mechanisms or relate to the complex interplay between injury and repair.
Figure 4.29.

Age at onset of multiple sclerosis and age at times of assignment of irreversible disability among 349 patients with multiple sclerosis. Moderate disability = DSS 4. Severe disability = DSS 7. The digits below the horizontal arrows indicate the time (years) to reach the disability landmarks as calculated from the onset of the disease.
Adapted from Confavreux et al (1980).
© 2006
To illustrate this point, one might make the comparison with a train having three carriages: the first corresponding to the relapsing–remitting period with recovery; the second to the relapsing–remitting period with sequelae; and the third to the progressive phase (Confavreux 1977). The first traveller – say, a 29-year-old – gets into the front carriage; the next passenger, who is a little late, and aged 34 years, gets in the next accessible carriage as the train moves off; the seriously late traveller, now aged 38 years, just has time to clamber aboard the third carriage and suffers progressive multiple sclerosis. Alternatively, the metaphor can be constructed along the lines that most travellers get into the first carriage (mean age 31 years) and, as the train stops at different stations, new passengers climb aboard displacing those already settled and relocating them to the second (34 years) and third carriages (38 years). (Whether this formulation tells us more about the behaviour of individuals on the French railway system than multiple sclerosis is a matter for the reader.)
To conclude, disease severity is influenced by age at onset of multiple sclerosis, the benign and severe forms being more frequent in younger and older patients, respectively. But it remains a matter of debate whether, from the patient's perspective, having ‘benign’ multiple sclerosis from early adult life is necessarily preferable to developing a more ‘rapid’ form much later (Confavreux 1977; Confavreux et al 1980). Clearly, as clinical scientists we wish to deal effectively with all manifestations of the disease without making quality judgments on who has it ‘good’ or ‘bad’.
Primary and secondary progression: differences and similarities
The reasons why progression may start de novo or after a period of episodes remains largely unexplained. This has led many neurologists to consider primary progressive multiple sclerosis as a separate entity from other forms of the disease. Recent analysis of the Lyon, France, natural history cohort (Confavreux et al 2005b) and available data from other sources in the literature has allowed the clinical evidence for and against this hypothesis to be reconsidered.
Secondary progressive multiple sclerosis and relapsing–remitting multiple sclerosis
Table 4.24 shows a difference in the Lyon, France, cohort relating to gender distribution; there are more females amongst 1066 cases with relapsing–remitting disease than in the 496 individuals with secondary progressive multiple sclerosis. By contrast, the two populations are similar in the distribution of initial symptoms during the relapsing–remitting phase, the degree of recovery from the first relapse, and the time from onset to the second neurological episode (Table 4.24). As already discussed, distribution according to age at onset of the relapsing–remitting phase is strikingly similar (Figure 4.27) and in agreement with other series (Fog and Linnemann 1970; Leibowitz and Alter 1973; Minderhoud et al 1988; S. Poser 1978). Similarities also emerge from brain MRI analyses. Although the lesion load is usually considered higher in secondary progressive than relapsing–remitting multiple sclerosis, the MRI activity is identical and, to most authors, indistinguishable between these variants of the disease (W.I. McDonald 1994; A.J. Thompson et al 1991; Van Walderveen et al 1998).
Table 4.24.
Comparative demographic and disease-related characteristics of relapsing–remitting cases and secondary progressive cases, among 1562 patients with an exacerbating–remitting onset from the Lyon multiple sclerosis cohort.
| Relapsing–remitting multiple sclerosisa (n = 1066) | Secondary progressive multiple sclerosisa (n = 496) | p value | |
|---|---|---|---|
| Gender (%) | |||
| Males | 32 | 39 | |
| Females | 68 | 61 | 0.006* |
| Age at onset of multiple sclerosis (years) | |||
| Mean ± SD | 29.4 ± 9.3 | 29.8 ± 9.9 | 0.39** |
| Median | 28.7 | 29.5 | |
| Initial symptoms of the relapsing–remitting phase (%) | |||
| Isolated optic neuritis | 21 | 22 | 0.13* |
| Isolated brainstem dysfunction | 9 | 12 | |
| Isolated dysfunction of long tracts | 46 | 47 | |
| Combination of symptoms | 24 | 19 | |
| Recovery from the first episode (%) | |||
| Complete | 83 | 81 | 0.25* |
| Incomplete | 17 | 19 | |
| Kaplan–Meier estimate of the time from onset of multiple sclerosis to the second episode (years) | |||
| Median | 1.7 | 2.3 | 0.07** |
| Duration of multiple sclerosis (years) | |||
| Mean ± SD | 8.7 ± 8.6 | 17.6 ± 9.6 | < 0.001*** |
p values are calculated with use of the chi-squared test (*), the log rank test (**), or Student's t test (***).
SD = standard deviation.
Defined according to the Lublin and Reingold (1996)classification.
Adapted from Confavreux et al (2005b)
© 2006
By contrast, the two populations in the Lyon, France, cohort clearly differ in duration of the disease, which was twice as long in the secondary progressive (17.6 ± 9.6 years) compared with the relapsing–remitting multiple sclerosis group (8.7 ± 8.6 years: Table 4.24). Others have reached the same conclusions. In a German study, disease duration at the time of the survey was 6.1 ± 7.2 years in relapsing–remitting and 11.7 ± 8.0 years in secondary progressive multiple sclerosis, a highly significant difference (p < 0.001: S. Poser 1978). In an Italian study, corresponding figures were 7.3 ± 5.5 in relapsing–remitting and 14.3 ± 8.6 years in secondary progressive multiple sclerosis (Trojano et al 1995). We conclude that patients with an initial exacerbating–remitting course of multiple sclerosis will naturally convert to the secondary progressive phase at a rate of around 2–3% per annum, following an essentially linear curve (see Figure 4.10). The longer the disease duration at the time of the survey, the higher the proportion of cases classified as secondary progressive multiple sclerosis compared with those classified as having relapsing–remitting disease. Although the relapsing– remitting and secondary progressive phases clearly represent two clinical stages of the same disease in patients with bout onset multiple sclerosis, this is an argument in favour of the hypothesis that secondary progressive multiple sclerosis is relapsing–remitting multiple sclerosis that has had ‘time to grow older’ (Confavreux 1977; Confavreux et al 1980).
Primary progressive multiple sclerosis and progressive relapsing multiple sclerosis
By definition, these apparently distinct forms of multiple sclerosis share the progressive onset but differ in that superimposed relapses accompany progressive relapsing but not primary progressive multiple sclerosis (Lublin and Reingold 1996). Among the 218 patients of the London, Ontario, series with an initial progressive course (D.A. Cottrell et al 1999a; Kremenchuzky et al 1999), 28% exhibited ≥1 distinct relapse during progression, sometimes decades after disease onset, qualifying them for reclassification as progressive relapsing forms of multiple sclerosis (Lublin and Reingold 1996). In 50%, relapses occurred in the first 10 years, and at intervals from onset to 20 years or more for the other half. Relapses were never frequent, and most patients had but a single episode. This was usually mild and followed by good recovery (Kremenchutzky et al 1999). Among the 282 patients with a progressive initial course of multiple sclerosis from the Lyon, France, series (Confavreux et al 2000; 2005b), 109 (39%) could be qualified thus. Table 4.25 shows that median age at onset was earlier in progressive relapsing (37 years) than in primary progressive cases (41 years; p < 0.02), although this is the only difference that could be observed when comparing these two forms of multiple sclerosis according to demographic and clinical characteristics, such as gender and initial symptoms of the disease. A similar trend for age at onset was found in the London, Ontario, series (Kremenchutzky et al 1999).
Table 4.25.
Comparative demographic and disease-related characteristics of progressive relapsing cases and primary progressive cases, among 282 patients with a progressive onset of multiple sclerosis from the Lyon, France, multiple sclerosis cohort.
| Progressive relapsing multiple sclerosisa n = 109 | Primary progressive multiple sclerosisa n = 173 | p value | |
|---|---|---|---|
| Gender (%) | |||
| Males | 38 | 46 | 0.15* |
| Females | 62 | 54 | |
| Age at onset of multiple sclerosis (years) | |||
| Mean ± standard deviation | 37.3 ± 11.5 | 40.6 ± 10.7 | 0.02** |
| Median | 38.1 | 41.3 | |
| Initial symptoms of multiple sclerosis (%) | |||
| Isolated optic neuritis | 1 | 2 | 0.18* |
| Isolated brainstem dysfunction | 0 | 1 | |
| Isolated dysfunction of long tracts | 80 | 87 | |
| Combination of symptoms | 19 | 10 | |
| Kaplan–Meier estimates of the time (median in years) | |||
| From onset of multiple sclerosis to assignment of a disability status score of | |||
| DSS 4 | 0.0 | 0.0 | 0.50** |
| DSS 6 | 7.5 | 6.8 | 0.37** |
| DSS 7 | 13.7 | 12.8 | 0.92** |
| From assignment of a disability status score of 4 to | |||
| DSS 6 | 5.4 | 5.5 | 0.71** |
| DSS 7 | 11.3 | 12.4 | 0.65** |
| From assignment of a disability status score of 6 to | |||
| DSS 7 | 3.6 | 4.0 | 0.68** |
| Kaplan–Meier estimates of the age (median in years) at the time of assignment of a disability status score of | |||
| DSS 4 | 40.0 | 43.3 | 0.003** |
| DSS 6 | 52.2 | 54.7 | 0.09** |
| DSS 7 | 58.7 | 64.4 | 0.11** |
| Duration of multiple sclerosis (years) | |||
| Mean ± standard deviation | 10.9 ± 7.4 | 9.6 ± 8.4 | 0.20*** |
p values are calculated with use of the chi-squared test (*), the log rank test (**), or Student's t test (***).
DSS = Kurtzke Disability Status Scale.
Defined according to theLublin and Reingold (1996)classification.
Adapted from Confavreux et al (2000) and Confavreux et al (2005b)
© 2006
The rates at which irreversible disability progresses, calculated from the onset of multiple sclerosis or from assignment of a given disability score, were essentially similar in progressive relapsing and primary progressive multiple sclerosis. In both cases, the Lyon, France, cohort (Confavreux et al 2000; 2005b) showed median survival times from onset of multiple sclerosis at 0, 7 and 13 years to reach DSS 4, DSS 6 and DSS 7, respectively (Table 4.25). Taking DSS 4 as the baseline, median times to reach DSS 6 and DSS 7 were 5 and 12 years, respectively. From DSS 6, median time to reach DSS 7 was 4 years. These results are consistent with other series. In the London, Ontario, series, there were no differences in time to reach disability levels assessed by survival analyses from onset of multiple sclerosis when comparing primary progressive and progressive relapsing disease: in both situations, median times to reach DSS 3, DSS 6, DSS 8 and death were 3, 8, 18 and 35 years, respectively (D.A. Cottrell et al 1999a; Krementchutzky et al 1999). No other differences between the two forms of multiple sclerosis could be discerned when calculations were made from assignment of DSS 3 to reach DSS 6, DSS 8 and death (Kremenchutzky et al 1999). In a Californian cross-sectional study based upon telephone interview with a standardized questionnaire – comprising 83 cases with primary progressive multiple sclerosis and 12 with progressive relapsing multiple sclerosis – survival time from onset of multiple sclerosis to reach DSS 6 was 10.2 ± 1.0 years and 10.9 ± 2.6 years in primary progressive and progressive relapsing multiple sclerosis, respectively (Andersson et al 1999). We entirely endorse the position of the Canadian and the Californian studies: these results indicate that progressive relapsing and primary progressive multiple sclerosis are, from a clinical point of view, essentially the same. Therefore, it is appropriate to pool these cases in a single category initially having a progressive course, the only difference being the subsequent experience of superimposed relapses. The occasional confusion between progressive relapsing and secondary progressive multiple sclerosis might account for the slightly earlier onset in progressive relapsing than primary progressive multiple sclerosis. The single report containing preliminary comparative information on brain and spinal cord MRI in these two forms of multiple sclerosis offers no pathological data and lacks firm conclusions (Andersson et al 1999).
Secondary progressive multiple sclerosis and multiple sclerosis with a progressive initial course
The variations in clinical pattern between primary and secondary progressive multiple sclerosis have often been compared, and the general consensus is that they are very different. A semantic issue needs to be settled. For several decades, clinicians and investigators involved in the study of multiple sclerosis agreed a single definition for secondary progressive multiple sclerosis and this was eventually adopted in the international survey classification (Lublin and Reingold 1996). The female preponderance expected in a general population of patients with multiple sclerosis is much reduced in cases with an initial progressive course, compared with those with secondary progressive multiple sclerosis (D.A. Cottrell et al 1999a; Kremenchutzky et al 1999); McDonnell and Hawkins 1996; 1998b; A.J. Thompson et al 1997). In the Lyon, France, cohort there was only a trend in that direction, not reaching statistical significance (Table 4.26 : Confavreux et al 2005b). From the clinical perspective, the initial course and symptoms – more often related to dysfunction of long tracts in multiple sclerosis with a progressive onset than in secondary progressive disease – are very different (see data for the Lyon, France, cohort in Tables 4.24 and 4.26). Arguing from the position that age at onset is greater, time to assignment of irreversible disability shorter, prognosis worse (Table 4.26, and see above), MRI characteristics and the pathology are both different (see Chapters 7 and 12; Revesz et al 1994), and genetic susceptibility occurs on a different background (see Chapter 3; Masterman et al 2000a; Olerup et al 1989), the majority of clinicians consider primary progressive multiple sclerosis to be distinct from secondary progressive disease – but that leaves open the issue of whether this arises from complexity or true disease heterogeneity (see Chapter 14).
Table 4.26.
Comparative demographic and disease-related characteristics of secondary progressive multiple sclerosis and cases with a progressive initial course, among 1844 patients with multiple sclerosis from the Lyon, France, multiple sclerosis cohort.
| Secondary progressive multiple sclerosisa (n = 496) | multiple sclerosis with a progressive initial courseb (n = 282) | p value | |
|---|---|---|---|
| Gender (%) | |||
| Males | 39 | 43 | 0.32* |
| Females | 61 | 57 | |
| Age at onset of the progressive phase of multiple sclerosis (years) | |||
| Mean ± standard deviation | 39.5 ± 10.3 | 39.4 ± 11.3 | 0.47** |
| Median | 39.1 | 40.1 | |
| Initial symptoms of the progressive phase of multiple sclerosis (%) | |||
| Isolated optic neuritis | 0 | 2 | 0.11* |
| Isolated brainstem dysfunction | 0 | 0 | |
| Isolated dysfunction of long tracts | 85 | 84 | |
| Combination of symptoms | 15 | 14 | |
| Superimposed relapses during the progressive phase (%) | |||
| Yes | 40 | 39 | 0.81* |
| No | 60 | 61 | |
| Kaplan–Meier estimates of the time (median in years) | |||
| from onset of multiple sclerosis to assignment of | |||
| DSS 4 | 6.1 | 0.0 | <0.001** |
| DSS 6 | 12.5 | 7.1 | <0.001** |
| DSS 7 | 19.1 | 13.4 | <0.001** |
| From assignment of a disability status score of 4 to | |||
| DSS 6 | 4.0 | 5.4 | 0.001** |
| DSS 7 | 9.0 | 12.0 | <0.001** |
| From assignment of a disability status score of 6 to | |||
| DSS 7 | 3.0 | 4.0 | 0.09** |
| Kaplan–Meier estimates of the age (median in years) at the time of assigning a disability status score of | |||
| DSS 4 | 37.6 | 42.1 | <0.001** |
| DSS 6 | 45.5 | 53.0 | <0.001** |
| DSS 7 | 53.3 | 63.1 | <0.001** |
| Duration of multiple sclerosis (years) | |||
| Mean ± standard deviation | 17.6 ± 9.6 | 10.1 ± 8.0 | <0.001*** |
p values are calculated with use of the chi-squared test (*), the log rank test (**), or Student's t test (***).
DSS = Kurtzke Disability Status Scale.
Defined according to theLublin and Reingold (1996)classification.
Denotes the pooling of cases with ‘progressive relapsing multiple sclerosis' and of cases with ‘primary progressive multiple sclerosis' (Lublin and Reingold 1996).
Adapted from Confavreux et al (2000) and Confavreux et al (2005b)
© 2006
But the distinctions are not necessarily so clear-cut. In fact, comparing cases from the time that progression becomes manifest (at onset or after a period of episodes) reveals many similarities. Table 4.26 shows that, in the Lyon, France, cohort, age and initial symptoms at onset of the progressive phase were similar in the 496 cases with secondary pro gressive multiple sclerosis and the 282 cases with progressive disease from onset. The proportion of cases with superimposed relapses during progression was around 40% in both categories. However, the time course of disability accumulation during the progressive phase of the disease was more rapid and occurred earlier in secondary progressive multiple sclerosis than individuals with a progressive onset. For instance, the median survival time from DSS 4 to DSS 6 was 4.0 years in secondary progressive multiple sclerosis and 5.4 years in multiple sclerosis with progression from onset (p = 0.001). Similarly, median age at reaching DSS 4 was 37.6 and 42.1 years in these two groups, respectively (p < 0.001). This leads to the conclusion that, once clinical progression has started, the rate at which disability accumulates is faster in secondary progressive multiple sclerosis than cases with progression from onset (Confavreux et al 2000); 2005b). These are not unique observations. From analyses based upon crude observational data, time from onset of progression to reach DSS 7 in a Dutch series was shorter in the 108 cases with secondary progressive multiple sclerosis than in the 128 cases with progressive disease from onset (Minderhoud et al 1988). In the London, Ontario, cohort, the median survival time from onset of progression to reach DSS 6 was 5.5 years in the 538 patients with secondary progressive multiple sclerosis and 9.5 years in the 218 patients with an initial progressive course. For the time to reach DSS 8, the corresponding figures were around 15 and 20 years, respectively (D.A. Cottrell et al 1999a; Kremenchutzky et al 1999). Conversely, in the Gothenburg, Sweden, cohort (Runmarker and Andersen 1993), median survival time from the onset of progression to DSS 6 was 5.2 years for the 162 cases with secondary progressive multiple sclerosis and 6.0 years for the 36 with progression from onset, but this is not statistically significant (Figure 4.30 ).
Figure 4.30.

Kaplan–Meier estimates for the time (years) from onset of progression to the assignment of DSS 6 among 162 patients with secondary progressive and 36 patients with primary progressive multiple sclerosis. Primary progressive multiple sclerosis denotes here the pooling of cases with ‘primary progressive multiple sclerosis’ and cases with ‘progressive relapsing multiple sclerosis’ according to the classification of Lublin and Reingold (1996).
Adapted from Runmarker and Andersen (1993). © 1993, reprinted with permission of Springer-Verlag GmbH.
© 2006
Cases with an initial relapsing–remitting course and cases with an initial progressive course
It serves little purpose to restate the differences regarding sex ratio, age and symptoms at onset or survival times from onset or between disability landmarks because these are essentially similar to what has already been discussed. Our objective here is to compare, within a general cohort of patients having multiple sclerosis, all cases with an exacerbating–remitting onset (i.e. ‘relapsing–remitting multiple sclerosis’ and ‘secondary progressive multiple sclerosis’) and those with a progressive onset (i.e. ‘progressive relapsing multiple sclerosis’ and ‘primary progressive multiple sclerosis’) with respect to the time course of disability. In the 1562 patients with an exacerbating–remitting initial course and the 282 patients with progression from onset in the Lyon, France, cohort (Confavreux et al 2000); 2005b), the time from assignment of DSS 4 to reach DSS 6 and DSS 7, and the time from DSS 6 to DSS 7, appeared strikingly similar (Table 4.27 ). Furthermore, as already discussed, age at time of assigning disability landmarks could be viewed as not substantially influenced by the initial course, be that exacerbating– remitting or progressive.
Table 4.27.
Comparative demographic and disease-related characteristics of cases with an exacerbating–remitting initial course and cases with a progressive initial course of multiple sclerosis, among 1844 patients with multiple sclerosis from the Lyon, France, multiple sclerosis cohort.
| multiple sclerosis with an exacerbating– remitting initial coursea (n = 1562) | multiple sclerosis with a progressive initial courseb (n = 282) | p value | |
|---|---|---|---|
| Gender (%) | |||
| Males | 34 | 43 | 0.006** |
| Females | 66 | 57 | |
| Age at onset of multiple sclerosis (years) | |||
| Mean ± standard deviation | 29.6 ± 9.5 | 39.4 ± 11.3 | <0.001** |
| Median | 29.0 | 40.1 | |
| Initial symptoms of multiple sclerosis (%) | |||
| Isolated optic neuritis | 21 | 2 | |
| Isolated brainstem dysfunction | 10 | 0 | <0.001* |
| Isolated dysfunction of long tracts | 47 | 84 | |
| Combination of symptoms | 22 | 14 | |
| Kaplan–Meier estimates of the time (median in years) | |||
| from onset of multiple sclerosis to assignment of a disability status score of | |||
| DSS 4 | 11.4 | 0.0 | <0.001** |
| DSS 6 | 23.1 | 7.1 | <0.001** |
| DSS 7 | 33.1 | 13.4 | <0.001** |
| From assignment of a disability status score of 4 to | |||
| DSS 6 | 5.7 | 5.4 | 0.74** |
| DSS 7 | 12.1 | 12.0 | 0.70** |
| From assignment of a disability status score of 6 to | |||
| DSS 7 | 3.3 | 4.0 | 0.48** |
| Kaplan–Meier estimates of the age (median in years) at the time of assigning a disability status score of | |||
| DSS 4 | 44.8 | 42.1 | <0.001** |
| DSS 6 | 55.3 | 53.0 | 0.002** |
| DSS 7 | 62.8 | 63.1 | 0.24** |
| Duration of multiple sclerosis (years) | |||
| Mean ± standard deviation | 11.5 ± 9.9 | 10.1 ± 8.0 | <0.001*** |
p values are calculated with use of the chi-squared test (*), the log rank test (**), or Student's t test (***).
DSS = Kurtzke Disability Status Scale.
Denotes the pooling of cases with ‘relapsing remitting multiple sclerosis' and of cases with ‘secondary progressive multiple sclerosis' (Lublin and Reingold 1996).
Denotes the pooling of cases with ‘progressive relapsing multiple sclerosis' and of cases with ‘primary progressive multiple sclerosis' (Lublin and Reingold 1996).
Adapted from Confavreux et al (2000) and Confavreux et al (2005b)
© 2006
Therefore, the generally observed more rapid accumulation of disability (Confavreux et al 2000); D.A. Cottrell et al 1999a; Minderhoud et al 1988; Kremenchutzky et al 1999), and the earlier age at disability milestones observed in the Lyon, France, series (Confavreux et al 2005a) in secondary progressive multiple sclerosis compared with individuals with a progressive onset, more probably reflect limited disease duration at the time of the survey. Indeed, the proportion of cases with an exacerbating– remitting onset converting to secondary progression follows a somewhat linear curve during the course of multiple sclerosis. The shorter the disease duration, the fewer the cases with secondary progressive multiple sclerosis within the population of cases having an initial exacerbating–remitting course. The subgroup of individuals with an exacerbating–remitting onset already having converted to secondary progressive multiple sclerosis at the time of any survey, selects the most severe group from the cohort of all cases with an exacerbating–remitting onset. It is therefore not surprising that, the longer the disease lasts, the more estimates for the time course of disability accumulation slow down and approximate to those seen in the population with progressive multiple sclerosis from onset. In the Gothenburg, Sweden, cohort, where the proportion of secondary progressive multiple sclerosis (77% of cases with an exacerbating remitting onset) and the duration of the disease (>25 years) were both high, accumulation of disability was similar in progressive onset and secondary progressive multiple sclerosis (see Figure 4.30; Runmarker and Andersen 1993). Therefore, from a clinical perspective, secondary and primary progression share much more than they differ.
INTERCURRENT LIFE EVENTS
The person with multiple sclerosis is no less exposed to intercurrent life events than any other member of society. These may be natural, such as pregnancy and the puerperium; accidental, as in stress, trauma and infection; or interventional, through vaccinations. The neurologist should be aware of their possible influence on the patient and, in some instances, that person's relatives. Mainly this information provides for accurate and comprehensive counselling but it may also serve medico-legal purposes. Some of these life events can be regarded as experiments of nature, proving informative about disease mechanisms and, sometimes, suggesting new therapeutic strategies.
There is no biological rationale for considering the first clinical episode of demyelination – the onset of multiple sclerosis – as different from the subsequent events, designated ‘relapses’ once the diagnosis is established. Perhaps, the first episode is more instructive because it lies closer to events that cause the disease process; but it is clear that clinical onset and disease onset are not synonymous, often being separated by many years (McDonnell 2003) or, occasionally, an entire lifetime (Gilbert and Sadler 1983). Here, we leave aside the issues of causation (see Chapter 2) and focus on the possible triggering effect of intercurrent events on the activity of a disease process that is already established, even if not yet clinically overt.
Methodological considerations
Many intercurrent life events are suspected of triggering relapses in people with multiple sclerosis but establishing a causal relationship is not always straightforward. There are a number of possible methodological pitfalls. Defining and ascertaining the putative provocative event may be difficult; not for pregnancy and delivery or vaccinations, but more so with trauma, stress and infections (see below), and in deciding with confidence that the patient has genuinely experienced a new relapse. Many episodes are characterized clinically by the worsening of existing symptoms or the reappearance of those formerly experienced by the patient. Here, the distinction has to be made from pseudorelapses in which a variety of mechanisms, other than disease activity, may be responsible for the change in clinical symptoms (see Chapters 13 and 16). It may therefore be appropriate only to consider episodes featuring new neurological manifestations with respect to the past history of that patient; these more reliably correspond to disease activity in the central nervous system. One solution is to use an acknowledged surrogate marker for relapse. The assessment of MRI activity from new and enlarging T2 lesions, and gadolinium enhancing lesions on T1-weighted sequences serve this purpose (W.I. McDonald 1994; McFarland et al 1992) but make the study more demanding for the patient; and, for the researcher, more costly and therefore less feasible.
Much attention must also be paid to the protocol design. Prospective studies are considered the gold standard. Ideally, to minimize ascertainment bias, registration of exposure to the event and a new clinical event should be made by two different examiners, blind to the other's observations. Furthermore, patients should not be briefed on the nature and purpose of the study until completion, in order to protect from the potential of that person misconstruing a pseudorelapse for an actual episode, after exposure to the event of interest in the study. All of these objectives are far from easy to achieve in practice. That said, prospective designs reduce the risk of undernotification both for intercurrent events and relapse, especially when assessments are performed at close intervals. Monthly to quarterly assessment of relapse frequency seems to be a good compromise. By contrast, retrospective designs for addressing events such as infection and relapse are much less satisfactory because they introduce recall bias for the putative infection, the status of which can never reliably be ascertained. However, it must be emphasized that there are situations, relating to the epidemiology of multiple sclerosis, for which retrospective protocols represent an excellent choice. The prerequisite is that both the possible triggering event and the clinical outcome can easily be ascertained in retrospect. This is the case for vaccinations, which can reliably be validated from certificates, and for relapses when using pre-established databases containing appropriate descriptors of the disease in individual patients (Confavreux et al 2001). Such retrospective protocols offer major advantages. They allow for a quicker answer compared with a prospective protocol, because the research data are available from the outset. Blinding is reliable, thus minimizing association bias – the tendency for patient and examiner spuriously to register a relapse after the possible triggering event.
Ideally, studies that aim to assess the effect of a given event on relapses of multiple sclerosis should be randomized and placebo controlled. This type of protocol can be designed for interventions such as vaccinations. It is, however, unrealistic for natural events – pregnancy and parturition – or episodes of trauma, stress and infection. That is why such studies are mainly observational. Next is the reference population to which events in the group at risk should be compared. Unrelated controls, historical or contemporary, can be selected but for triggering events this may not be ideal. The likelihood of being exposed to the event is never independent of disease activity or disability. A simple example can be offered with respect to pregnancy in multiple sclerosis. This may be because the decision of a woman with multiple sclerosis to become pregnant is bound to be influenced by her level of disease activity. In the two studies on pregnancy and multiple sclerosis using a specific matched group, the control patients had higher annualized relapse rates (0.86 and 0.82) than the pregnancy group during their non-pregnancy phases of the study (0.51 and 0.63, respectively: Roullet et al 1993; Sadovnick et al 1994). The higher relapse rate in controls from these two examples suggests that the decision to embark on pregnancy is associated with lower than average relapse rates. For this reason, the design in which comparison is made with periods at risk and not at risk for the individual participants is preferred. At-risk periods following exposure to the event of interest are predefined, with the assumption that if a relapse is observed during this period, it can be regarded as associated with the event. Periods not at risk serve as control intervals. The relapse rates during these two epochs are then systematically compared. Such designs, equivalent to a case–control approach (where cases serve as their own controls), have numerous advantages when dealing with acute events such as relapses of multiple sclerosis and transient exposures including vaccinations, infections or obstetric delivery. They avoid the need for control subjects and account for confounding factors that could not be addressed by a classical case–control approach, because of the large variability in clinical characteristics of multiple sclerosis.
The period at risk must be regarded as the limits for an effect – the interval in which a relapse must occur to justify a causal relationship to the event of interest. Over what period to consider exposure potentially relevant requires judgment. The intervals should be set on the basis of plausibility and scrutiny of the available literature. For instance, 2 months was adopted in the study of vaccines and relapses of multiple sclerosis (Confavreux et al 2001). For infections, extending the period at risk ahead of the date when the manifestations of infection first became apparent makes sense because of difficulty in precisely dating the onset of many infections (Sibley et al 1985). Furthermore, it is well established that virus shedding can occur as early as 13 days before the onset of clinical symptoms (Sibley et al 1985). Therefore, it is logical to assess the sensitivity of analyses using varying periods at risk in order to be satisfied that the findings are robust.
Eventually, the investigator has to decide whether an association is coincidental or causal. Biological plausibility must clearly be taken into consideration. Evidence based on anecdotal reports is easily challenged, on the grounds that this introduces bias towards cases exhibiting such an association. That said, these clues should not invariably be discarded without due consideration. Often, it is such anecdotal evidence that suggests a genuine association. It follows that, for physicians and lay people alike, once the suggestions have been duly registered, supportive evidence for the association must be sought from appropriately designed and conducted epidemiological and mechanistic studies. In the event, many alleged associations based on anecdotal reports are refuted by subsequent prospective studies. Lastly, negative studies must also be interpreted properly. It is often said that they can never exclude the putative association. This conclusion can be accepted when the studies are woefully lacking in statistical power; but negative studies may be very informative in providing confidence intervals around the final result. They indicate the range and limits within which the actual magnitude of the association lies with 95% probability.
The possible influence of intercurrent events on the activity of multiple sclerosis is much less easy to establish than a therapeutic effect. Whilst the prospective, randomized, placebo-controlled, parallel groups, double-blind design is ideal, it is not always applicable or even appropriate in an area of research requiring flexibility, imagination and subtlety of approach.
Pregnancy and the puerperium
multiple sclerosis mainly affects women in their childbearing years, and the issue of pregnancy is therefore a major concern for many affected individuals. Important questions include the effects of pregnancy, delivery, epidural analgesia and breast feeding on the course of the illness; and, conversely, the possible influence of multiple sclerosis on the pregnancy, the delivery and the infant. Understandably, the prospective mother will wonder whether multiple sclerosis may recur in her child, and reflect on the possibility that evolution of her own neurological illness may limit the ability to participate actively in the child's upbringing. Each issue raises anxieties for the young woman with multiple sclerosis wanting to have a child.
For many years, women with multiple sclerosis were actively discouraged from contemplating pregnancy due to the possible deleterious effect of pregnancy on the disease (Douglass and Jorgensen 1948). But reliable information was lacking and most opinion offered ex cathedra. In the early 1950s, the pendulum of opinion swung and pregnancy was stated to be without any adverse effect (Sweeney 1955; Tillman 1950). Since then, a number of studies looking at specific aspects of the potential risks have been published (for review, see Abramsky 1994; Birk and Rudick 1986; Hutchinson 1993), replacing this with a more informed view concluding that relapse rate decreases during the last trimester of pregnancy, but rebounds in the immediate postpartum period. However, important issues were incompletely addressed in these surveys and many findings remained contradictory. The majority of studies enrolled a limited number of patients, and therefore lacked statistical power; they were performed at a single centre so that the results could not be generalized; or the data were gathered retrospectively and so likely to suffer from recall bias. Some surveys had recourse to non-pregnant controls but, as discussed above, women with multiple sclerosis who decide to become pregnant tend to have a more benign course than those who choose not to have children.
Relapses of multiple sclerosis
Pregnancy In multiple sclerosis (PRIMS) was the first large prospective study of the natural history in pregnant women with multiple sclerosis (Confavreux et al 1998b; Vukusic et al 2004). Previously, the only study that could be considered prospective using conventional criteria (Friedman 1987; Rudick 1995) was based on eight women (Birk et al 1990). The annualized relapse rate during pregnancy was 0.2, whereas it reached 3.0 during the 3-month post-delivery period (Table 4.28 ). Four previous studies of pregnancy and relapse frequency in women with multiple sclerosis reported annualized rates for the non-pregnancy period in the range 0.09–0.32 (Ghezzi and Caputo 1981; Korn-Lubetzki et al 1984; Millar et al 1959; Schapira et al 1966) suggesting that the retrospective review was insensitive and not adequate. Presumably the same criticism can be levelled at the study reported by L.M. Nelson et al (1988), which used a structured interview screening the past pregnancies of a specific population of women with multiple sclerosis selected for the purpose of a therapeutic trial (Table 4.28). Self-evidently, the ability to detect a relapse depends on intensity of the clinical assessments (Fog and Linnemann 1970). We expect a mean relapse rate in young women with recent onset multiple sclerosis of ≥0.5 per year (Confavreux et al 1980; Weinshenker et al 1989a). Despite the methodological limitations, these studies did consistently show an increased relapse rate in the first 3 months after delivery. Three of these early surveys (Ghezzi and Caputo 1981; Millar et al 1959; Schapira et al 1966) also showed a decrease in the number of relapses during pregnancy but with a significantly higher relapse rate overall during the ‘pregnancy-year’ (9 months of pregnancy and the first 3 months postpartum) by comparison with periods not pregnant in the same individuals, and non-pregnant controls. The fourth study is notable for first recognizing what is now acknowledged to be the true pattern of evolution – that is, relapse frequency decreases during pregnancy and then increases immediately postpartum, but is similar across the pregnancy year to the frequency observed in the same patients out of pregnancy (Korn-Lubetzki et al 1984). In other words, pregnancy and childbirth have no net effect on the relapse rate. The single change lies in the chronology of relapses, the latter being deferred to the puerperium.
Table 4.28.
Natural history literature data on the relapse rate of multiple sclerosis during pregnancy and post partum
| Study | Number of pregnancies (number of women) | Annualized relapse rate |
||||
|---|---|---|---|---|---|---|
| Pregnancy | 1st trimester post partum | Pregnancy year | Internal control | External control | ||
| Studies with reference relapse rate <0.5/yr | ||||||
| Millar et al 1959 | 170 (70) | 0.05 | 0.92 | 0.26 | 0.09 | 0.10 |
| Schapira et al 1966 | 124 (NA) | 0.13 | 0.61 | 0.25 | 0.17 | 0.14 |
| Ghezzi and Caputo 1981 | 206 (119) | 0.22 | 1.77 | 0.61 | 0.32 | 0.29 |
| Korn-Lubetzki et al 1984 | 199 (66) | 0.13 | 0.82 | 0.31 | 0.29 | 0.28 |
| L.M. Nelson et al 1988 | 191 (111) | 0.13 | 0.92 | 0.33 | Not available | Not available |
| Studies with reference relapse rate >0.5/yr | ||||||
| Frith and McLeod 1988 | 85 (50) | 0.30 | 0.66 | 0.39 | 0.53 | Not available |
| Birk et al 1990 | 8 (8) | 0.17 | 3.00 | 0.88 | Not available | Not available |
| Bernardi et al 1991 | 66 (52) | 0.10 | 0.97 | 0.32 | 0.65 | Not available |
| Roullet et al 1993 | 32 (NA) | 0.79 | 1.62 | 1.00 | 0.51 | 0.86 |
| Sadovnick et al 1994 | 58 (47) | 0.46 | 0.97 | 0.59 | 0.63 | 0.82 |
| Worthington et al 1994 | 14 (14) | 0.48 | 1.71 | 0.79 | 0.57 | 0.50 |
| Achiron et al 2004 | 39 (39) | 0.58 | 1.33 | 0.77 | 0.79 | Not available |
| De Sèze et al 2004 | 22 (22) | 0.22 | 2.00 | 0.66 | 0.61 | Not available |
| Total | 324 (NA) | 0.37 | 1.15 | 0.57 | 0.61 | 0.79 |
| PRIMS Study | ||||||
| Confavreux et al 1998b | 227 (227) | 0.42 | 1.22 | 0.62 | 0.72 | Not available |
‘Postpartum’ refers to the first trimester following delivery.
The pregnancy year includes the 9-month pregnancy and the 3-month postpartum periods.
Internal controls concern the same patients but during outside pregnancy periods.
External controls concern other patients with multiple sclerosis during outside pregnancy periods.
NA = not available.
In the six subsequent studies involving a total of 263 pregnancies, and in which the non-pregnancy period relapse rates were >0.50 per year – suggesting adequate retrospective assessment (Bernardi et al 1991; Birk et al 1990; Frith and McLeod 1988; Roullet et al 1993; Sadovnick et al 1994; Worthington et al 1994) – relapse rates outside pregnancy were between 0.51 and 0.65 per year; whereas this remained unchanged during pregnancy (0.35 per year), the rate increased during 3 months postpartum (1.05 per year). Across the entire pregnancy year, it was 0.52, much like that observed during periods not pregnant (Table 4.28).
Of these surveys, five allow a more detailed analysis of relapse rate during the separate trimesters of pregnancy and the puerperium (Bernardi et al 1991; Frith and McLeod 1988; Korn-Lubetzki et al 1984; Roullet et al 1993; Sadovnick et al 1994). Two reported an increased relapse rate in the third trimester of pregnancy (Frith and McLeod 1988; Roullet et al 1993 – this study also reported a significantly higher relapse rate during the pregnancy year in comparison with the control period). By contrast, three others (Bernardi et al 1991; Korn-Lubetzki et al 1984; Sadovnick et al 1994)) showed a reduction of relapse rate in the third trimester of pregnancy followed by an increase in the first trimester postpartum compared with the out-of-pregnancy period in the same patients. The increased risk period in the puerperium appeared to stop progressively after 3 months post-delivery. In five of the six reports that have addressed this issue, relapse rates for the 3–6-month postpartum period were no different from baseline rates in non-pregnant periods (Bernardi et al 1991; Frith and McLeod 1988; Roullet et al 1993; Sadovnick et al 1994); Worthington et al 1984); the one exception is the Israeli study, in which this rate remained elevated up to 6 months after delivery (Korn-Lubetzki et al 1984).
Another way to assess the influence of pregnancy on the relapse rate in multiple sclerosis is to analyse the inaugural episode in the relapsing–remitting form of the disease. This approach supports the provisional conclusions reached by more direct observations. Leibowitz et al (1967) found twice as many Israeli patients as controls who had become pregnant during the year preceding the onset of multiple sclerosis or, for controls, the same year of life. The reverse phenomenon was observed when pregnancy had started 12–24 months before the age at onset, suggesting that pregnancy may precipitate the onset of multiple sclerosis. In a study to which we have already referred, disease onset was in close proximity to the postpartum period in 36 of the 66 women whose 199 pregnancies were considered (Korn-Lubetzki et al 1984). A retrospective study of 512 women (S. Poser and Poser 1983) led to the conclusion that the risk of disease onset is increased 2–3 times during the 6 months following delivery compared with pregnancy. Other studies support this finding (L.M. Nelson et al 1988). In a prospective study of 63 women with multiple sclerosis from the United Kingdom (Villard-Mackintosh and Vessey 1993), there was no example of disease onset during pregnancy, whereas two women developed symptoms of multiple sclerosis during the first 6 months of the puerperium. The authors conclude that there is no detectable relationship between pregnancy and the onset of multiple sclerosis. More recently, none of 100 Swedish women reported disease onset during pregnancy and the first month following delivery, whereas nine cases were observed during the subsequent 8-month period (Runmarker and Andersen 1995). These authors conclude that the risk of multiple sclerosis developing during pregnancy is significantly reduced and not significantly different from non-pregnancy periods during the postpartum period. However, this study did not specifically examine the 3-month postpartum period, and an effect concentrated in this epoch may have been missed. Taken together, the literature does provide some evidence for an effect of pregnancy deferring the onset of multiple sclerosis into the puerperium.
These clinical data were corroborated by a serial MRI study of the brain using T2-weighted sequences during pregnancy and the postpartum period in two Dutch women (Van Walderveen et al 1994). Although new or enlarging lesions occurred frequently during the months prior to pregnancy, a clear reduction of the MRI disease activity was observed during pregnancy, and stopped altogether during the third trimester of pregnancy. Thereafter, both patients exhibited a return of MRI disease activity to pre-pregnancy levels in the postpartum period; but no clinical relapse occurred during the pregnancy or in the 6 months after delivery in either patient.
The PRIMS study clarified the possible influence of pregnancy and delivery on the clinical course of multiple sclerosis (Confavreux et al 1998b; Vukusic et al 2004). This was a European multicentre, prospective, observational study conducted through the EDMUS network (Confavreux et al 1992). The study was designed without an independent control group. In fact, the ideal controlled study would have been to recruit women with multiple sclerosis and, by random selection, encourage some to become pregnant, and others not, with each cohort followed prospectively over the next two to three years. This is clearly unrealistic. We have already addressed the issue of matched unrelated controls. In the PRIMS study, 269 pregnancies among 254 women were followed up until 24 months after delivery. The mean rate of relapse per woman per year was assessed throughout the study period. The pre-pregnancy rate, 0.7 ± 0.9 per year, decreased during pregnancy, notably in the third trimester, to 0.2 ± 1.0 per year – a two-third reduction. By contrast, the rate in the 3-month postpartum period was increased to 1.2 ± 2.0 per year. Thereafter, from the second trimester onwards and for the following 21 months, the annualized relapse rate fell slightly but did not differ significantly from that recorded in the pre-pregnancy year (Figure 4.31 ; Confavreux et al 1998b; Vukusic et al 2004). While the 3-month postpartum period clearly stood out as a high-risk period, only 28% of the cohort had a relapse during that time. Furthermore, the overall effect of pregnancy and the first 3 months of the puerperium (the pregnancy year) on relapse rate was neutral, and similar to the pre-pregnancy rate. The same changes in the frequency of relapses across pregnancy have been more recently observed in smaller and retrospective series (Achiron et al 2004b; De Sèze et al 2004; Salemi et al 2004).
Figure 4.31.

Mean annualized relapse rate during the year before pregnancy, the pregnancy and the 2 years after delivery, among 227 women with multiple sclerosis.
Adapted from Vukusic et al (2004).
© 2006
The PRIMS study was also an opportunity to analyse clinical factors that might predict the likelihood of a relapse in the 3 months after delivery (Vukusic et al 2004). Clinical predictors were assessed by logistic regression analysis: each relapse experienced during the pre-pregnancy year increased the risk of a postpartum episode by a factor of 1.7; each relapse during pregnancy increased the risk by a factor of 1.8; and patients who had a higher DSS at pregnancy onset were also more likely to have a postpartum relapse (odds ratio 1.3). By contrast, there was no relationship between the occurrence of a puerperial episode and age at onset with multiple sclerosis, age at pregnancy onset, disease duration, total number of relapses before pregnancy, number of previous pregnancies, child gender and (importantly) epidural analgesia or breast feeding. Multivariate models were also used to predict a postpartum relapse, and compared with the observed outcome. In the best multivariate model, only the number of relapses in the pre-pregnancy year, the number of relapses during pregnancy, and disease duration at pregnancy onset independently correlated with the occurrence of a postpartum relapse. When comparing the predicted and observed status, however, only 72% of the women were correctly classified by the mathematical model. Therefore, women with a greater disease activity in the year before and during pregnancy have a higher risk of relapse in the 3 months postpartum. However, this analysis does have its limitations, because there is currently no means of identifying in advance those women with multiple sclerosis who are more likely to relapse, in or out of pregnancy, for the specific purpose of designing therapeutic trials that aim to prevent subsequent disease activity (Vukusic et al 2004)).
It is worth pointing out that the decrease in relapse rate during pregnancy is more marked than the effect obtained with any of the licensed disease modifying drugs or oral immunosuppressants (see Chapter 18; Vukusic et al 2004)). Pregnancy must therefore be viewed as an informative ‘experiment of nature’. The protective effect on disease activity is also reproduced in the experimental autoimmune encephalomyelitis model in guinea pigs, rats and rabbits (Abramsky 1994; Evron et al 1984). One of the most intense biological features of pregnancy is the high placental and maternal production of sex hormones. Oestrogen and progesterone can suppress experimental autoimmune encephalomyelitis (Trooster 1993; 1994). Pregnancy is also characterized by major immunological changes that reverse with delivery. During pregnancy, there is a shift away from cell-mediated Th1 responses towards enhanced humoral immunity and a Th2 profile (Wegmann 1993). The fetal-placental unit secretes cytokines, such as interleukin-10 (IL-10), that downregulate the production of maternal factors mediating cellular immunity. Immunosuppression could explain maternal tolerance of the fetus. By contrast, delivery might be associated with an inversion of this cytokine balance – similar, in some respects, to the process of graft rejection (Wegmann et al 1993). This concept could explain why pregnancy is associated with a spontaneous remission, and the postpartum period with exacerbations in T-cell-mediated autoimmune diseases such as multiple sclerosis and rheumatoid arthritis (Hench 1938). Conversely, B-cell-mediated autoimmune diseases such as systemic lupus erythematosus tend to worsen during pregnancy (Tincani et al 1991). A better understanding of the biological mechanisms underlying these pregnancy-related changes in disease activity could usefully illuminate ideas on the pathogenesis and even suggest new treatment strategies.
Short-term disability
Assessing the impact of shifts in the frequency and distribution of new episodes on disability – dependent to some extent on the severity and degree of recovery from the individual relapse – is made difficult by the lack of validated or even widely accepted scales that are sensitive in the short term. The criteria for confirmed worsening of disability are likely to result in misclassification in about 50% of cases even when a minimum 6-month period is required for confirmation (C. Liu and Blumhardt 2000). Two studies have attempted to redress this limitation. Using a scale of doubtful validity, a United Kingdom-based study reported that relapses in the 6 months postpartum were significantly more severe than those occurring during pregnancy (Worthington et al 1994). A French group, using the Kurtzke EDSS, also reported more severe relapses in the postpartum period compared with pregnancy but without statistical analysis (Roullet et al 1993). In the PRIMS study, there was no evidence of variation in relapse severity between pregnancy and the puerperium, although no direct measures of relapse severity were included (C. Confavreux and S. Vukusic, unpublished data).
The systematic assessment of disability at given intervals during pregnancy and the postpartum period provides another approach, although the low sensitivity of a traditional outcome measure such as the EDSS scale is well known (see Chapter 6; Rudick 1995). Clinical deterioration is usually slow in multiple sclerosis and spans several decades. The first study to tackle the issue of how DSS scores evolve in relation to pregnancy was limited to eight patients. Disability increased systematically from EDSS 2.4 at week 21 of pregnancy to 3.4 at month 6 after delivery (Birk et al 1990). The PRIMS study addressed the issue on a much larger scale. The analysis of mean residual DSS showed an increase from 1.1 at 1 year before pregnancy to 2.0 at 24 months post-delivery (Figure 4.32 ; Vukusic et al 2004)). The global mean worsening for this 45-month period reached +0.9 DSS points. This is within the expected range of what is known from the natural history of multiple sclerosis in comparable minimally disabled women (Confavreux et al 2000); Weinshenker 1989a). Although such observations should be interpreted with caution, because the Kurtzke DSS is categorical and not quantitative, the mean disability worsening seemed not to occur in steps but was gradual throughout the study period. Despite marked changes in the frequency of relapses observed during pregnancy and the puerperium, accumulation of confirmed disability still evolved without an apparent relationship to these events.
Figure 4.32.

Mean confirmed disability, according to DSS, during the year before pregnancy, the pregnancy and the 2 years after delivery, among 227 women with multiple sclerosis.
Adapted from Vukusic et al (2004).
© 2006
Influence of pregnancy on long-term disability
The impact of pregnancy on the long-term residual disability in multiple sclerosis has been addressed in a number of retrospective or cohort studies. An early observation was that women experiencing the onset of multiple sclerosis after their first conception tended to become more disabled in the long term than those who have not been pregnant (Schapira et al 1966). However, the difference is apparent only during the first 10 years of the disease course, and far from reaching statistical significance. Italian researchers found no difference in the distribution of patients according to DSS scores when comparing women with children with those without, after stratification for disease duration (Ghezzi and Caputo 1981). In their study of 72 women with multiple sclerosis having a mean follow-up ≥10 years, S. Poser and Poser (1983) used a progression index (DSS score divided by disease duration) as a measure of prognosis. They found no significant difference in severity between the four groups of patients (all pregnancies before onset; all pregnancies after onset; pregnancies before and after onset; or never pregnant). Similarly, in another survey of 178 women with multiple sclerosis and mean disease duration longer than a decade, no difference was found in the mean DSS score following stratification according to the number of children and adjustment to age at onset and duration of multiple sclerosis (D.S. Thompson et al 1986). Long-term disability was similar whether multiple sclerosis started before or after pregnancy. It was significantly lower for women with disease onset during pregnancy but this group contained only ten patients. In a large retrospective population-based Canadian survey of 185 women with multiple sclerosis and a mean disease duration of 15 years, no association could be found between long-term disability and either onset or worsening of the disease during pregnancy and the postpartum (Weinshenker et al 1989c). These authors were unable to find any influence on the timing of pregnancies relative to the date of onset, or the total number of full-term pregnancies. Later, a French study involving 32 women with mean disease duration of 10.5 years and full-term pregnancies concluded that pregnancy did not lead to increased disability by comparison with controls (Roullet et al 1993). No significant change in the mean EDSS score, measured during the first trimester of pregnancy and 3 years after delivery, was observed in 15 women with multiple sclerosis and full-term pregnancies by Worthington et al (1994); they found that the evolution of disability was similar in this group of pregnant patients and nulliparous women who acted as controls.
Two studies have concluded that pregnancy has a beneficial effect on the long-term prognosis in multiple sclerosis (Runmarker and Andersen 1995; Verdru et al 1994). Time from disease onset to wheelchair dependence, in the Belgian study involving 200 participants, was 18.6 years for the 40 women with ≥1 pregnancy, and 12.5 years for the 160 women with no pregnancy after the onset of multiple sclerosis (Verdru et al 1994). This statistically significant difference persisted after correction for age at onset. But these results must be regarded with caution because the study was restricted to a highly selected population of wheelchair-bound women for whom the dates of onset with multiple sclerosis, pregnancies and wheelchair dependency were all known. Furthermore, the mean age at onset was 11 years younger in the group of women with ≥1 pregnancy than in the group without pregnancy after the onset of multiple sclerosis. In this respect, results of the Swedish and Belgian studies are similar (Runmarker and Andersen 1995; Verdru et al 1994). However, the Swedish study was restricted to women with no pregnancy before the onset of multiple sclerosis, and to those with an obvious relapsing–remitting course. Several arbitrary rules were established before making up the matching groups, and these procedures may have introduced confounding effects. Furthermore, the results only reached statistical significance for the lower risk of entering the progressive course in women with a first pregnancy after onset compared with nulliparous individuals. A similar trend was noted regarding the risk of reaching grade 6 on the DSS scale, but this did not reach statistical significance. As acknowledged by the authors, one may wonder if such results are not the result of an interaction bias whereby less disabled and progression-free patients are better motivated to embark on a pregnancy.
Therefore, the current consensus remains that there is no evidence for a significant effect, beneficial or deleterious, of pregnancy on short- and long-term disability in multiple sclerosis. This is somewhat surprising, considering the dramatic increase in the relapse rate during the puerperium. But it must be kept in mind that, overall, relapse rate during the pregnancy year is not different from that observed during the year before pregnancy. Thus, the increased relapse rate in the first trimester postpartum is compensated by reduced clinical activity during the third trimester of pregnancy. We have already discussed the weak correlations between relapse rate and long-term disability in other contexts (Confavreux et al 2003).
Influence of epidural analgesia and breast feeding
In a partly interventional study, women with multiple sclerosis breast fed their children less often during the disease (53%) than before developing symptoms (85%), following professional advice given to half of the patients that there was no evidence for breast feeding being harmful (S. Poser and Poser 1983). The first formal study addressing the risk of relapse related to breast feeding was conducted from a structured interview of 111 women with multiple sclerosis experiencing a total of 191 pregnancies (L.M. Nelson et al 1988). Women were noticed to have breast fed their child in 50% of instances – a rate considered comparable to that adopted generally in the United States. The postpartum relapse rate was found to be slightly higher in women who breast fed than those who did not. The mean time to exacerbation was similar in both groups. Amongst 15 women with multiple sclerosis, 3/8 who breast fed their infant and 3/7 who did not, suffered a postpartum relapse (Worthington et al 1994). Obstetricians and anaesthetists have long been reluctant to prescribe epidural analgesia to women with multiple sclerosis. Anecdotal reports and small series allowed the provisional conclusion that this technique could be associated with a relapse (McArthur and Young 1986; see below).
Against this background, the PRIMS study directly addressed the possible influence of epidural analgesia and breast feeding in multiple sclerosis in a formal and prospective way, although the study was not primarily designed to assess these risks (Confavreux et al 1998b). The results were unambiguous: epidural analgesia and breast feeding do not increase the risk of relapse or the level of disability in the postpartum period (Figures 4.33 and 4.34 ). In this respect, it is important to correct an apparent misreading of the results: women who chose to breast feed experienced less relapses and had milder disability scores in the years both before and during pregnancy, by comparison with women who chose not to breast feed. In the editorial accompanying the original report, it was suggested that ‘the finding … that breast feeding had a beneficial effect by reducing relapses during the course of the study is unexpected’ (Whitaker 1998). Nor was it observed. The interpretation of the data on breast feeding by the PRIMS study group is that patients with multiple sclerosis who chose to breast feed had a milder form of the illness from the outset – 12 months before conception – and patients with more active disease decided not to breast feed. It cannot be concluded from the PRIMS data that breast feeding has a protective effect per se on disease activity in the postpartum period. We should recall that when the PRIMS data have been used to analyse, by logistic regression analysis and in a multivariate analysis, clinical factors that might predict the likelihood of a relapse in the 3 months after delivery, neither epidural analgesia nor breast feeding proved influential (Vukusic et al 2004)). A more recent study from Israel also did not find deleterious effects of epidural analgesia and breast feeding in multiple sclerosis (Achiron et al 2004b).
Figure 4.33.

(A) Mean annualized relapse rate. (B) Mean confirmed DSS during the year before pregnancy, the pregnancy and the 2 years after delivery depending on epidural analgesia, among 227 women with multiple sclerosis. Epidural analgesia: red line and filled circles. No epidural analgesia: blue line and filled squares.
Adapted from Confavreux et al (1998b).
© 2006
Figure 4.34.

(A) Mean annualized relapse rate. (B) Mean confirmed DSS during the year before pregnancy, the pregnancy and the 2 years after delivery depending on breast feeding, among 227 women with multiple sclerosis. Breast feeding: red line and filled circles. No breast-feeding: blue line and filled squares.
Adapted from Confavreux et al (1998b).
© 2006
Influence of multiple sclerosis on pregnancy, labour, delivery and infant health
Apart from advanced cases of multiple sclerosis with a severe motor deficit, the disease does not appear to influence the course and duration of pregnancy, obstetric labour or delivery. The same conclusion applies to the infant in terms of fetal risk of abortion or stillbirth, weight at birth, birth defects, sex ratio, and frequency of twinning (Abramsky 1994; Achiron et al 2004b; Birk and Rudick 1986; Confavreux et al 1998b; Leibowitz et al 1967; McArthur and Young 1986; S. Poser and Poser 1983; S. Poser et al 1979a; Roullet et al 1993; Sadovnick et al 1994); Worthington et al 1994).
Pregnancy and multiple sclerosis: a summary
Our position is that there is no medical reason to discourage a woman with multiple sclerosis from contemplating childbirth. Pregnancy is associated with a highly significant decrease in relapse activity and only one-third of women will suffer a relapse during the whole pregnancy period. Conversely, the postpartum is associated with a transient significant increase in disease activity. However, here too, no more than one-third of women will suffer from a relapse during the first 3 months after delivery. Thereafter, the frequency of relapse returns to its pre-pregnancy level. No reliable algorithm is yet available for predicting which patient will experience a relapse postpartum. Although pregnancy and delivery are associated with changes in relapse rate, they do not affect residual disability in the mid and long term. Breast feeding and epidural analgesia have no adverse effect on the disease. Lastly, multiple sclerosis does not itself influence pregnancy, delivery or infant health. Eventually, the decision to contemplate childbearing is most likely to hinge on perceptions of present and future disability, impairment and participation. These are not so easy to predict.
Psychological stress
The possibility that psychological stress may trigger the onset or subsequent activity in multiple sclerosis, first proposed by Charcot (1877), has since been repeatedly proposed (McAlpine 1946). Many patients and physicians are convinced by the putative link. Adding biological plausibility to any evidence for association – if it exists – has generally circled around the concept of neuro-endocrine-immune networks involving connectivity between the hypothalamic-pituitary axis and cytokine production. To us, the link between stressors and molecules that orchestrate and alter immunological behaviour seems easy to state but hard to prove using reasonably rigorous scientific criteria. Of course, psychological stress could alter the blood–brain barrier, vary the Th1/Th2 cytokine balance, increase T-cell activation against brain proteins, or adjust the hypothalamic-pituitary axis; but all of the supporting data are fragmentary and preliminary (for review see J. Li et al 2004a; Mohr et al 2004). Furthermore, as discussed in a recent review, the current evidence for an association between psychological stress and activation of multiple sclerosis, at the observational level, is not compelling and the results are often contradictory across different studies (Goodin et al 2000). One explanation is that the size effect of any association is small; another that the definition of a stressful event is particularly difficult; and a third, that – judged critically – no relationship exists. The content and personal impact of stressful events cannot easily be standardized, varying (as they do) in origin (e.g. domestic or professional), intensity, duration, frequency and direction of effect (negative or positive). Even this list is not exhaustive. Studies on such ephemeral matters are notoriously prone to recall bias, as the patients, their relatives and physicians naturally tend to relate coincidental adverse life events to changes in the personal experience of multiple sclerosis.
Psychological stress and onset
For reasons that are easy to understand, the question of the possible influence of psychological stress on the onset of multiple sclerosis has been addressed through retrospective studies using a case–control design. The original studies did not find any statistically significant difference in the experience of stress between patients with multiple sclerosis and controls (Antonovsky et al 1968; Pratt 1951). Subsequently, positive associations have been claimed. S. Warren et al (1982) compared 100 patients with multiple sclerosis with 100 hospital controls matched for demographic variables, psychological stress prior to the onset of multiple sclerosis, and controls of the corresponding age. The two groups did not differ with respect to the happiness of their childhood environment, premorbid ways of coping with life events, or tendency to seek professional help in order to solve an emotional problem. However, patients with multiple sclerosis reported that they were under unusual stress in the 2-year period prior to disease onset more often than controls (79% vs. 54%; p < 0.001). They also experienced three times more stressful life events than controls during this 2-year period. Interview was conducted several years after the clinical onset of multiple sclerosis, and based on information obtained using a questionnaire.
In another study, 39 patients with multiple sclerosis and 40 healthy controls completed a validated, structured interview on stressful experiences (I. Grant et al 1989). Patients and controls were matched for sex, age, marital status and socioeconomic position; the study was not blinded. Affected individuals were questioned on stressful experiences over the year preceding the first neurological episode (which had ocurred 2 years earlier on average, with a range of 1–54 months) whereas controls provided information on the year before interview. A greater proportion of patients with multiple sclerosis experienced marked stressful events prior to clinical onset than controls during the year before interview (77% vs. 35%; p < 0.001); the difference was even more noticeable for the 6 months before onset. Less stressful events did not discriminate the groups. A strength of this study was the use of a comprehensive, well-validated, standardized and structured interview; but focusing the interview on a 1-year period represents a limitation. As the authors point out, recall bias increases with interval from life events to retrospective interview. But the effect of this bias may be compensated or even reversed by the ‘effort after meaning’: for us this is a clumsy phrase seeking to encapsulate the need for individuals who suffer an unfortunate event, such as the appearance of multiple sclerosis, consciously or unconsciously to identify a tangible precipitating trigger and assume a causal relationship; bias is introduced because the patients are more likely than controls to highlight an intercurrent event following such an adverse experience as the clinical onset of multiple sclerosis.
The death of a child must be one of the most stressful experiences imaginable for parents in industrialized countries where infant mortality is low. A nationwide and population-based Danish study examined the possible association between this event and onset of clinical multiple sclerosis (J. Li et al 2004a). All 21062 parents who lost a child at age ≤18 years between 1980 and 1996 in Denmark were included in the exposed cohort studied ≤17 years after bereavement. Each was then matched to 15 other parents who had never lost a child, leading to an unexposed cohort of 293745 parents. The matching process was based on the family composition at the time of the child's death. The two cohorts were followed for the incidence of multiple sclerosis from 1980 to 1997. Hazard ratios (HR) with 95% confidence intervals were calculated as the measure of association between the exposure and onset of multiple sclerosis, using the Cox proportional hazards regression models. Two hundred and fifty-eight patients with multiple sclerosis were identified, 28 in the exposed cohort and 230 unexposed. Overall, the exposed parents had an increased risk of multiple sclerosis (HR = 1.56; 95% CI, 1.05–2.31). However, the risk remained significant only when the death of the child was unexpected (HR = 2.13, 95% CI 1.13–4.03 for unexpected death vs. 1.33, 95% CI 0.81–2.16 for other deaths), and when follow-up after the child's death lasted >8 years (HR = 1.37, 95% CI 0.78–2.49 for 1–7 years of follow-up vs. 2.25, 95% CI 1.32–3.81 for 8–17 years’ follow-up). The strengths of this study are evident: the national system of registries in Denmark allowed for a complete ascertainment of deceased children and for a near complete ascertainment of people with multiple sclerosis over the study period; the focus was on a single well-identified stressor; classifications of exposed and nonexposed parents were unambiguous; diagnostic accuracy and the dating of clinical onset were systematically and appropriately checked in the register; follow-up was complete; data on the exposure and the outcome were collected independently of the research hypothesis; and the sample size was large. But there are nonetheless possible limitations to the study. First, when the study was confined to the 211/258 patients with definite or probable multiple sclerosis, the results were no longer significant (HR = 1.42; 95% CI 0.90–2.24). Furthermore, as the authors recognize, no information was available on lifestyle and occupational factors, physical trauma, infections and family history. It may be hypothesized that, for instance, in subjects with a family history of multiple sclerosis, unaffected family members are disadvantaged by the domestic circumstances (N. Murphy et al 1998), leaving children more exposed to events associated with early death, such as trauma, while the parents are more susceptible to develop multiple sclerosis.
Relapse of multiple sclerosis
Only the prospective studies will be considered because the recall bias of retrospective studies cannot easily be reconciled. In the first study, 55 patients with multiple sclerosis were prospectively followed at 4-month intervals for an average of 20 months until a relapse occurred (G.M. Franklin et al 1988). At each visit, a standardized structured interview was performed that was sensitive for stressful life events. The 25 patients experiencing a relapse during the study period were compared to 30 who did not; these served as controls. Overall, patients who relapsed did not experience significantly more stressful life events during the 6-month period before that episode than controls (20.2 vs. 17.2). Extreme stressful life events were marginally more frequent in the patients than controls (p < 0.05). This study is therefore essentially negative with respect to the association between stress and relapse in multiple sclerosis. The prospective design raises its status, as does the collection of data on stress events in advance of possible subsequent relapses.
In a more recent study, 95 pairs of patients with multiple sclerosis, in each of which one was in relapse and the other in remission, were interviewed using a standardized structured questionnaire screening for emotional stressful events (S. Warren et al 1991b). These were more frequent in the 3-month period preceding relapse than in the interval of similar duration prior to interview for patients in remission (57% vs. 28%; p < 0.001). In an Italian study, adopting a rather similar design (Gasperini et al 1995), 89 consecutive patients with relapsing–remitting multiple sclerosis examined in the clinic during a relapse were matched to a patient seen during remission. In the group of patients in relapse in comparison with those in remission, exposure was less frequent – infection, physical trauma, physical overexertion, vaccination and anaesthesia – apart from stressful life events (25% in the relapse group compared with 13% in remission). However, no result was significant, in either direction, but the frequency of exposure was so low for physical trauma, physical overexertion, vaccinations and anaesthesia, as to limit useful conclusions being drawn from this study.
An opportunistic study was carried out in Israel during the first Gulf War (1991) when the Israeli population felt the threat of exposure to missile attacks from Iraq (Nisipeanu and Korczyn 1993). The authors prospectively evaluated a group of 32 patients with relapsing–remitting multiple sclerosis during the screening phase of a therapeutic trial. They found that the number of relapses during the two months of the war and over a comparable period thereafter was significantly lower than expected, based on frequency during the preceding two years, suggesting that not all stress conditions increase the risk of relapses in multiple sclerosis. However, it must be acknowledged that these results could be explained, at least partially, by regression to the mean; typically, this is observed following inclusion of patients in a trial after selection based on a necessary high frequency of a defining entry criterion.
In another study, 23 women with relapsing–remitting multiple sclerosis were followed prospectively for one year (Ackerman et al 2002). They were asked to complete a checklist for stressful events on a weekly basis. A similar procedure was followed for relapses and these were validated thereafter at 4-week intervals by a neurologist blinded to the presence and timing of stressors. During the one-year study period, the patients experienced an average of nine life events (i.e. one every 6 weeks) and 2.6 relapses (one every 21 weeks). Therefore, as many as 49% of stressful life events were associated with a relapse in the subsequent 6 weeks, and 85% of the relapses were preceded by one or more life events in the preceding 6 weeks. The authors were able to demonstrate that a control date selected at random and defined by the absence of relapse in the preceding 6 weeks was associated with a life event during this time window in only 36% of cases. Furthermore, they discovered a ‘dose-effect’: the higher the rate of life events in a given period, the higher the risk of subsequently developing a relapse. In a subsequent paper, the same authors reported that the risk of stress-related relapses was associated with enhanced cardiovascular reactivity to acute stress and a higher baseline heart rate (Ackerman et al 2003).
Recently, Dutch authors have enrolled 73 patients with relapsing–remitting multiple sclerosis in a prospective survey with systematic clinical assessments at 8-week intervals. The main objective was to assess the possible association between infections and relapses attributable to multiple sclerosis (see below; Buljevac et al 2002). As a secondary objective, the association between self-reported stressful life events not related to multiple sclerosis and relapses was also explored (Buljevac et al 2003b). During the study period, patients were asked to report in a logbook diary any experience of an emotionally stressful event in the preceding week. Diaries were validated at visits to the clinic. Stressful events directly attributable to multiple sclerosis itself were discarded from the analysis. During the 1.4-year period of follow-up, 70/73 patients (96%) reported ≥1 stressful event, and a total of 457 stressful life events were reported that were unrelated to multiple sclerosis. Overall, 134 relapses occurred in 56 patients, an average of 1.3 per year. Following each stressful event, the risk period for a relapse was set at 4 weeks. Cox regression analysis with time-dependent variables showed that stress was associated with a doubling of the relapse rate (relative risk 2.2; 95% CI 1.2–4.0; p = 0.014) during the subsequent 4 weeks. Infections were associated with a threefold increase in the risk of exacerbation, but this effect was found to be independent of experienced stress. Taken together, the results of these studies are not easy to reconcile, perhaps because of differences in the protocols.
It is only recently that the first prospective longitudinal study of the relationship between psychological stress and disease activity has been assessed using brain MRI (Mohr et al 2000). A total of 36 patients with relapsing multiple sclerosis and ≥1 gadolinium enhancing lesion appearing during the first 24 weeks of enrolment were included. They were evaluated with brain MRI and standardized neurological examination at 4-week intervals for a period of 6–24 months. Disease activity was defined by the presence of ≥1 new gadolinium enhancing lesion not visible on the previous scan. Standardized measures of psychological stress were administered by telephone interview 24 hours before each monthly MRI. Reports were categorized as: major negative events (such as the death of a close family member); conflict and disruption in professional or domestic routine; daily hassles (common events that are irritating or mildly stressful); psychological distress; and positive events (such as an outstanding personal achievement). Stress predictors for the presence or absence of MRI activity on serial scans were analysed by logistic regression analysis for four at-risk intervals: no lag, and 4-, 8- and 12-week intervals after the stressful event. For the entire group of 36 patients, only conflict and disruption in routine correlated with the appearance of new gadolinium enhancing lesions at 8 weeks after the event (OR 1.64; 95% CI 1.22–2.20; p < 0.001). Analyses performed on the subgroup of 17 patients with relapsing–remitting multiple sclerosis generated the same result: conflict and disruption in routine correlated with MRI activity 8 weeks later (OR 1.48; 95% CI 1.03–2.15; p = 0.03). By contrast, among the subgroup of 19 patients with secondary progressive multiple sclerosis, associations involving conflict and disruption in routine were positive at each time point: odds ratios varied between 1.75 and 1.96 but, given the small sample size, showed confidence intervals ranging – for different analyses – from 1.00 to 3.55 for their lower and upper limits, respectively. An association was also found for daily hassles and MRI activity at the week 12 interval (OR 2.16; 95% CI 1.23–3.77; p = 0.006). But there were no significant correlations between stress and clinical relapses of multiple sclerosis for the entire cohort, or the subgroups with relapsing–remitting and secondary progressive multiple sclerosis.
We take these data to indicate that stress is not associated with disease activity in multiple sclerosis. The ascertainment of stressful events, their categorization as exerting positive or negative influences on the individual, and the assessment of intensity were meticulous and made at close intervals. MRI analyses were blind with respect to the clinical events. However, although we find it hard to provide biological plausibility for such a differential effect, the study does suggest an effect of stress depending on clinical course of the disease. Results confined to the subgroup of secondary progressive patients in this study should be treated with caution. These patients were taking part in a placebo-controlled clinical trial of IFN-β1b. The randomization of patients was not known at the time, perhaps leading to a conservative estimation for the association between stressful events and MRI activity due to the inhibitory effect of interferon treatment in multiple sclerosis. However, among the 30 patients with secondary progressive multiple sclerosis eligible for the study, 11 were excluded through not having developed a new gadolinium enhancing lesion on monthly MRI scans during the first six months of potential enrolment. Because these factors might have introduced bias affecting the outcome measure in a direction that cannot easily be predicted, we place more confidence in results for the relapsing–remitting than the secondary progressive group. Indeed, considering the subgroup of 17 patients with relapsing–remitting multiple sclerosis, all took part in a prospective natural history study, and the results regarding a possible association between stressful events and MRI activity were essentially negative.
Meta-analysis
Following a well-described selection process, 14 studies addressing the issue of the association between stressful life events and onset or relapse of multiple sclerosis – most discussed above – have been included in a quantitative meta-analysis (Mohr et al 2004), necessarily using a clinical outcome because too few studies have assessed MRI activity as the dependent variable. Of the 14 surveys, 7 were case–control and 7 longitudinal prospective studies. Two examined the onset episode, and 12 dealt with relapses of multiple sclerosis. This meta-analysis led the authors to conclude that stress and clinical activity are significantly associated, with a high degree of consistency between individual studies – whatever the design, methods or sample characteristics. They acknowledged that the size effect, although statistically significant, was modest and results not consistent between groups or individual patients over time. However, the effect was considered clinically meaningful and superior, for instance, to that recently identified in a meta-analysis of efficacy for IFN-β used as a disease modifying drug to reduce relapse frequency in multiple sclerosis (see Chapter 18; Filippini et al 2003a). However, the inherent limitation of meta-analysis is the pooling of data having uneven quality. For instance, for 40% of the subjects included by Mohr et al (2004), the stress measure was obtained through an unvalidated questionnaire or interview. In many studies, data on the exposure (stress) and the outcome (onset or relapse of multiple sclerosis) were not collected independently. Not surprisingly in these studies, association between stress and activity in multiple sclerosis has always been found (Gasperini et al 1995; I. Grant et al 1989; S. Warren et al 1982; 1991b). Overall consistency of results does not necessarily ensure accuracy because the same biases will tend to reproduce the same biased, and hence erroneous, results.
Stress and multiple sclerosis: summary
Taken together, our position is that the most persuasive evidence is provided by anecdotal cases or retrospective studies but each is vulnerable to recall bias, especially in the context of disease activity in a chronic debilitating disease, known to be intermittently active as part of its natural history. Conversely, the more rigorous and reliable prospective studies, notably those using an objective outcome measure such as MRI enhancement, provide no compelling data. Some studies suggest that only the more modest stressors – such as conflict, disruption in daily routine or minor hassles – act as activators of multiple sclerosis (Mohr et al 2000). Reaching a measured position on interpretation is not made easy by the strikingly discordant results obtained in studies using the same methodology. At one extreme, the threat of missile attack in Tel Aviv during the first Gulf War was found to reduce the risk of relapse (Nisipeanu and Korczyn 1993), and bereavement had no significant influence on MRI and clinical activity (Mohr et al 2000). Conversely, others have claimed that losing a child increased the later risk of developing multiple sclerosis (J. Li et al 2004a); yet, specificity is undermined by the additional observation that this stressful event was also associated with an increased risk of myocardial infarction, cancer and overall mortality but not stroke or an autoimmune disease such as inflammatory bowel disease (J. Li et al 2004a; 2004b).
Despite consistent and confident statements in the literature that psychological stress and disease activity in multiple sclerosis are linked, a more critical reading suggests that the association is, at best, weak and with a modest effect size.
Physical trauma
The Association of Research into Nervous and Mental Diseases (Barker 1922) reached the following conclusion on the relationship between trauma and multiple sclerosis:
In a small percentage of cases [multiple sclerosis] appears to be excited by trauma, but trauma cannot itself cause it, but may apparently awaken a disease process already potentially existent.
Three lines of evidence are used to inform the debate on whether trauma can trigger clinical manifestations of multiple sclerosis in someone who has the disease process, or alter the course in individuals who have already experienced symptoms. These are the anecdotal experience of individual neurologists, epidemiological observations, and experiments addressing a mechanistic hypothesis.
It is logical to start by assessing the probability of coincidence, that is, estimating how often accidental injury and the onset of multiple sclerosis, a further manifestation of pre-existing disease, or a change in clinical course would be expected to occur together by chance. If the independent rates of the two events are known, it is a simple step to estimate the chance that they will occur together within a given interval. The suggestion has been made that, in this context, the critical period is 3 months. An issue arises with respect to the location and severity of trauma considered as a potential trigger for multiple sclerosis. Most medico-legal attention, and such scientific evidence as can be brought to bear on the subject, relates to the spine in general and the cervical cord in particular. Surveys completed at the beginning and end of the 1980s indicate that the annual frequency of head injury in adults living in the United Kingdom is 1:50 (Jennett 1996). Although not every injury will be of a type considered potentially relevant in the context of multiple sclerosis, the proportion in any 3-month period is 1:200 or 0.005%. Substituting the figure of 1:90 for spinal cord injury (Anon. 1995), the proportion at risk is 1:360 or 0.003% of the population for each 3-month period.
The next step is to estimate the number of individuals developing clinical manifestations of multiple sclerosis, and those experiencing new relapses or a change in clinical course over any 3-month period. Based on morbidity statistics and the natural history of multiple sclerosis (see above and Chapter 2), annual incidence rates for the United Kingdom vary between 5 and 10/105 depending on location. Simply stated, and taking the lower estimate, this means that at least 625 individuals in a population of 50 million (roughly the population of the United Kingdom) will first develop clinical manifestations of multiple sclerosis in each 3-month period. The annual relapse rate is about 0.5 for all patients, although higher for those (around 40%) in the relapsing–remitting phase. The number of individuals experiencing a new episode every 3 months amongst the 80 000 prevalent patients (of the United Kingdom) is therefore at least 4000. The annual conversion rate from relapsing–remitting to progressive disease and the loss of independent walking is around 2%, or 1200 individuals.
Assuming that these patients have the same risk of injury as the unaffected population, and that the age-specific breakdown for each event is roughly aligned (i.e. the decades when the incidence of multiple sclerosis peaks – the 20s and 30s – are also those in which injuries are most prevalent), it follows that:
-
•
The number of newly affected individuals also reporting an accident causing neck injury in any 3-month period is 0.003 × 625 = 1.8, i.e. 1–2 every 3 months or 4–8 in any one year.
-
•
The number of individuals with established multiple sclerosis experiencing a new episode within 3 months of a relevant accident is 0.003 × 4000 = 12 every 3 months or 48 in any one year.
-
•
The number of individuals with established multiple sclerosis converting from the relapsing–remitting to the progressive phase within 3 months of a relevant accident is 0.003 × 1200 = 3.6, i.e. 3–4 every 3 months or 12–16 in any one year.
Epidemiological studies of trauma and multiple sclerosis
The next step is to assess whether what actually happens deviates from this expectation. This is where the epidemiological studies are relevant. The existing studies have their strengths and weaknesses but, taken together (and with the possible exception of electric shock, discussed in more detail below), they do not show an association between disease activity in periods when individuals known to have multiple sclerosis, or first developing clinical manifestations of the disease, are at risk after trauma. Therefore, the epidemiological studies provide no evidence in support of the hypothesis that a causal relationship exists between trauma and multiple sclerosis, and are consistent with the alternative explanation that the temporal coincidence is due to chance. So what is the evidence?
McAlpine (1946) described trauma within a month preceding the onset of multiple sclerosis in 8/142 patients studied between 1937 and 1946 (work that he acknowledged was disrupted by the war), concluding that the number studied was:
too small to be of statistical value … A further study is called for since they would seem to indicate the possibility of abnormal reflex or sympathetic activity in the cord in response to peripheral trauma.
McAlpine's conclusion was that the main aetiological factor in multiple sclerosis is virus infection. The same emphasis on an infective aetiology was reached by D.K. Adams et al (1950), who also described accidental or surgical trauma in 41/389 individuals and a history of trauma preceding an exacerbation ‘in a considerable number of cases’. Their method of case retrieval was not described and the report lacked controls or statistical analysis.
McAlpine and Compston (1952) reported that 36/250 (14%) patients with multiple sclerosis described episodes of trauma (excluding surgical but including dental) in the 3 months prior to onset of their first symptom. In 22/36, there was a correlation between the site traumatized and the subsequent localization of neurological symptoms. Thirteen of 250 (5.2%) control patients interviewed in a hospital ward had a comparable history. Twenty-nine of 58 patients suffering a total of 80 traumatic episodes during the course of the illness experienced a new episode within 3 months of the traumatic event. The relapse rate in the 3 months following these 80 episodes was 0.43 compared with 0.39/year (i.e. >4 times higher) in 393 unselected patients with multiple sclerosis. McAlpine et al (1955) later concluded that:
from this evidence there would appear to be little doubt that trauma to a limb or any part of the body, slight or severe, including operation, may occasionally precipitate the disease in a predisposed person or may cause a relapse. This view gains support from the fact that in a significant proportion of cases with a history of trauma shortly before the onset, the site of the trauma would appear to play a part in determining the localisation of the initial symptoms.
By 1965, McAlpine had qualified but did not reject these conclusions on the grounds that the results lacked statistical proof (McAlpine et al 1965). The design did not fully weight incidents that were not followed by new symptoms or consider the severity of trauma; and the possibility existed of recall bias in a retrospective survey of events occurring at the time of disease activity by comparison with those that were not. Understandably, the McAlpine and Compston (1952) series is often used in support of the claim that trauma triggers the clinical expression of multiple sclerosis. However, a number of retrospective but controlled studies carried out since the early 1950s have shown no association between trauma and the onset of multiple sclerosis. Some leave open the question of an effect on clinical course of the disease in those with pre-existing manifestations.
Bamford et al (1981) failed to show a relationship between trauma and onset of multiple sclerosis in their retrospective case series. This was followed by a more systematic study of trauma and disease activity in 170 patients studied prospectively by questionnaire (monthly) and physical examination (3-monthly) for 8 years (Sibley et al 1991). Defining either the 3- or 6-month period following each event as at-risk, only electrical trauma showed an association with new episodes (defined as the occurrence of new manifestations lasting >48 hours, in the absence of fever, or an exacerbation of old symptoms if there was a change in neurological examination). All other forms of trauma were negatively correlated both with clinical exacerbations and disease progression. Although not a prospective study of multiple sclerosis first manifesting in individuals who have experienced trauma but of new events or later progress in those with pre-existing disease, the distinction between a first and later episode is not of biological importance. The initial analysis used one-tailed and paired t tests; the final analysis quoted p values based on chi-squared statistics. The power of the study was not given but can be estimated by calculation of relative risks. These are:
-
•
all forms of trauma, 1.1 (95% CI 0.8–1.4)
-
•
head injury, 1.08 (95% CI 0.54–2.14)
-
•
electrical injury at 3 months, 3.4 (95% CI 1.2–10)
-
•
electrical injury at 6 months, 2.2 (95% CI 0.8–5.8).
Siva et al (1993; see also Kurland 1994) identified trauma in the year preceding onset in 3/223 incident patients from the Mayo Clinic series. This seems a low number but cannot be interpreted in the absence of controls, as pointed out by numerous correspondents to the journal where the report was published. However, the Mayo series of around 3587 persons with head trauma studied prospectively contains 819 within the age range at risk of developing multiple sclerosis of whom two did develop the disease, after intervals of 3 and 15 years, respectively. Five of 942 undergoing cervical or lumbar disc surgery had multiple sclerosis but, in 4, symptoms of the disease had developed 4–15 years before surgery. Disease exacerbations occurred no more frequently in the 6 months after than the 6 months before limb fracture. First, a retrospective analysis was made of disease activity in 122 individuals prevalent in Olmsted county on 1st December 1991 together with 42 comparable patients (i.e. 164 in total) taking a 6-month period at risk. Next, retrospective analyses were made of prospectively gathered health records held at the Mayo Clinic matching 225 individuals incident for multiple sclerosis in Olmsted county between 1905 and 1991 with 819 individuals with head injury between 1935 and 1984 and 942 who underwent lumbar disc surgery between 1950 and 1979. Siva et al (1993) combined three studies, and Sunku and Kurland (1994) added 561 seen with cervical radiculopathy between 1976 and 1990 but showed no association with multiple sclerosis – with or without surgery to the cervical spine.
Whilst these surveys approximate to the ideal, in that they look prospectively at the number of individuals showing clinical manifestations of multiple sclerosis in a population-based sample considered at risk through having experienced the putatively provocative event (trauma), they inevitably contain very few individuals with multiple sclerosis in the prospective series. Their power is further diminished by the low number of injuries because the definition required head injury with physical signs, concussion, post-traumatic amnesia or skull fracture and hence excluded many examples of trauma not resulting in bone injuries and confined to soft tissue injury. Wilcoxon sign and rank sum tests were used to analyse these data but recalculation of relative risks with confidence intervals confirms that none of the results is statistically significant. That said, the studies have relatively low power to show an effect.
Two additional contemporary studies are either small or methodologically open to criticism. Neither provides evidence supporting a relationship between trauma and manifestations of multiple sclerosis (Alter and Speer 1968; Gusev et al 1996). Discussion of the article by Chaudhuri and Behan (2001) describing a series of cases identified through personal referral might be considered not to belong in an analysis of epidemiological studies dealing with the relationship between trauma and multiple sclerosis. The authors report 39 cases in which a relationship was proposed between trauma and multiple sclerosis. Twenty-four were considered not to have had previous manifestations of multiple sclerosis. Their first symptoms developed between 12 hours and 12 weeks after the traumatic episode. The expression of symptoms was maximal at 2–3 weeks after injury. Fifteen cases had pre-existing manifestations of multiple sclerosis. In each, the clinical course was judged to have deteriorated within 1–12 weeks of injury, with a mean maximum interval of 1–2 weeks. Using an arbitrary (and unvalidated) scale, applied retrospectively, there was no correlation between outcome and the severity of injury. The ApoE4 allele, associated with a poor outcome from head injury, was under-represented in 27/39 tested (70%) compared with historical controls (15%), suggesting to Chaudhuri and Behan (2001) that their patients were destined to follow a benign course as part of the natural history. The authors listed five possible mechanisms (increased permeability of the blood–brain barrier, increased production of proinflammatory cytokines, increased production of nitric oxide synthetase, synergistic effect of psychological stress, and direct axonal injury) as potential mechanisms for the reported effect, preferring, in their summary, a sequence involving stress-related release of proinflammatory cytokines and nitric oxide.
Most experts consider Sibley et al (1991) to be the best available epidemiological survey dealing with events triggering activity in multiple sclerosis. It has been criticized on the grounds that the survey is not directly concerned with the most frequent context of whiplash and cervical cord demyelination. (This hypothesis was not under discussion when the study was planned.) Although designed to answer the more general question of a relationship between trauma and multiple sclerosis, the study does have sufficient power to address the specific issue of neck injury and cervical cord demyelination. It has been suggested that a less stringent classification of new episodes might have produced a different result, but looser definitions would have counted a number of episodes resulting from transient changes in conduction through pathways with a reduced safety factor for transmission of the nerve impulse, of doubtful significance with respect to disease activity. The association with electrical injury has been cited as evidence in support of a general relationship between trauma and multiple sclerosis. In the initial analysis, electrical injuries were grouped in the category of burns (although none did in fact produce burns). The annualized exacerbation rate for burns was 0.39 and 0.43 in the periods at risk and not at risk, respectively. Electric shock was reported in 19 instances by 17 patients. Four of these episodes were followed within 3 months (range 1–65 days) by an exacerbation. Three received shocks from domestic appliances. One was adversely affected by a medical instrument designed to provide electric current for the relief of pain due to multiple sclerosis (transcutaneous electrical nerve stimulation). Clearly electrical trauma is not an issue in most cases and this finding in isolation does not materially alter the lack of evidence for the general hypothesis. The statistical significance has 95% confidence intervals >1 only for the 3-month analysis. This is lost if the episode of injury caused by the transcutaneous electrical nerve stimulator is removed. The statistical approach has not included correction for multiple comparisons.
Thus, in terms of design, definition, power and analysis, the studies are not easily compared. However, none provides evidence supporting the hypothesis that a causal relationship exists between trauma and multiple sclerosis, and each is consistent with the alternative interpretation that the temporal coincidence is due to chance. But protagonists of a causal relationship also offer the indirect effects of stress, triggered by trauma, and its physiological consequences as a possible mechanism. Few would disagree that severe trauma to the head and neck with multiple injuries to the affected individual and third parties constitutes psychological stress that would trigger a number of physiological responses. Although a mechanistic hypothesis can be stated based on interactions between workings of the neurological, immunological and endocrine systems, we have already concluded that there is no direct supporting epidemiological evidence that underpins this explanation for a relationship between stress and clinical activity in multiple sclerosis.
The American Academy of Neurology has issued an analysis of the relationship between multiple sclerosis and physical trauma or psychological stress through its therapeutics and technology assessment subcommittee (Goodkin et al 1999). The survey is particularly useful as a source of published material on case– control, cohort and uncontrolled studies, as well as expert opinion and anecdotal evidence. The panel accepted that a hypothesis linking trauma to disease activity in multiple sclerosis could reasonably be proposed based on changes in the blood–brain barrier as the necessary basis for debating the epidemiological evidence. Taking the liberal position of a one-year interval between trauma and any neurological consequences, and confining their scrutiny to injuries of the head and spine, the committee considered that the best available studies provide strong evidence from case– control or cohort studies excluding anything more than a modest effect of trauma on exacerbations of pre-existing multiple sclerosis in the 3 months after trauma. In fact, the evidence was considerably more supportive of no effect than even this modest relationship. Despite low statistical power, the resoundingly negative result of the population-based Mayo Clinic series is seen as particularly strong evidence against a causal relationship. The evidence against an effect of stress, based on the available studies, is seen as marginally less damning even though the mechanistic hypothesis linking stress to disease activity in multiple sclerosis is even less plausible than for trauma.
Mechanistic interpretations
It could be argued that, without supporting epidemiological evidence, it is hardly necessary to examine putative mechanisms – however interesting that might be as an academic exercise. The core of the proposal linking trauma to a change in the natural history of multiple sclerosis is that whiplash injury of the cervical spine leads to alteration in permeability of the blood–brain barrier, locally and at diffuse sites. This enables substances present in the circulation of individuals having the potential to develop multiple sclerosis to reach the abluminal surface of blood vessels and cause clinical manifestations of the disease. One criticism of this hypothesis linking trauma to multiple sclerosis is that it does not provide a general theory of the disease that accounts for all lesions, in all patients, in all places and on all occasions. It is self-evident (and beyond dispute) that most plaques are not precipitated by trauma. Why therefore propose an entirely different sequence of events for demyelination on those rare occasions when there is temporal and anatomical convergence? Even the protagonists offer a causal relationship of trauma to multiple sclerosis as an explanation for ≤0.1% of lesions. Demyelination is a nonspecific pathological response of the nervous system to a variety of insults. Demonstrating that this has occurred at some point following trauma does not of itself indicate that multiple sclerosis has been precipitated.
Patients with multiple sclerosis are described in whom stereotactic brain surgery was used as symptomatic treatment for tremor. The surgical lesions were subsequently shown to be associated with active demyelination in the needle tracts. Gonsette et al (1966: written in French and so mostly read secondhand in review articles) and Hasler et al (1975) found fresh lesions in some but not all patients with multiple sclerosis undergoing stereotactic thalamotomy for relief of upper limb tremor. Some areas of abnormality illustrated as related to brain surgery were not centred on the needle track. Much also has to be taken on trust that the lesions described by these authors, not subjected to rigorous histological analysis and occurring in patients without detailed presurgical assessments (before magnetic resonance imaging was available) who died from multiple sclerosis (in some instances more than a year later), were not part of generally active disease in which histological sampling elsewhere in the nervous system would have shown comparable changes. These details apart, there is a difference between direct trauma of brain tissue by a surgical procedure and soft tissue injury that may, or may not, indirectly distort parts of the central nervous system. It is notable that other neurosurgical procedures in patients with multiple sclerosis do not appear to be complicated by fresh plaques, further suggesting that these may relate to the clinical problems for which the procedures were themselves being carried out rather than the intervention itself.
A key component of the evidence offered in support of a link includes histological analyses of the cervical cord in multiple sclerosis, and correlations between the distribution of plaques and compression points from cervical spondylosis or distortions of the ligaments supporting the cervical portion of the spinal cord. Thus the hypothesis hinges on local rather than generalized effects of trauma on properties of the blood–brain barrier. Brain and Wilkinson (1957) advanced the specific hypothesis that:
the effect of cervical spondylosis upon the spinal cord may be to make it more susceptible to the lesions of disseminated sclerosis at that level … This may [have been] a chance finding, but it is more likely that the site of the demyelination was associated with the presence of the spondylotic bars … relapse of the symptoms after trauma would seem to be due to further compression with consequent venous dilatation in a cord already damaged by demyelination.
Oppenheimer (1962; 1978) made observations on the cervical spinal cord – a part of the nervous system chosen for its high prevalence of multiple sclerosis lesions – in 18 patients. The cervical region is also, by definition, the site of cervical spondylosis and cervical myelopathy. David Oppenheimer observed that the lesions of multiple sclerosis are twice as common in the cervical region as elsewhere in the spinal cord, occurring invariably at the 7th cervical level, and showing a fanlike appearance related to the lateral columns. He made three (not fully independent) suggestions to explain these observations: a local rise in venous pressure, focal inflammation and mechanical distortion. Because there was no reason to conclude that the first two would locate to the lateral columns, he preferred the interpretation that mechanical stresses play a part in determining the site of lesions, through forces transmitted via the denticulate ligaments which lead to vascular leakage. David Oppenheimer suggested that fluid with the potential to cause demyelination leaks through the traumatized barrier.
Oppenheimer (1978) anticipated that if, in the context of cervical myelopathy, plaques did not accumulate maximally opposite the sites of spondylitic bars, the specific theory advanced by Brain and Wilkinson (1957) would lose its force. David Oppenheimer's own pathological studies showed a discrepancy between the site of plaques and spondylitis in three cases. He ended by concluding that:
too little is known about the mechanical effects of lateral bending and twisting movements of the neck to justify speculation on the stresses set up in the cord during these movements.
Kidd et al (1993) used magnetic resonance imaging to show the maximum distribution of cervical cord lesions at different levels from the sites of compression by spondylitic bars. David Oppenheimer's pathological observations did, however, lead him to offer a more general hypothesis concerning the anatomical localization of plaques affecting the cervical cord in multiple sclerosis. His observations relate to chronic and not acute trauma and the hypothesis does not explain why other parts of the central nervous system are also preferentially affected in multiple sclerosis (the anterior visual pathway and the periventricular white matter). One of the mechanisms that Oppenheimer rejected in discussion of his work (focal inflammation) does in fact better account for the overall distribution of lesions in multiple sclerosis. Bryan Matthews (1991) summarized the situation as follows:
a hypothesis can be constructed linking onset or relapse of multiple sclerosis up to six weeks after concussive head injury but thereafter with rapidly diminishing probability. Minor injury to the spinal cord could be held similarly responsible. The hypothesis is based on the unproven primary role of breach of the blood brain barrier in the pathogenesis of the plaque. It is impossible to answer what would have happened if there had been no injury. Neurologists will form their own opinions but would hope to avoid making pronouncements unsupported by evidence.
Our present view is that a complete reading of the literature provides no epidemiological evidence in support of a relationship between trauma and the cause of multiple sclerosis. Trauma does not precipitate latent multiple sclerosis. Nor does it change the activity, course and prognosis in patients with established multiple sclerosis. That position is reached using the following logic:
-
•
The frequencies of trauma and disease activity in multiple sclerosis make it certain that these will occasionally occur together by chance.
-
•
Epidemiological studies do not show an association between trauma and disease activity or the course of multiple sclerosis.
-
•
Colocalization of lesions due to multiple sclerosis and cervical spondylitis, or in patients undergoing direct brain needling, does not establish causality.
-
•
Opening of the blood–brain barrier is necessary but not sufficient for establishing the cascade of events that culminates in the pathological features of multiple sclerosis.
Approached from the rigorous attitude of medical science in assessing evidence, there is no evidence for a causal relationship between trauma and multiple sclerosis. That position is not materially altered if the same questions are asked from the perspective of civil law on a balance of probabilities.
Anaesthesia and surgery
No epidemiologically robust studies of multiple sclerosis and anaesthesia or surgery have been performed and, again, the evidence is mostly anecdotal. Ridley and Schapira (1961) reported a complete absence of exacerbations in the month after surgery in their group of 40 patients studied for this and other forms of surgical trauma. Baskett and Armstrong (1970) detailed four cases in which surgery coincided with disease activity in multiple sclerosis. One elected for sterilization on learning of the diagnosis and suffered a perioperative relapse. The second also had an elective procedure for tendon rearrangement in a spastic leg due to pre-existing multiple sclerosis. The third required surgery for a fractured femur. The fourth relapsed after removal of a breast lump but not following the subsequent mastectomy. The authors rightly drew no firm conclusions about the relationship between general anaesthesia, surgery and multiple sclerosis. In their part retrospective and part prospective surveys, Bamford et al (1981) and Sibley et al (1991) found that patients with multiple sclerosis had more surgical procedures than controls, through complications of the disease, but relapse rate in the period at risk and rate of progression were uninfluenced. In fact, the period following minor or major surgery was relatively safe (annualized exacerbation rates 0.14 and 0.18 in the period at risk compared with 0.23 and 0.29 at other times).
Data on the possible influence of anaesthesia in multiple sclerosis are still scarce. Siemkowicz (1976) reviewed 16 anaesthetics in 11 patients already known to have multiple sclerosis given over three years, in 5 of whom relapses occurred in the perioperative period. In each, the procedure was either for drainage of abscess or was obviously complicated by infection, which (from what is known both in terms of the effect of pyrexia on the symptoms of multiple sclerosis and the role of infection) provides an alternative explanation for the relapse. This also was the author's conclusion because none of the patients who was not pyrexial after an anaesthetic reported a change in symptoms. Bamford et al (1978a) reported on 100 patients with multiple sclerosis questioned about their experience with anaesthesia during the course of the disease. General anaesthesia was performed in 42 patients on 88 occasions. Original medical files were available for 33 patients, allowing data linking anaesthesia and the course of multiple sclerosis to be validated. One patient experienced a relapse in the month following anaesthesia and laparoscopy for tubal ligation. Another, with progressive multiple sclerosis, noted an acceleration in her disability progression following hysterectomy. Spinal or caudal anaesthesia was performed in 14 patients on a total of 18 occasions, including three women undergoing five obstetric deliveries. The only adverse event was a relapse in one patient during the first month postpartum. Local anaesthesia was reported by 98 patients, usually on more than ten occasions; this was mainly for dental procedures and, in 46 patients, dental records were available for validation of the history. No consistent deleterious effect was noticed on the course of multiple sclerosis. The authors reached the same conclusion when they analysed the specific effect of any one anaesthetic agent whatever its mode of delivery. Bamford et al (1978a) considered that the rare associations observed between anaesthetic procedures were coincidental and not causal, being consistent with the natural history of the disease. Their only reservations concerned spinal anaesthesia, due to insufficient experience of this procedure at the time. Data gathered subsequently as part of the PRIMS study (Confavreux et al 1998b) are reassuring. These are anecdotal data and we are not aware of any structured study devoted to the issue of anaesthesia in multiple sclerosis. We consider that anaesthesia is safe in people with multiple sclerosis and the same is true for surgical procedures. There is no need to let potential effects on activity and the clinical course of multiple sclerosis influence decisions on the need for anaesthesia and surgery.
Infections
Pierre Marie first drew attention to the onset of multiple sclerosis occurring in the wake of febrile infections: typhoid fever, smallpox, erysipelas, pneumonia, measles, scarlet fever, whooping cough, dysentery, diphtheria and syphilis (Marie 1884). He was in no doubt that microbes caused the disease (see Chapter 1) but many unsuccessful efforts have since been made to rediscover the guilty agent(s). Subsequently, the concept of a chronic organ-specific autoimmune disease is preferred to the formulation of multiple sclerosis as an infectious disease. The contemporary evidence implicating specific microorganisms in triggering the disease process is summarized in Chapter 2. Here, we discuss the role of infections in precipitating disease activity.
Infections and relapses of multiple sclerosis
Anecdotal evidence suggested the possibility of an increased risk of relapse following infection. With the availability of epidemiological studies specifically designed to address this issue, the current consensus is that infections do trigger relapses in multiple sclerosis. In fact, many of the studies show methodological limitations and the relationship may have been overemphasized. Only a minority of infections produce clinically recognizable symptoms (T. Chang 1971). In the most influential study, the frequency of infections in patients with multiple sclerosis was half that observed in age-matched healthy controls; and the frequency was inversely related to disability (Sibley et al 1985). Even taking into account that only common viral infections were considered in this study, the facts seem counterintuitive. Self-evidently, the duration and severity of infections vary. Not every event that follows infection necessarily indicates an effect on the underlying disease process; exposure may promote a variety of indirect processes that interfere with electrical properties of the central nervous system (see Chapter 13). A possible solution to the problem of under-ascertainment might be to supplement clinical observations with serial serological studies; but this merely introduces the dilemma of how often and when to take the samples, and what panel of microbiological agents should be screened (Andersen et al 1993). Infections, new episodes and pseudorelapses, related to fever or transient cytokine release (see Chapter 13), must each be independently ascertained and correlated using double-blind procedures in order to minimize ascertainment bias and the declaration of spurious associations. Retrospective designs expose recall bias for the ascertainment of infections, and these are difficult to correct. The most appropriate design compares periods at risk and not at risk in which patients serve as their own controls; this was used in the definitive study instigated by Bill Sibley in the United States.
Initially, Sibley and Foley (1965b) followed 34 patients with multiple sclerosis over a period of 3 years; 33/69 relapses (48%) were associated temporally with a common infection. However, the authors were concerned that the association may have been overestimated because patients were aware of the objectives. Therefore, the same group set up a much larger study, in which infection was only one of several factors investigated, and care was taken to avoid any preconception of results amongst participants (Sibley et al 1985). One hundred and seventy patients with clinically definite multiple sclerosis were contacted monthly for ascertainment of viruslike infections and clinical relapses, with objective assessment every 3 months, over a mean of 5.3 years. Relapses were defined as new neurological symptoms associated with appropriate change in neurological examination, lasting >48 hours and not associated with fever; viruslike infections were classified on a clinical basis as respiratory, with (‘flu’) or without (‘cold’) fever, enteric or herpetic (genital or oral). Periods at risk were defined as the interval covering 2 weeks before and 5 weeks after the infection. All other times on the study were considered not at risk. The rate of relapse was found to be 2.8-fold higher in the at-risk period compared with the control intervals, whatever the level of disability and overall relapse frequency (Table 4.29 ). This study provided strong evidence for an association between common viruslike infections and relapses in multiple sclerosis. However, among the 771 documented infections, only 67 (8.7%) were associated with a relapse; and there was no link between bacterial infections (mostly of the urinary tract) and disease activity.
Table 4.29.
Literature data on infections and relapses of multiple sclerosis
| Study | Number of patients | Time window of exposure to the infection | Relapse rate/year |
Relative risk | p value (chi-squared test) | |
|---|---|---|---|---|---|---|
| Period at risk | Period not at risk | |||||
| Sibley et al 1985 | 170 | −2 to +5 weeks | 0.64 | 0.23 | 2.8 | <0.001 |
| Andersen et al 1993 | 60 | −1 to +3 weeks | 1.70 | 1.29 | 1.3 | 0.048 |
| −2 to +5 weeks | 1.51 | 1.33 | 1.1 | 0.20 | ||
| Panitch 1994 | 30 | −1 to +5 weeks | 2.92 | 1.16 | 2.5 | <0.001 |
| Edwards et al 1998 | 41 | −2 to +2 weeks | 3.27 | 1.62 | 2.0 | 0.004 |
| Buljevac et al 2002 | 73 | −2 to +5 weeks | 2.05 | 0.97 | 2.1 | <0.001 |
In a more limited study of 60 ambulant patients with relapsing–remitting multiple sclerosis followed for a mean of 31 months (Andersen et al 1993), the relative risk of relapse was only 1.3 (p = 0.047), using a time window of 4 weeks for the at-risk period (Table 4.29). No significant association was found using the 7-week time window previously adopted by Sibley et al (1965). Patients were contacted monthly and examined every 2 months. They knew the objectives of the study. Upper respiratory and gastrointestinal (but not urinary) tract infections were considered.
Two other small studies, each embedded within a placebo-controlled trial of IFN-β and with short follow-up, deserve cautious interpretation. Panitch (1994) examined 30 patients with relapsing–remitting multiple sclerosis every 3 months, and whenever a relapse occurred, during 2 years of the pivotal phase III trial in which patients received either placebo or IFN-β1b at doses of 1.6 or 8 million IU subcutaneously every other day (IFNβ multiple sclerosis Study Group 1993). Patients kept daily logs of upper respiratory infections. The at-risk period was defined as encompassing 1 week before and 5 weeks after the onset of upper respiratory tract infections. The relapse rate was 2.5-fold higher in the at-risk period by comparison with control intervals (Table 4.29), irrespective of treatment. The frequency of new or recurrent symptoms, and the severity, duration and response to corticosteroids were similar whether or not the relapses occurred during at-risk periods. However, seemingly no specific effort was made to maintain patients blind to the objectives of the study or to validate infections mentioned in the daily logs. Furthermore, the relapse rate during the 2-year study period was 1.79 per year, which is unusually high given that a proportion of patients were receiving medication that is considered capable of lowering relapse frequency.
S. Edwards et al (1998) studied 41 patients with either relapsing–remitting or secondary progressive multiple sclerosis randomly assigned either to placebo, or IFN-β1a at a dose of 6 or 12 MIU by subcutaneous injection three times weekly, and observed prospectively for 15 months (monthly for first 9 months, and then every 3 months). Participants recorded disease activity attributed to multiple sclerosis and episodes considered to represent infections, in a specially designed diary. Blood samples were taken at monthly intervals during the first 9 months and assayed for the presence of antibodies to influenza A, influenza B, respiratory syncytial virus, adenovirus, cytomegalovirus and enterovirus. MRI was used to assess the number and size of gadolinium enhancing lesions. The period at risk was defined as 2 weeks before and after the onset of upper respiratory tract infections. The relapse rate was 2.0-fold higher in at-risk compared to periods non-at-risk (Table 4.29). The severity of relapses did not differ depending on when they occurred. By focusing on the subgroup of serologically confirmed infections, the relative risk for relapse was found to be 3.4-fold higher following exposure compared with intervals not at risk. Infections had no consistent influence on MRI activity. Taken together, these results must be regarded with caution. As the authors indicate, over-reporting by patients of upper respiratory tract viral infections seems likely, because the average rate of such infections was high (2.4 per year) and only 12.5% could be serologically confirmed. Over-reporting of relapses is also possible: the rate was 1.88 per year although two-thirds of the patients were allocated to IFN-β1a. Apparently, individual relapses may have been counted more than once during the 4-week period at risk because only 19 infections were reported by the authors to have been associated with relapses whereas a total of 27 relapses occurred during periods at risk. No sensitivity analysis was performed by changing the location and duration of the time window encompassing the onset of the infection. Symptoms of gastrointestinal or urinary tract infections were not taken into account, perhaps resulting in classification bias for the periods at risk and control intervals. MRI results are difficult to interpret because two-thirds of the patients were randomized to active treatment with IFN-β1a and the code was not broken at the time associations between infections and relapses were analysed.
Recently, Dutch authors have enrolled 73 patients with relapsing–remitting clinically definite active multiple sclerosis in a prospective survey incorporating systematic clinical assessments at 8-week intervals for a mean follow-up of 1.7 years (Buljevac et al 2002). Symptomatic infection of any type or a putative relapse attributable to multiple sclerosis triggered an additional visit within 3 days. For confirmed infections or a clinical relapse, an additional visit was arranged 3 weeks later. Furthermore, for confirmed infections, three serial MRI examinations were performed at 3-week intervals with T1 sequences and gadolinium injection. Relapses were graded as ‘major’ or ‘minor’, according to change in the EDSS score; and as ‘short’, ‘long’ or ‘sustained’, depending on whether the EDSS score returned to baseline at ≤3 weeks, >3 weeks or ≥3 months. The main analysis involved the 7-week period at risk, previously defined by Sibley et al (1985). A total of 167 infections and 145 relapses were recorded. By comparing the period at risk with control intervals, the relapse rate ratio was 2.1 (95% CI 1.4–3.0; p < 0.001: Table 4.29). A sensitivity analysis was performed by changing the location and the duration of the time window encompassing the onset of infection: −2 to +2 weeks, +1 to +4 weeks, +1 to +8 weeks, and +3 to +5 weeks. This led to essentially similar results. The relapse rate ratio increased to 2.7 (95% CI 1.5–4.8; p < 0.001) when considering ‘major long’ relapses only. It reached 3.8 (95% CI 1.8–7.9; p < 0.001) for the subgroup of ‘major sustained’ relapses. Thus, the more severe and long-lasting the relapse, the stronger the association with infection: more transient symptoms, coinciding only with the elevation in temperature, would be expected in the context of pseudorelapses. Overall, 46/167 infections (28%) were associated with a relapse during the 7-week period at risk. Urinary tract infections were not associated with an increase in relapse frequency.
The strengths of this study are evident: regular survey visits at close intervals and, in case of any suspected infection or relapse, near immediate additional visits systematically arranged to control for memory biases; infections of any kind (upper respiratory, gastrointestinal and urinary tract) considered; and fever-related neurological episodes excluded as events registered in the study. However, there are possible sources of bias: assessments of infections and relapses were not made by independent masked assessors; no effort was made to perform a sensitivity analysis restricted to relapses featuring neurological manifestations that were new for that patient; the duration and severity of infections were not considered; when a risk period that was not overlapping the infection was considered, no significant association was observed; and power could have been enhanced by introducing a case crossover design that increased the number of control periods.
But the MRI results are puzzling. When comparing the three serial MRI examinations performed after any confirmed infection, the percentage of active scans and the mean number of enhancing lesions per scan remained unchanged. This observation held whether or not the infection was associated with a relapse; whether or not the patient was receiving IFN-β or methylprednisolone; and when a relapse was linked to the infection. One may argue that the increase in MRI activity could have occurred prior to the first infection-related scan. The authors refer to a personal series of nine patients with multiple sclerosis examined at monthly intervals during 8 months, again with no significant change in MRI activity related to the eight infections that occurred during that study period.
Can these seemingly contradictory clinical and MRI data be reconciled? Buljevac et al (2002) propose that infections could lead to relapses through a mechanism that is independent of blood–brain barrier dysfunction. Although lesions due to multiple sclerosis can be detected before overt dysfunction of the blood–brain barrier (Filippi et al 1998a; 1998b), it remains to be shown that this applies to any one lesion.
For us, the results reported by Buljevac et al (2002) raise more questions than answers. Were the study restricted to clinical results, it would be regarded as confirming the association between infection and relapse in multiple sclerosis. This interpretation carries biological plausibility: secretion of proinflammatory cytokines such as IFN-γ, and interaction of the host immune system with viral superantigens (Woodland 2002) are mechanisms accepted as resulting in immune activation leading to relapses of multiple sclerosis. However, the MRI data introduce uncertainties. Generally, the correlation between clinical and MRI activity is well established (Youl et al 1991b). The observations offered by Buljevac et al (2002) require this relationship to be compromised making it necessary to arbitrate on the relative reliability of MRI data and clinical evaluations.
Specific infections and relapses of multiple sclerosis
By systematic sampling for a panel of antibodies to common respiratory pathogens (influenza virus A, B and C; parainfluenza virus 1, 2 and 3; respiratory syncytial virus; adenovirus; reovirus; Coxsackie virus B1–6; Mycoplasma pneumoniae; Epstein–Barr virus; and herpes simplex virus 1 and 2), before the study and every 3 months during the first year, Panitch (1994) was unable to find fluctuations in titre correlating with clinical relapses. Similar results were obtained by S. Edwards et al (1998) when testing an equivalent panel of organisms. However, no effort was made in these studies to perform blood sampling in temporal relationship to the infections. This critique cannot be offered on the Swedish work of Andersen et al (1993), in which a significant correlation was found between the rise in adenovirus, but not influenza virus, titre and relapse: however, the number of participants was small (seven and six, respectively). In a group of 19 patients with multiple sclerosis followed monthly for one year, active viral replication of Epstein–Barr virus was observed in 73% of patients experiencing relapses during the study period, but in none of the patients with clinical stability, suggesting a role for Epstein–Barr virus as an activator of the disease process (Wandinger et al 2000).
The Dutch prospective study of 73 patients with relapsing– remitting multiple sclerosis followed up at 8-week intervals for a mean of 1.7 years also tested the relationship between relapse and serologically defined Chlamydia pneumoniae infection (Buljevac et al 2003a). Among the 73 patients, 48 did not show evidence of infection during follow-up, 15 exhibited ≥1 serologically defined acute infection, and 10 had a serologically defined chronic infection with Chlamydia pneumoniae. In the subgroup of the 15 patients with serologically defined acute infections, the relapse rate ratio was 3.1 (95% CI 1.3–6.7; p = 0.006) when comparing infection and noninfection periods. The majority of infections occurred without clinical symptoms of infection. Interestingly, the increased risk of relapses was still observed for the subgroup of chronic Chlamydia pneumoniae infections. Furthermore, in the serologically defined acute infections, the alteration in serology specific for Chlamydia pneumoniae was usually not accompanied by a rise in anti-Chlamydia trachomatis, anti-staphylolysine and anti-mycoplasma antibodies.
Lately, in a pilot observational study of 16 patients with relapsing–remitting multiple sclerosis enrolled on the occasion of a well-documented upper respiratory tract infection and followed for 5.5–12 months, 78% of the 9 infections due to picornaviruses and 17% of the remaining 12 infections (p = 0.01) were associated with a relapse during the period at risk beginning 2 weeks before and lasting until 5 weeks after the infection (Kriesel et al 2004). In this study, no consistent association was found between the index infections and influenza A and B, respiratory syncytial virus, adenovirus, parainfluenza types 1–3 and coronaviruses.
The current consensus is to accept that an association exists between infections in general and relapses of multiple sclerosis. This conclusion is well documented in the prospective observational studies. However, it must be stressed that only one study has followed a satisfactory methodology and taken all infections into account (Buljevac et al 2002). However, as discussed above, the association between infections and clinical disease activity observed was not supported by MRI outcomes, reducing confidence in the apparent association. There is no evidence that any one pathogen is specifically associated with relapses of multiple sclerosis. It is not hard to offer a mechanistic hypothesis for this generic increase in risk but the issue of whether disease activity associated with specific infections merely reflects secondary immune dysregulation – the audience rather than actors in the drama of multiple sclerosis (Hunter and Hafler 2000) – is unresolved.
Seasons
A correlation between seasons and the frequency of relapse has produced conflicting results. A higher frequency was found in warmer months in Cleveland, Ohio (Sibley and Foley 1965a). Similar results were found in Arizona when 178 patients and 82 controls were followed prospectively for 5 years (Bamford et al 1983). Conversely, the incidence of relapse was found to be higher in the winter and spring months in Switzerland (Wuthrich and Rieder 1970). Episodes were more frequent in the spring, medium in the summer and autumn, and lowest in winter when a population-based and prospective incidence survey was conducted in Stockholm County, Sweden, on 147 patients suffering from an inaugural episode of monosymptomatic optic neuritis (Y-P. Jin et al 1999). The higher frequency was found during the autumn and winter months in another area of Sweden (Andersen et al 1993) and during the coldest (January and February) and the warmest (July and August) months in Japan (Ogawa et al 2004). A peak for the incidence of relapses, though not statistically significant, was found in September compared with the rest of the year in the Netherlands (Buljevac et al 2002). Lastly, no significant seasonal change could be observed in other areas (Goodkin and Hertsgaard 1989; Koziol and Feng 2004; Panitch 1994; Schapira 1959). Interestingly, seasonal fluctuation of gadolinium enhancing magnetic resonance imaging lesions has been reported from 202 brain MRI examinations performed in 53 patients with relapsing multiple sclerosis (Auer et al 2000). There was a clear biphasic fluctuation of disease activity over the year, the mean number of lesions being five times higher in spring than in autumn. By contrast, a large analysis of 1320 brain MRI scans from 120 patients with relapsing–remitting multiple sclerosis who were part of the untreated arm of a phase III study of glatiramer acetate did not show significant seasonal fluctuations in the number of active MRI lesions (Rovaris et al 2001d). A similar conclusion was reached in a group of 24 patients, also with relapsing–remitting multiple sclerosis, included in the placebo arm of a trial using cladribine and involving monthly MRI examinations for one year (Koziol and Feng 2004). The same observation was made in a group of 28 patients with multiple sclerosis (Killestein et al 2002c). However, in this study, seasonal fluctuations were observed for the ability of T cells to secrete proinflammatory cytokines such as TNF-α and IFN-γ, with maximum values observed during the autumn. These results confirm those previously obtained in 60 patients with chronic progressive multiple sclerosis showing significantly increased in vitro IFN-γ production in autumn and winter by comparison with spring and summer months (Balashov et al 1998).
Given the possible difference in seasonal distribution of relapses depending on location, a meta-analysis performed to characterize and quantify seasonal variation in first episodes of optic neuritis or multiple sclerosis, and relapses in individuals with established disease, is helpful (Y-P. Jin et al 2000). The authors selected nine reports on inaugural optic neuritis, six dealing with the onset of multiple sclerosis, and nine describing relapses providing appropriate data on the season of the neurological episode. They found a fairly homogeneous pattern with a decreasing frequency in the occurrence of episodes from spring to winter. The size effect was limited, however, as there were only 1.45 times more inaugural episodes in spring than in winter. The difference was even less marked for inaugural optic neuritis and relapses of established multiple sclerosis. We take this meta-analysis, performed with caution and including relevant available data from various countries, to show that the influence of seasons on disease activity, although statistically significant, is nevertheless extremely modest and – as presently understood – of limited value in elucidating factors that trigger the disease process. Furthermore, assuming that there might be a link between cytokine secretion and disease activity, the higher risk observed for relapse occurrence in spring is not consistent with the increased autumn IFN-γ secretion observed in the two studies that have addressed this issue (Balashov et al 1998; Killestein et al 2002c).
Vaccinations
Since the pioneer work of Louis Pasteur, immunization with vaccines containing neural tissue is recognized as having the potential to cause multifocal inflammatory and demyelinating lesions of the central nervous system. Such phenomena are usually monophasic and self-limited, as in acute disseminated encephalomyelitis. Modern vaccines no longer contain neural tissue derivatives but homologies can exist between microbial and neural epitopes. This molecular mimicry may allow specific immune competent cells activated by the vaccine to respond autoaggressively against the host nervous system. It may also be hypothesized that stimulation of the immune system can activate autoreactive clones through a bystander effect. Because autoimmunity is considered pivotal in the pathogenesis of multiple sclerosis, it is reasonable to suggest that vaccinations might trigger the onset or relapse of multiple sclerosis (Palffy and Merei 1961). This concern was lately revived, especially in France, by the anecdotal reports of a temporal association between vaccination and disease activity following an extensive immunization programme against hepatitis B.
Consideration also has to be given to the possibility that vaccines might not only provoke inflammatory demyelinating diseases of the central nervous system de novo, but also trigger the inaugural clinical expression of demyelination in individuals with subclinical disease, provoke a relapse in individuals with established multiple sclerosis, and induce transient physicochemical changes sufficient to block the nerve conduction in existing but asymptomatic lesions. But, as with all risk factors, coincidental temporal association also needs to be excluded.
The onset of multiple sclerosis
There have been many case reports of multiple sclerosis first presenting after vaccination: influenza is most often implicated (Bakshi and Mazziotta 1996; Bienfang et al 1977; Cangemi and Bergen 1980; De la Monte et al 1986; Hull and Bates 1997; C.M. Poser 1982; Rabin 1973; Ray and Dreizin 1996; Rosenberg 1970; Waisbren 1982; W.R. Warren 1956; Yahr and Lobo-Antunes 1972), but other vaccines have also been blamed (Behan 1977; S. Holt et al 1976; Joyce and Rees 1995; Kazarian and Gager 1978; Klie et al 1982; Mancini et al 1996; H. Miller et al 1967; Pathak and Khare 1967; Riikonen 1989; Sibley and Foley 1965b; Stevenson et al 1996; Topaloglu et al 1992). However, there have been very few systematic studies devoted to vaccines in general as risk factors for multiple sclerosis or other central nervous system demyelinating episodes (Table 4.30 ). The most comprehensive account is the United States case–control study conducted in three large health maintenance organizations (DeStefano et al 2003). Potential cases were identified in the automated database with a first diagnosis of multiple sclerosis or optic neuritis between 1995 and 1999. Eligible cases needed to be registered in the database for ≥1 year before diagnosis. Paper medical records were reviewed to confirm case status and determine the onset of clinical events. The index date was taken as the first clinical manifestation of neurological symptoms or signs in each case, and that date was also used for the corresponding controls. Up to three controls from the database were matched to each case. Exposure to vaccinations was ascertained from an automated database, paper medical records and telephone interviews. When a vaccination was reported in the telephone interview but not also captured in the automated database, it was categorized as a ‘self-reported vaccination’. Odds ratios were estimated from conditional logistic regression. The study involved 440 cases, of whom there were 332 with multiple sclerosis and 108 with isolated optic neuritis; 950 controls were included in the analysis. Vaccination against tetanus, which included tetanus toxoid and combined tetanus and diphtheria toxoid vaccines, was the most common inoculum in cases (155/440; 35%) and controls (449/950, 47%). Self-reported vaccinations ranged from 30% (for tetanus) to 65% (for measles, mumps and rubella) of the events. The analyses indicated that having ever received one of the vaccines of interest did not increase the risk of multiple sclerosis or optic neuritis (Table 4.30). In these analyses, all the odds ratios were <1.0; this decrease reached statistical significance for tetanus vaccination (OR 0.6; 95% CI 0.4–0.8). These results did not alter when self-reported episodes were excluded from the analyses, or when the interval between vaccination and the index date was taken into consideration. The authors concluded that the vaccines commonly administered to adults are not associated with an increased risk of developing multiple sclerosis or optic neuritis.
Table 4.30.
Literature data on any vaccination and multiple sclerosis
| Study | Number of patients and health status | Assessment of exposure to any vaccination | Time window of exposure to any vaccination before the neurological episode | Odds ratio (95% CI) |
|---|---|---|---|---|
| Case–control studies with occurrence of first demyelinating episode or onset of multiple sclerosis in cases vs. controls | ||||
| Touzé et al 2000 |
121 first demyelinating episodes | Telephone interview | 60 days | 1.4 (0.5–4.3) |
| 121 neurological controls | Copy of vaccination certificate: 17% | 61–180 days | 2.1 (0.7–6.0) | |
| DeStefano et al 2003 |
|
|
1 year: | |
| Tetanus | 1.2 (0.7–2.0) | |||
| Influenza | 0.8 (0.5–1.4) | |||
| Any time: | ||||
| Tetanus | 0.6 (0.4–0.8) | |||
| Influenza | 0.8 (0.6–1.2) | |||
| Measles, mumps, rubella | 0.8 (0.5–1.5) | |||
| Measles | 0.9 (0.5–1.4) | |||
| Rubella | 0.7 (0.4–1.0) | |||
| Hernán et al 2004 |
|
Automated database |
3 years: | |
| Tetanus | 0.6 (0.4–1.0) | |||
| Influenza | 1.0 (0.5–2.0) | |||
| Relapse of multiple sclerosis | ||||
| A.E. Miller et al 1997 |
|
Per protocol | 6 months | 2.0a |
| Confavreux et al 2001 |
|
|
2 months: | |
| Any vaccine | 0.7 (0.4–1.3) | |||
| Tetanus alone | 0.7 (0.2–2.5) | |||
| Combined tetanus | 0.2 (0.1–1.0) | |||
| Influenza | 1.1 (0.4–3.1) | |||
multiple sclerosis according to C.M. Poser et al (1983).
Crude relative risk estimated from available data in the original manuscript.
Relapse of multiple sclerosis
Despite the theoretical concerns mentioned above, small observational studies on the safety of influenza vaccination in patients have nonetheless been reassuring (Bamford et al 1978b; L.E. Davis et al 1972; De Keyser et al 1998; Kurland et al 1984; Sibley et al 1976). For instance, in a group of 180 patients with relapsing–remitting multiple sclerosis, the risk of relapse was significantly higher after a flulike illness (33%) than after an influenza vaccination (5%) over a 6-week period following the event (De Keyser et al 1998). Furthermore, in a double-blind placebo-controlled study of safety for swine influenza virus vaccination in patients with multiple sclerosis, the rate of clinical relapse was the same (4/33 patients) for the vaccine- and placebo-treated groups over a 3-month follow-up period (L.W. Myers et al 1977). In a multicentre, prospective, randomized, double-blind trial of influenza immunization, A.E. Miller et al (1997) enrolled 103 patients with relapsing–remitting multiple sclerosis free of disease modifying agents for ≥6 months. During the 28 days following inoculation, 3/49 vaccinated patients and 2/54 placebo patients experienced relapses. Over the subsequent 6-month follow-up period, 11 vaccinated patients and 6 placebo patients experienced one relapse each (annualized relapse rate, 0.45 and 0.22, respectively). Mean time interval to the first relapse was 91 days in the vaccine group and 55 days for the placebo group. None of these differences was statistically significant. The authors conclude that influenza vaccination is safe for patients with multiple sclerosis.
The risk of triggering disease activity after any vaccination in patients already affected with multiple sclerosis and free of relapse for ≥12 months was explored in a formal way by the VACCIMUS (VACCines In multiple sclerosis) study coordinated through the EDMUS network (Confavreux et al 2001). The computerized EDMUS databases were used to select patients having a relapse between 1993 and 1997 that had been confirmed at neurological consultation, but were free of any new events in the previous 12 months. These data were validated using the patients’ medical case records. In a second, independent step, the patients were interviewed on the telephone about all vaccinations received during the entire study period (1992–1997) but were aware neither of the specific hypothesis being tested nor the date assigned to the relapse of interest (to which the interviewer was also blinded). A total of 643 patients were enrolled of whom 96 (15%) had been vaccinated in the 12 months prior to the index relapse. Written confirmation from vaccination certificates was obtained in 94% of these cases. Analyses were conducted using a case-crossover design (Maclure 1991). Exposure to a vaccine in the 2 months preceding the index relapse (the period at risk) was compared with exposure during four 2-month control periods, each patient serving as his/her own control (Figure 4.35 ). The relative risk of a relapse associated with exposure to any vaccination during the previous 2 months was 0.71 (95% CI 0.40–1.26; Table 4.30). Results were similar for specific vaccinations against tetanus alone (RR 0.75; 95% CI 0.23–2.46); tetanus associated with poliomyelitis or diphtheria (RR 0.22; 95% CI 0.05–0.99); influenza (RR 1.08; 95% CI 0.37–3.10); and hepatitis B (RR 0.67; 95% CI 0.20–2.17). These results remained identical (varying between 0.68 and 0.79) when duration of the at-risk and control periods was varied from 1 to 3 months; when all reported vaccinations were included, even if they were not confirmed; and when the analysis was restricted to the patients having only one vaccination during the 12 months preceding the index relapse. The evidence suggested no increase in the risk of relapse following any vaccination, hepatitis B vaccination included, in patients with multiple sclerosis who had been free of a new relapse for ≥12 months.
Figure 4.35.

Vaccinations and the risk of relapse in multiple sclerosis. Number and percentage of patients with ≥1 vaccination in the successive 2-month periods before the index relapse among 643 enrolled patients. A given patient may have received ≥1 vaccines within ≥1 of the 2-month periods. The relative risk is calculated from the proportion of patients vaccinated during the 2-month period at risk and that of patients vaccinated during the 2-month control periods.
Adapted from Confavreux et al (2001).
© 2006
These results are consistent with the lack of MRI evidence for disease activity in patients with multiple sclerosis following influenza (Michielsens et al 1990; Salvetti et al 1995) and Calmette–Guérin bacillus (BCG) vaccination (Ristori et al 1999). They are also in agreement with the demonstration in patients with multiple sclerosis that influenza vaccination is followed by an increase in the number of influenza-specific, compared with myelin-specific, T cells in peripheral blood (Moriabadi et al 2001).
Hepatitis B vaccination
The issue of hepatitis B vaccination and multiple sclerosis has excited particular public attention and deserves special consideration. The failure to eradicate hepatitis B infection by immunization campaigns directed at high-risk groups (health care and laboratory professionals; travellers to endemic regions; patients with liver disease and dialysis patients; prostitutes and intravenous drug abusers) led the World Health Organization to promote mass immunization programmes in babies and preadolescents in the early 1990s (Kane 1995). But anecdotal cases, especially in France, and small series of cases of first episodes consistent with demyelination or a new episode in a patient with existing multiple sclerosis developing within a few days or weeks after administration of the vaccine were soon reported (Berkman et al 1996; Gout et al 1997; Herroelen et al 1991; Kaplanski et al 1995; Mahassin et al 1993; Nadler 1993; Senejoux et al 1996; Tourbah et al 1999; Trevisani et al 1993; Van de Geijn et al 1994). By July 1996, about 200 cases were known to the French authorities – generating much concern about safety of the vaccine, although post-marketing surveys were reassuring (Duclos 1992; Levy-Bruhl et al 1999; B.J. McMahon et al 1992; Niu et al 1996; F.E. Shaw et al 1988).
Three case–control studies in adults were therefore set up in 1994, at the initiative of the French Agence du Médicament, to address the issue of a possible link between hepatitis B vaccination and the onset of multiple sclerosis (Fourrier et al 1999; Sturkenboom et al 1999; Touzé et al 2000). All three reported nonsignificant increases in the risk of multiple sclerosis after hepatitis B vaccination, with odds ratios within the range 0.9–1.8. Touzé et al (2000) included 121 patients with a first episode of demyelination occurring between July 1993 and December 1995, and 121 age- and sex-matched controls seen at the same time. The index date was determined by the onset of neurological symptoms for the case, and this served as a reference for the corresponding control. The patients were interviewed about vaccinations using a written questionnaire and through telephone conversations. Overall, 15 patients with a neurological episode and 9 controls (12% vs. 7%; p = 0.21) reported ≥1 injection of hepatitis B vaccine within a 180-day period preceding the index date. The risk (odds ratio) for a first demyelinating episode of the central nervous system following any vaccination, as estimated by conditional logistic regression, was 1.4 (95% CI 0.5–4.3) for an exposure within the 60 previous days, and 2.1 (95% CI 0.7–6.0) for exposure within 61–180 days at risk. For hepatitis B vaccination, the figures were 1.7 (95% CI 0.5–6.3) and 1.5 (95% CI 0.5–5.3), respectively. There was therefore a small, but not statistically significant, association between any vaccination, hepatitis B vaccination included, and the development of multiple sclerosis. These results have wide confidence intervals that straddle unity. Furthermore, the reliability of the primary data is questionable, because vaccination certificates were obtained in only 17% of the patients and recall bias is likely to have occurred in retrospective reporting for the remainder – the French population being fully aware of the controversy at the time data were collected for the study. Furthermore, prior to interview, participants had been explicitly informed of the study objectives.
The next study was conducted in 18 departments throughout France and followed a similar design, but aimed to use two controls per case (Fourrier et al 1999; Touzé et al 2002). In the event, 236 examples of a first demyelinating episode and 355 matched controls were available for evaluation. During the phone interview, 64% of the cases and 71% of the controls referred to a vaccination certificate, but it seems that these were not made directly available to the researchers. Within the 2-month period preceding the index date, 13 cases (5.5%) and 12 controls (3.4%) reported hepatitis B vaccination. Corresponding numbers for the 2–12-month period at risk, were 26 cases (11.0%) and 42 controls (11.8%), respectively. The adjusted odds ratio for a first neurological episode was 1.8 (95% CI 0.7–4.6) for exposure to hepatitis B vaccination ≤60 days prior to the index date, and 0.9 (95% CI 0.4–2.0) for an exposure within the 2–12-month period. These values altered to 1.4 (95% CI 0.4–4.5) and 1.0 (95% CI 0.6–1.9), respectively, when the analyses were restricted to patients referring to a vaccination certificate during the telephone interview. Thus, validation of exposure improved but was still incomplete. Once again, the interviews were conducted in 1998, at a time when the controversy about hepatitis B vaccination was vividly debated in the French media, and the results show wide confidence intervals. Standing back from these data, the authors concede that to test with sufficient power the hypothesis of a multiplication by 1.5 for the risk of a demyelinating event within 2 months of a hepatitis B vaccination would require a sample of 2000 incident cases.
Other studies have been performed outside France. The United Kingdom General Practitioner Research Database (GPRD) was used to identify 481 examples of a first demyelinating episode in cases matched for age, gender and location with up to six controls (Sturkenboom et al 1999; 2000). Vaccination histories were collected from the automated database. The risk of a neurological event was 1.5 (95% CI 0.6–3.9) for exposure to hepatitis B vaccination ≤12 months before the index date; and 1.4 (95% CI 0.8–2.4) for hepatitis B vaccination at any time before the index date. In so far as the preliminary publications allow for critical analysis, this study is consistent with the two others provoked by public concern in failing to show a significant effect of hepatitis B vaccination.
In a retrospective cohort study, Zipp et al (1999) selected subjects in whom ≥1 year of observation was available after enrolment between 1988 and 1995, and in whom there was no previous record of demyelinating disease, from a United States health care medical insurance database: cases were matched to three or four nonvaccinated controls. This provided 27229 vaccinated and 107469 nonvaccinated subjects. For each individual, a systematic search was performed in the database for the occurrence of any central nervous system demyelinating episode (optic neuritis, myelitis, other demyelinating syndrome of the central nervous system, acute disseminated encephalomyelitis, or multiple sclerosis) ≤3 years after hepatitis B vaccination. There were 6 events among the vaccinated, and 25 in the nonvaccinated populations over this 3-year period. The relative risk for a neurological episode in the hepatitis B vaccination-exposed compared with the nonvaccinated group decreased steadily from 1.3 (95% CI 0.4–4.8) to 0.9 (95% CI 0.4–2.1) when the time window following vaccination was increased from 6 months to 3 years. These findings were reported in a research letter, providing limited information on the protocol design and conduct. It seems likely, however, that ascertainment both of vaccination and neurological status were adequate.
The school-based study conducted in British Columbia, Canada, failed to show any increase in cases of multiple sclerosis in 267412 students who completed vaccination series against hepatitis B virus between 1992 and 1998, at the age of 11–12 years by comparison with the group of 288 657 other students followed in the same area and through the same school system between 1986 and 1992 when hepatitis B vaccination was not available (Sadovnick and Scheifele 2000). There were five examples of multiple sclerosis onset in the vaccinated (1992–1998) and nine in the nonvaccinated (1986–1992) group. It could be argued that the differential follow-up favours the most recently constituted group, many of whom have not reached an age beyond which the risk of developing multiple sclerosis has waned; for this reason, the authors restricted their search for incident cases of multiple sclerosis to adolescents aged 11–17 years in order to match the groups.
More recently, a nested case–control study has been conducted in two large cohorts of nurses set up in the United States in 1976 and 1989, respectively (Ascherio et al 2001). They comprised around 240000 subjects and, in both, follow-up questionnaires were mailed to the participants every two years. Whenever the diagnosis of multiple sclerosis was reported, this was validated using information obtained from the treating physician, and the date of onset established. Only cases with definite or probable multiple sclerosis were included in the assessment of vaccinations. Each nurse with multiple sclerosis was matched to five healthy controls and one woman presenting with breast cancer from the same source cohort. The date assigned for onset of multiple sclerosis served as reference for information relating to controls. A total of 318 individuals were diagnosed with multiple sclerosis from inception of the cohort to April 1998. In a subsequent step, the vaccination status against hepatitis B was assessed by means of a mailed questionnaire. Only women with a history of hepatitis B vaccination at any time in the past (even after the onset of multiple sclerosis) and for which confirmation could be obtained from a copy of their vaccination certificates were included. This eventually led to the inclusion of 192 patients with multiple sclerosis, 534 healthy controls and 111 women with breast cancer. A total of 32 women with multiple sclerosis (17%), 84 healthy controls (16%), and 15 cases with breast cancer (14%) had received ≥1 dose of hepatitis B vaccine at any time before the index date. The relative risk of multiple sclerosis for women vaccinated against hepatitis B, estimated with the use of conditional logistic regression, was 0.7 (95% CI 0.3–1.8) for the first dose given ≤2 years preceding the onset of multiple sclerosis, and 0.9 (95% CI 0.5–1.6) for exposure to hepatitis B vaccination any time.
Sensitivity analyses confirmed these negative results. The number of vaccine doses received before the index date was similar in patients with multiple sclerosis and controls. The relative risk for multiple sclerosis was similar when the analysis was restricted to women with onset after the introduction into the United States of a recombinant vaccine against hepatitis B (1987). Similar results were obtained when the analysis was restricted to women who declared having been vaccinated against hepatitis B but could not provide a copy of the vaccination certificate. Analyses based on the less reliable information available from self-reporting showed a relative risk for multiple sclerosis of 1.2 (95% CI 0.8–1.7) for hepatitis B vaccination at any time before the onset of multiple sclerosis, and 1.9 (95% CI 1.1–3.3) for a first vaccination ≤2 years before the onset of multiple sclerosis.
In this study, only cases with definite or probable multiple sclerosis but not isolated demyelinating neurological episodes were considered. Although it is unlikely that better validation would have significantly altered the results, little effort was made to validate the vaccination status of women with multiple sclerosis who reported never having received hepatitis B. Self-reporting usually overestimates the extent of vaccination, given public awareness of the controversy on hepatitis B vaccination and multiple sclerosis. In our experience, patients often mistake hepatitis B vaccination for another inoculation. Thus, documentation is all the more desirable. But several features enhance the value of this study: the nested case–control cohort design reduced bias due to inappropriate selection of controls; the response rate to the initial questionnaire was high (95% for cases and 88% for controls); nurses have a high prevalence of vaccination against hepatitis B; confirmation was through access to vaccination records; and consistent results of sensitivity analyses matched the main analysis. A period of 2 years was chosen for the definition of recent exposure to the vaccine; this is rather long and strains the biological plausibility for a causal effect, but carries the advantage of reducing error in determining the date of onset for symptoms of multiple sclerosis.
The other United States nested case–control study already mentioned above (DeStefano et al 2003) also showed that hepatitis B vaccination was not associated with an increased risk of multiple sclerosis or optic neuritis (OR 0.9; 95% CI 0.6–1.5; DeStefano et al 2003). The authors concluded that case reports linking the onset of demyelinating diseases to recent hepatitis B vaccination probably represent a coincidental temporal association rather than causality. Furthermore, the available data provide no evidence that multiple sclerosis occurring after hepatitis B vaccination shows special clinical features compared with classical multiple sclerosis (Tourbah et al 1999).
These apparently consistent results have recently been challenged by the results of a nested case–control study within the General Practitioner Research Database (GPRD) (Hernán et al 2004). This uses three million British patients, 5% of the population, enrolled with selected general practitioners who agree to provide demographic and medical information on their patients. In this analysis, cases were selected with a validated first diagnosis of multiple sclerosis established between 1993 and 2000. The index date referred to the onset of first neurological symptoms. Only the 163 cases in whom the index date for first neurological symptoms occurred ≥3 years after registration in the database were selected. These were matched to 1064 controls. Evidence for hepatitis B vaccine, and also tetanus and influenza vaccination, was extracted from the automated database. Conditional logistic regression was used to estimate the odds ratios for onset of multiple sclerosis in the vaccinated subjects. There were 11 cases (6.7%) that received at least one hepatitis B vaccination ≤3 years before the date of first neurological symptoms compared with 39 (2.4%) in controls. The odds ratio for the onset of multiple sclerosis ≤3 years following vaccination was 3.1 (95% CI 1.5–6.3) for hepatitis B vaccination; 0.6 (95% CI 0.4–1.0) for tetanus; and 1.0 (95% CI 0.5–2.0) for influenza vaccination (Tables 4.30 and 4.31 ). The number of hepatitis B immunizations did not correlate with an increased risk of multiple sclerosis.
Table 4.31.
Literature data on hepatitis B vaccination and multiple sclerosis
| Study | Number of patients and health status | Assessment of exposure to hepatitis B vaccination | Time window of exposure to hepatitis B vaccination before the neurological episode | Odds ratio (95% CI) |
|---|---|---|---|---|
| Case–control studies with occurrence of first demyelinating episode or onset of multiple sclerosis in cases vs. controls | ||||
| Touzé et al 2000 |
121 first demyelinating episodes | Telephone interview | 60 days | 1.7 (0.5–6.3) |
| 121 neurological controls | Copy of vaccination certificate: 17% | 61–180 days | 1.5 (0.5–5.3) | |
|
|
|
All patients: | |
| 60 days | 1.8 (0.7–4.6) | |||
| 2–12 months | 0.9 (0.4–2.0) | |||
| Only patients referring to their vaccination certificate during phone interview: | ||||
| 60 days | 1.4 (0.4-4.5) | |||
| 2–12 months | 1.0 (0.6-1.9) | |||
| Sturkenboom et al 1999; 2000 |
481 first demyelinating episodes | Automated database | 12 months | 1.5 (0.6–3.9) |
| ?Controls (≤6 per case) | Any time | 1.4 (0.8–2.4) | ||
| Ascherio et al 2001 |
|
Vaccination certification: 100% |
Analysis using only vaccination certified data: | |
| 2 years | 0.7 (0.3–1.8) | |||
| Any time | 0.9 (0.5–1.6) | |||
| Analysis using only vaccination self-reported data: | ||||
| 2 years | 1.9 (1.1–3.3) | |||
| Any time | 1.2 (0.8–1.7) | |||
| N. DeStefano et al 2003 |
|
|
1 year | 0.8 (0.4–1.8) |
| Any time | 0.9 (0.6–1.5) | |||
| Hernán et al 2004 |
|
Automated database |
1 year | 1.8 (0.5–6.3) |
| 3 years | 3.1 (1.5–6.3) | |||
| Case–control studies with vaccinated cases vs. non-vaccinated controls, and occurrence of first demyelinating episode or onset of multiple sclerosis | ||||
| Zipp et al 1999 |
|
Automated database |
6 months | 1.3 (0.4–4.8) |
| 1 year | 1.0 (0.3–3.0) | |||
| 2 years | 1.0 (0.4–2.4) | |||
| 3 years | 0.9 (0.4–2.1) | |||
|
|
School-based vaccination programme | Any time | 0.6a |
| Relapse of multiple sclerosis | ||||
| Confavreux et al 2001 |
|
|
2 months | 0.7 (0.2–2.2) |
multiple sclerosis according to C.M. Poser et al (1983) criteria.
Crude relative risk estimated from available data in the original manuscript.
The publication of these results revived the controversy in France. However, the study has its limitations. The selection process led to a small sample size yielding only 11 informative cases, further reducing to 3 for vaccination ≤1 year before onset of multiple sclerosis; the 95% confidence intervals are correspondingly wide. Although the index date for the outcome assessment was taken as that on which neurological symptoms first occurred, the date retrieved from computer records was, on average, 24 months later than that recorded on paper records, casting some doubt on the quality of data in the GPRD system. Of the 713 individuals identified within the database as having a diagnosis of multiple sclerosis, only 438 (61%) survived the review of the paper-based medical records to enter the second stage, and only 163 (23%) met the next requirement of having a minimum duration on the database before the onset of multiple sclerosis. Eventually, there were only 11 informative cases (1.5%) who received hepatitis B immunization ≤3 years before the onset of multiple sclerosis. Such drastic culling is fraught with methodological problems and inadvertent bias. Furthermore, so few cases of multiple sclerosis were vaccinated against hepatitis B virus (and this holds also for influenza and tetanus) raising the possibility of incomplete ascertainment of vaccine status in the database. This is not much of a surprise as, for instance, vaccination often takes place in occupational health departments and ‘travel clinics’. Quite possibly, only those vaccinations received within the context of general practice were entered into the database. Without cross-validation of database and paper records, the results, which differ markedly from those observed in other studies, cannot be considered as definitive (Naismith and Cross 2004).
The recombinant hepatitis B vaccine is a noninfectious viral vaccine derived from hepatitis B surface antigen (HBsAg) produced in genetically engineered yeast cells (Duclos 2003; Hernán et al 2004). The suggestion that epitopes represented in the vaccine show molecular mimicry with myelin proteins is not confirmed (Gran et al 2000). Therefore, it is unclear how such a vaccine could trigger an immunological process leading to multiple sclerosis. The vaccine contains an adjuvant, aluminium hydroxyphosphate sulfate, also present in other vaccines, such as tetanus vaccine. It is unlikely that this is responsible for the hypothetical adverse effect of hepatitis B vaccination because there are no claims for an increased risk of multiple sclerosis following its administration. Nor can we blame thiomersal, an ethyl mercury preservative used routinely in vaccines, acting directly or through a rise in blood concentrations of mercury (Pichichero et al 2002).
Familial risks
Although this seems to us a somewhat contrived consideration, Touzé et al (2000) recorded the rate of familial multiple sclerosis in patients whose disease appeared after vaccination, hepatitis B included. At 7%, this is lower than generally accepted figures. Conversely, considering the 1110 cases of central demyelinating diseases, 898 of which could be diagnosed as multiple sclerosis, and reported to French national authorities by 31st December 2002, a family history of multiple sclerosis did not appear to affect the risk of initial symptoms in a previously unaffected individual following hepatitis B vaccination (www.agmed.sante.gouv.fr).
Vaccination and multiple sclerosis: a summary
Our position is that vaccinations in general and hepatitis B vaccination in particular are not a risk factor for the onset or relapse of multiple sclerosis. The most plausible explanation for the reported examples is coincidence not causality. Therefore, there is no reason to advise:
-
•
people with multiple sclerosis to avoid vaccinations, including hepatitis B: it makes sense to wait for a relatively silent period of the disease, free from relapse for 12 months; and patients receiving immunosuppressive drugs should have a higher threshold for avoiding vaccinations with live components
-
•
relatives of patients with multiple sclerosis, notably children, to avoid vaccinations, hepatitis B included
-
•
the general population to avoid hepatitis B vaccination.
This position is endorsed by the American Academy of Neurology (Fenichel 1999; Rutschmann et al 2002), the Institute of Medicine of the USA, the National multiple sclerosis Society of the USA (www.nmss.org), the World Health Organization (www.who.int), the Agence Française de Sécurité Sanitaire des Produits de Santé (www.agmed.sante.gouv.fr), the French Conférence de Consensus sur la sclérose en plaques (2001), the Réunion de Consensus sur la vaccination contre le virus de l’ hépatite B (www.anaes.fr), and individual commentators (Duclos 2003; Expanded Programme on Immunization 1997; Global Advisory Committee on Vaccine Safety 2002; Noseworthy et al 2000a; Poland and Jacobson 2004; Stratton et al 2002). These opinions are supported by the lack of evidence for increased MRI activity in patients with multiple sclerosis following influenza (Michielsens et al 1990; Salvetti et al 1995) and Calmette–Guérin bacillus vaccination (Ristori et al 1999). Although we consider the evidence to be conclusive, it is the case that longitudinal assessment of MRI activity in patients with multiple sclerosis before and after hepatitis B immunization is not yet available. Our position is more reserved on the suggestion that some vaccines are protective for the onset and activity of multiple sclerosis. But that said, in a single crossover study involving 12 patients with relapsing–remitting disease, Calmette–Guérin bacillus vaccination has been found to be associated with a 57% reduction in MRI activity (Ristori et al 1999) and a 54% reduction in the evolution of new enhancing lesions to hypointense T1 lesions (Paolillo et al 2003). Furthermore, tetanus vaccine has consistently been found in large epidemiological studies to be associated with a decreased risk of onset (DeStefano et al 2003; Hernán et al 2004) and relapse (Confavreux et al 2001) of multiple sclerosis (see Table 4.30).
CONCLUSION
Our knowledge of the natural history of multiple sclerosis has made steady progress over the last few decades. Now, the overall course and prognosis are clearly delineated with consistent results available from the different representative cohorts set up since the 1970s. In turn, these registers depend on pioneering efforts developed from the 1950s in northern Europe, the United Kingdom and Germany for collecting cases and issuing statistical descriptions of the clinical aspects and disease morbidity. The progressive acknowledgement of epidemiological standards for comprehensive description of the disease has provided another decisive step, as has the standardization and computerization of medical data, and the adoption of accepted and validated scales describing the course, diagnostic classifications and statistical techniques accounting for censored patients. Several statements can now be made with reasonable confidence:
-
•
multiple sclerosis is characterized by a relapsing–remitting onset in 85% of the patients contrasting with a progressive onset in the remaining 15%.
-
•
With time, the majority of cases with a relapsing–remitting onset convert to secondary progression, and the median time interval for conversion is around 19 years.
-
•
Relapses persist in around 40% of cases during the progressive phase, be this primary or secondary.
-
•
Clinically detectable relapses have only a marginal effect on the accumulation of irreversible disability.
-
•
For a representative population of patients, it takes a median time of 8, 20 and 30 years to reach the irreversible disability levels of DSS 4, 6 and 7, respectively.
-
•
It takes much longer for cases with a relapsing–remitting onset than those with progressive onset to reach levels of irreversible disability, but median ages at assignment of the irreversible disability levels of DSS 4, 6 and 7 are around 42, 53 and 63 years of age, irrespective of the initial course.
-
•
Onset of the relapsing–remitting and progressive phases, like onset of irreversible disability, is influenced by current age.
-
•
Life expectancy is only marginally reduced by the disease.
These observational data help discussions with patients and their relatives, but also inform health care and insurance systems. They support the adoption of a more comprehensive classification of disease course. They have important implications for understanding disease mechanisms, suggesting that multiple sclerosis is a one stage disorder, with a tight intermingling of acute focal recurrent inflammation and diffuse chronic progressive neurodegeneration from the outset, despite the distinctive clinical course comprising a relapsing–remitting phase followed by chronic progression.
Because the phenotype and course of multiple sclerosis are age dependent, relapsing–remitting disease can be regarded as multiple sclerosis in which insufficient time has elapsed for the conversion to secondary progression; secondary progressive forms as relapsing–remitting multiple sclerosis that has ‘grown older’; and progressive from onset disease as multiple sclerosis ‘amputated’ from the usual preceding relapsing–remitting phase. Times to reach disability milestones, and the ages at which these landmarks are reached, follow a predefined schedule not obviously influenced by relapses, whenever they may occur, or by the initial course of the disease, whatever its phenotype. This leads to a unifying concept of the disease in which primary and secondary progression might be regarded as essentially similar. This formulation resonates with the evidence from genetic analysis of familial multiple sclerosis, which can be summarized as indicating that one set of genetic factors determines susceptibility but others increase the probability of progression, either from onset or after a period of relapses and remissions (see Chapter 3). From the clinical and statistical position, there are arguments in favour of considering multiple sclerosis as one disease with different clinical phenotypes rather than an entity encompassing several distinct diseases, each having a different aetiology and mechanism – the position of complexity rather than true heterogeneity (see Chapter 14).
It might be considered somewhat provocative to propose a unitary hypothesis when the clinical course is so obviously characterized by a relapsing–remitting phase followed by a progression in the majority of the patients with multiple sclerosis. This unifying concept derived from the statistical analysis of general populations does not preclude considerable variation amongst individuals in the dynamics of neurodegeneration and, in consequence, irreversible disability accumulation. The following position stated more than half a century ago still seems relevant:
Clinical and pathological evidence suggest that the chronic progressive type of the disease does not differ essentially from the more usual remitting and relapsing form, in that fresh symptoms may occur during life, in that lesions of all ages may be found post-mortem. It is not necessary therefore to postulate an alternative hypothesis of causation for these progressive cases.
McAlpine and Compston (1952)
The Lyon, France, cohort demonstrates that the influence of clinical variables observed at baseline, or early thereafter, on the accumulation of irreversible disability is limited to the time from onset of multiple sclerosis to the assignment of DSS 4. The same clinical variables do not influence the course beyond this point and into the upper echelons of disability. Therefore, the natural history of multiple sclerosis is characterized by an initial phase, of variable duration, influenced by these clinical variables; and a second phase, which proceeds independently. This suggests that when a detectable threshold of irreversible disability has been reached, the disease enters a final common pathway, where subsequent accumulation of disability becomes a self-perpetuating process, amnesic to the prior clinical history of the disease.
Interestingly, the period from onset to reaching DSS 4 takes place mainly during the relapsing–remitting phase of the disease, whereas the subsequent accumulation of irreversible disability after the assignment of DSS 4 develops mainly during the progressive phase of the disease. The clinical expression of multiple sclerosis depends, during the first phase, on relapses, which are the clinical counterpart of recurrent acute focal inflammation; during the second phase, there is a contribution from diffuse degeneration and axonal loss manifesting as progression. Clinical progression and neurodegeneration appear tightly linked in a relentless manner, whereas the clinical expression of focal inflammation essentially operates at random. As an aside, we might speculate that the correlation between particular symptoms and disease course is confounded by whether small perturbations in affected pathways do or do not produce symptoms. Some (such as optic neuritis or diplopia) tend to be declared early, whereas others are less likely to be expressed clinically and, when they do manifest, therefore get tarnished with the reputation of being harbingers of a poor prognosis.
The ‘amnesic phenomenon’ is observed wherever the detectable threshold for irreversible disability is set (Confavreux et al 2003); Coustans et al 2004), and whether or not the phase of relapses and remissions has passed (Fog and Linnemann 1970; Patzold and Pocklington 1982) and laboratory evidence for neurodegeneration is in place (Filippi et al 2003; 2004; Fox et al 2000; Ingle et al 2003; Rudick et al 1999). The clinical expression of disease mechanisms in multiple sclerosis is usually two staged: at first, neurodegeneration is clinically invisible but detectable using laboratory methods that provide more sensitivity; later, diffuse neurodegeneration dominates and this is expressed as irreversible and progressive disability. Thus, the unitary concept is explained by the interplay of recurrent focal inflammation and diffuse chronic progressive neurodegeneration.
The observational data also have important consequences for the elaboration of treatment strategies. It is now clear that immunologically active treatments do not affect the chronic degenerative process operating in multiple sclerosis, despite suppressing acute inflammation. Does this mean that multiple sclerosis is a primary neurodegenerative disease? Not in our opinion: there is too much evidence in favour of primary dysimmune mechanisms, and response to treatments that are sensibly timed. Therefore, even from the epidemiological perspective, we favour the hypothesis of an inflammatory disorder occurring in association with the propensity for neurodegeneration, and a complex postinflammatory interplay of immune mediated insults and loss of tissue integrity that may develop its own momentum.
The dividend from studies of the natural history mainly relates to groups and not the individual patient. We sense that the probabilistic statistical approach has reached its limits when using clinical predictors, and that the elaboration of mathematical models, sophisticated as they may be, will not deliver a comprehensive solution. The same will probably be true for magnetic resonance predictors and biomarkers. Only a deterministic approach, based upon measures performed serially on a given individual, is likely to provide a comprehensive account of the prognosis, allowing an individually tailored extrapolation of the observed slope of deterioration for that individual. This has already proven workable with clinical measurements, demanding as the approach may be both for the physician and patient. However, the approach has clear limitations, because the longer the period of observation, and the closer the clinical assessments, the more precise and accurate the extrapolation. This means that, at present, the answer can only be made available once the disease is already advanced, providing a post hoc prognosis of limited practical value. Methods have therefore to be developed that assess whether the bespoke approach can be made informative using all available categories of information.
For all these reasons, we consider it timely to offer a more comprehensive classification of the evolution of multiple sclerosis. The current position has great merits and makes the logical distinction between cases with primary and secondary progression (Lublin and Reingold 1996). However, this classification gathers individuals with and without relapses in the category of secondary progression. It discards progressive relapsing multiple sclerosis and reaches conclusions that are more related to acute recurrent focal inflammation than the timing of progression. Perhaps the distinction between ‘primary progressive’ and ‘progressive relapsing’ multiple sclerosis with superimposed relapses seems to derive from a classification bias. Therefore we suggest that multiple sclerosis is categorized as having two types of onset (‘exacerbating–remitting’ or ‘progressive’) and three main forms of evolution (‘relapsing–remitting’, ‘secondary progressive’ or ‘primary progressive’); this results in five subtypes depending on whether or not the progressive phase (itself primary or secondary) develops with or without relapses (‘relapsing’ vs. ‘nonrelapsing’). The scheme is summarized in Figure 4.36 .
Figure 4.36.

Classification of the course of multiple sclerosis.
Adapted from Confavreux and Vukusic (2002). © 2002, reprinted with permission of Lippincott Williams & Wilkins (lww.com).
© 2006 Lippincott Williams & Wilkins
As for the identification of factors that trigger the disease process, without disputing the existence of dramatic, although anecdotal, examples hinting at a close temporal relationship between life events and activity in multiple sclerosis, the scientific evidence supporting most of these claims is not convincing. Standing back from the details, our position is that the evidence is strong for a direct association with the postpartum period; strongly suggestive for an effect of infections; not proven for psychological stress; and unambiguously negative for physical trauma, surgery and anaesthesia, and vaccinations. With so many intercurrent events occurring on a daily basis in the life of people with multiple sclerosis, it is remarkable that any time is left over for periods not at risk.