PLOS ONE logoLink to PLOS ONE
. 2020 Apr 21;15(4):e0231488. doi: 10.1371/journal.pone.0231488

Photoacoustic imaging to localize indeterminate pulmonary nodules: A preclinical study

Chang Young Lee 1,2,*,#, Kosuke Fujino 1, Yamato Motooka 1, Alexander Gregor 1, Nicholas Bernards 1, Hideki Ujiie 1, Tomonari Kinoshita 1, Kyung Young Chung 2, Seung Hee Han 3,#, Kazuhiro Yasufuku 1,#
Editor: Gabriele Multhoff4
PMCID: PMC7173852  PMID: 32315347

Abstract

Purpose

Diagnosis and resection of indeterminate pulmonary nodules (IPNs) is a growing challenge with increased utilization of chest computed tomography. Photoacoustic (PA) -guided surgical resection with local injection of indocyanine green (ICG) may have utility for IPNs that are suspicious for lung cancer. This preclinical study explores the potential of PA imaging (PAI) to detect ICG-labeled tumors.

Materials and methods

ICG uptake by H460 lung cancer cells was evaluated in vitro. A phantom study was performed to analyze PA signal intensity according to ICG concentration and tissue thickness/depth using chicken breast. PA signals were measured up to 48 hours after injection of ICG (mixed with 5% agar) into healthy subcutaneous tissue, subcutaneous H460 tumors and right healthy lung in nude mice.

Results

Intracellular ICG fluorescence was detected in H460 cells co-incubated with ICG in vitro. The concentration dependence of the PA signal was logarithmic, and PA signal decline was exponential with increasing tissue depth. The PA signal of 2 mg/mL ICG was still detectable at a depth of 22 mm in chicken breast. The PA signal from ICG mixed with agar was detectable 48 hours post injection into subcutaneous tissue and subcutaneous H460 tumors in nude mice. Similar features of PA signals from ICG-agar in mice lung were obtained.

Conclusion

The results from this preclinical study suggests that PAI of injected ICG-agar may be beneficial for identifying deeply located tumors. These features may be valuable for IPNs.

Introduction

With continuing improvements of imaging modalities and the increased application of low-dose computed tomography (CT) for lung cancer screening, more pathology with uncertain significance is detected in the lung parenchyma [1]. Indeterminate pulmonary nodules (IPNs) raise suspicion for lung cancer and should sometimes be surgically resected for diagnosis and treatment as CT-guided fine needle aspiration, or fluoroscopy-guided transbronchial biopsy can occasionally be inconclusive [2,3] with increased complication rates [4]. Although video-assisted thoracic surgery (VATS) is known to be ideal for IPN resection [5], identifying IPNs during VATS is somewhat challenging due to limited tactile perception, underscoring the need for preoperative localization [6]. New techniques for preoperative assessments have been introduced to improve success rates of planned resection and prevent unnecessary thoracotomy [7,8]. Fluorescence-guided lung resection has improved with the injection of agents such as indocyanine green (ICG) under preoperative guidance with navigation bronchoscopy [9,10], but it is hampered by limited penetration depth [11,12] and dispersion of injected contrast agents [13,14].

Photoacoustic imaging (PAI) is based on the photoacoustic (PA) effect, in which a laser is absorbed by endogenous or exogenous absorbers and is subsequently converted into heat, leading to thermoelastic expansion and thus generates acoustic waves which are detectable by a conventional ultrasound (US) transducer [15]. This enables deep tissue imaging while maintaining optical absorption contrast [16]. PAI can penetrate as deeply as 7 cm in tissue [17], which is sufficient for many clinical applications such as breast imaging or sentinel lymph node detection [18].

Agar has been used to localize IPNs either on its own [19] or mixed with dye such as methylene blue [20]. Although liquid agar can dissolve various dye or contrast agents, it rapidly solidifies upon local tissue injection.

In this preclinical study, we investigated the possibility of PA-guided surgery with local injection of ICG mixed with agar as a fiducial marker for the detection of IPNs.

Materials and methods

In vitro study

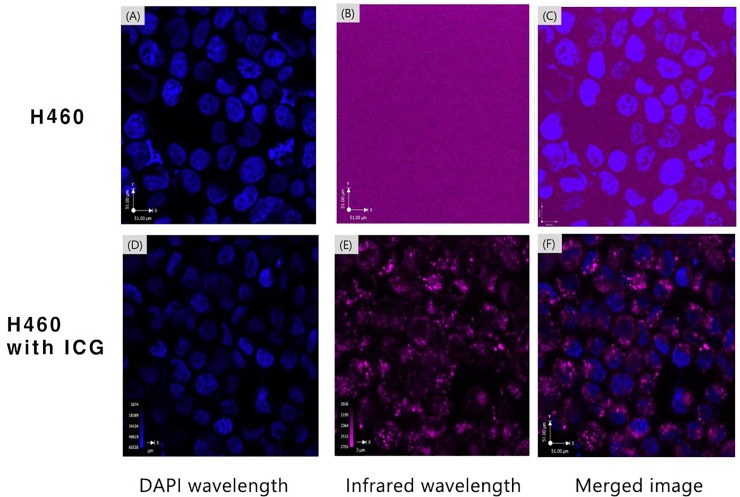
The human NSCLC cell line NCI-H460 (large cell carcinoma) was purchased from the American Type Culture Collection (Rockville, MD, USA). Cells were cultured and maintained as previously described by our laboratory [21]. H460 cells were cultured in humidified incubators at 37°C and 5% CO2. Park Memorial Institute 1640 medium (Life Technologies Inc, Carlsbad, CA) was used. The media were also supplemented with 10% heat-inactivated fetal bovine serum (FBS), 50 U/mL penicillin, and 50 mg/mL streptomycin (Pen Strep, Life Technologies Inc). The cultured cells in one dish (BD Biosciences, Franklin Lakes, NJ) were incubated with two drops of NucBlue®LiveReadyProbes (NucBlueTM, Thermo Fisher Scientific, Waltham, MA) and ICG (IC green®, Akorn, Lake Forest, IL) of 3.2 x 10⁻⁹ M/mL of medium for 30 minutes at 37°C under humidified air with 5% CO2. The cells in the other dish were incubated with NucBlue alone. The incubated cells were washed three times with phosphate-buffered saline to remove both free ICG and NucBlue. The cells were then retrieved by 10-minute exposure to 0.25% trypsin-ethylenediaminetetraacetic acid (Life Technologies Inc) to make cell suspensions. 100μl of the cell suspensions into a cuvette and centrifuged at 800 rpm for 3 minutes using Cytospin 3 (ShadonTM) to make cytologic slides. Those fluorescently stained cytologic slides were examined under Yokogawa spinning disk confocal microscopy (Carl Zeiss, Oberkochen, Germany). A DAPI specific laser (510–540 nm) was used to visualize nuclei stained with NucBlue, and an infrared (IR) wavelength laser (710–785 nm) was used to assess the presence of possible endogenous absorbers in H460 cells responding to near IR (NIR) light.

Optical properties of ICG

The absorption spectra of ICG were measured using Cary 300 Bio UV-Visible Spectrophotometer (Agilent Technologies, Santa Clara, CA). After ICG powder was dissolved in distilled water, samples were diluted with distilled water to prepare six different ICG concentrations from 0.20 to 1.20 ug/mL. The values of attenuation coefficient for each concentration of ICG were obtained at 1-nm intervals from 600 to 900 nm. Bovine serum albumin (BSA, Sigma-Aldrich, St. Louis, MO) and purified agar powder (Sigma-Aldrich) were used as solutes to observe the changes in the ICG absorption spectrum according to solute type.

Phantom study

Multiple blood vessel mimicking polymeric tubes were installed into Vevo®PHANTOM (Visualsonics, Fujifilm, Tokyo, Japan). ICG solutions mixed with distilled water and 20 mg/mL BSA were diluted to obtain eight different concentrations ranging from 0.125 to 5.0 mg/mL. These solutions were injected into the blood vessel mimicking tubes that were subjected to PAI in combination with conventional US (LZ-250, 20-MHz linear array transducer). Chicken breast muscle (6-mm-thick) which was purchased from grocery market was then placed over the tubes, the PA signal from ICG in the tubes was acquired in the range from 680 to 970 nm using a Vevo®LAZR system (Visualsonics, Fujifilm). To determine the maximum depth of signal penetration, 2.0 mg/mL of ICG in 50-uL tubes was placed at different depths. ranging from 0 to 22 mm deep)

In vivo study

All animal experiments were approved by and conducted in accordance with the Toronto General Animal Care Committee under Animal Use Protocol 5908.01. All surgery or procedure was performed under isoflurane anesthesia, and all efforts were made to minimize suffering. We inoculated a mixture of 100 ul of MatrigelTM and H460 cells (1x10⁶ cells/mouse) in the subcutaneous right flank tissue of nude female athymic mice (n = 3, Ncr-nu age 6–8 weeks; Taconic Farms Inc, Hudson, NY). Mice were monitored once a day by veterinary technicians using body conditioning scoring. Tumor formation was assessed daily, and tumor size was measured using an electronic caliper until the maximum tumor diameter reached 15 mm. Purified powdered agar was mixed with distilled water at a concentration of 5%. The agar powder was dissolved at 90°C using a microwave. Liquid agar was kept warm and transferred into a tube that was placed in hot water (>50°C) so that the agar would remain in its liquid form until injection. A 200 uL mixture of 2.0 mg/mL ICG and liquid agar was injected into healthy subcutaneous tissue in the left flank in 3 mice. Another 200 uL mixture of 2.0 mg/mL ICG and liquid agar was injected deep into subcutaneous tumor in the right flank in 3 mice. PA signals were measured up to 48 h after injecting the ICG-agar mixture. In order to identify the characteristics of ICG-agar mixture in lung tissue, 100 ul mixture of 2.0mg/mL ICG-agar was injected into right lung of nude mice (n = 2) under ultrasound guidance. 8 mice in total were used in this study and cage enrichment was provided by group housing, nestlets and PVC tubing for all mice. After all experiments, mice were euthanized with CO2.

Histologic assessment

After mice were euthanized, the tumors and surrounding subcutaneous tissue were extracted. The tissue samples were fixed with formalin and stained with hematoxylin and eosin (H&E) for observation under bright-field microscopy to assess for histologic changes following ICG-agar mixture injection.

Statistics

All graphs were plotted using R statistics (version 3.4.1).

Results

In vitro study

In both groups (NucBlue vs NucBlue + ICG), nuclei stained with NucBlue were detected under the DAPI wavelength of confocal microscopy. No signal was detected in H460 cells without ICG incubation under the IR wavelength while ICG uptake in the cell membrane or cytoplasm were detected in ICG incubated H460 cells under the IR wavelength (Fig 1).

Fig 1.

Fig 1

The images of H460 cells without ICG (A-C) and with ICG incubation (D-F) using confocal microscopy.

Absorption spectrum of ICG

ICG with a concentration of 0.2 ug/mL to 1.0 ug/mL dissolved in distilled water showed peak absorption at 780 nm (S1 Fig). The concentration dependence of ICG absorption was linear, expressed by the equation y = 0.402x + 0.045 (R2 = 0.985), where y represents the ICG absorption measured as attenuation coefficient and x represents the concentration of ICG in ug/mL (S2 Fig). The spectrum of ICG varied depending on the kinds of solute. ICG dissolved in distilled water showed peak absorption at 780 nm, while ICG mixed with BSA or agar showed peak absorption at 800 or 820 nm, respectively. Interestingly, unlike other substances, ICG mixed with agar showed a second peak at 880 nm (S3 Fig).

Phantom study

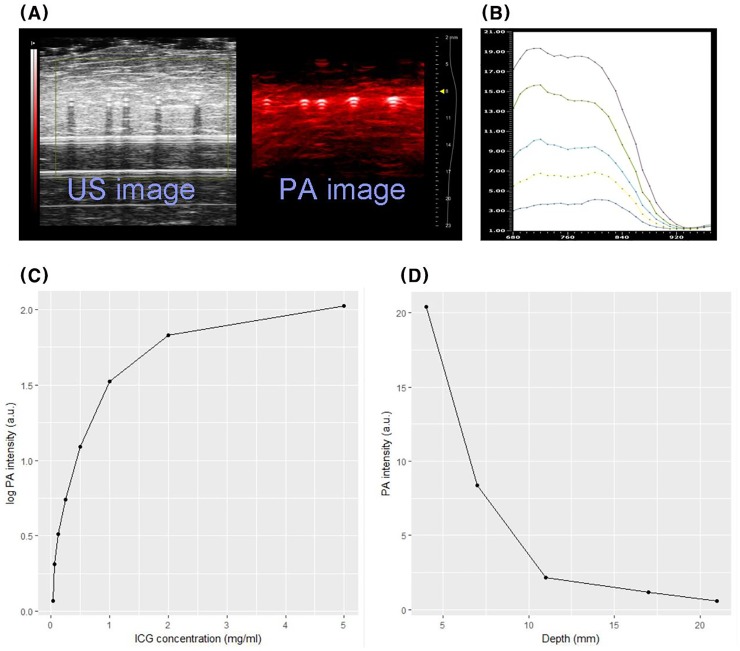
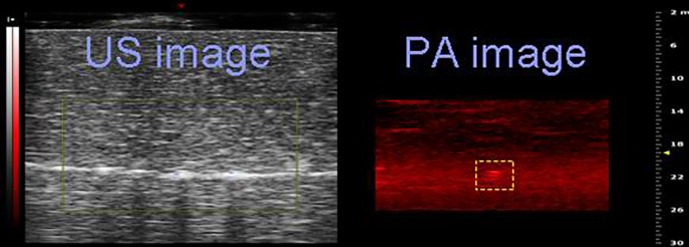
The PA signal from each tube is displayed in red with the corresponding US signal in Fig 2A. The spectra of PA signal of ICG mixed with BSA, acquired in the range of 680 to 970 nm, are illustrated in Fig 2B. Although there was a slight ICG concentration dependent difference in the spectra of PA signal, two different peak signal intensities were observed at around 700 and 800 nm. The average PA intensity measured at 800 nm was calculated in selected regions of interest and then plotted against the ICG concentration in mg/mL (Fig 2C). The PA signal intensity of ICG was logarithmically dependent on the concentration and plateaued at 2.0 mg/mL. The intensities of the PA signal for 2.0 mg/mL ICG in chicken breast muscle are shown in Fig 2D. We observed an exponential decline in the PA signal intensity with increasing muscle depth (d, mm). The intensity of the PA signal measured at a thickness of 22 mm was 40 times weaker than the signal measured at 3 mm, but it could still be visually confirmed on the PA image and corresponding US image (Fig 3). The PA signal from ICG mixed with agar was also measured. Agar itself has no meaningful PA signal, and ICG mixed with agar showed a second peak of PA intensity at ~860 nm (S4 Fig).

Fig 2.

Fig 2

A. US and PA images from ICG at various concentrations. B. PA spectrum at various concentrations. C. The graph of PA signal intensity depending on ICG concentration. D. Depth dependence PA signal from ICG in chicken breast muscle phantom.

Fig 3. US and PA image measured at 22mm depth from 2.0mg/ml ICG.

Fig 3

In vivo study

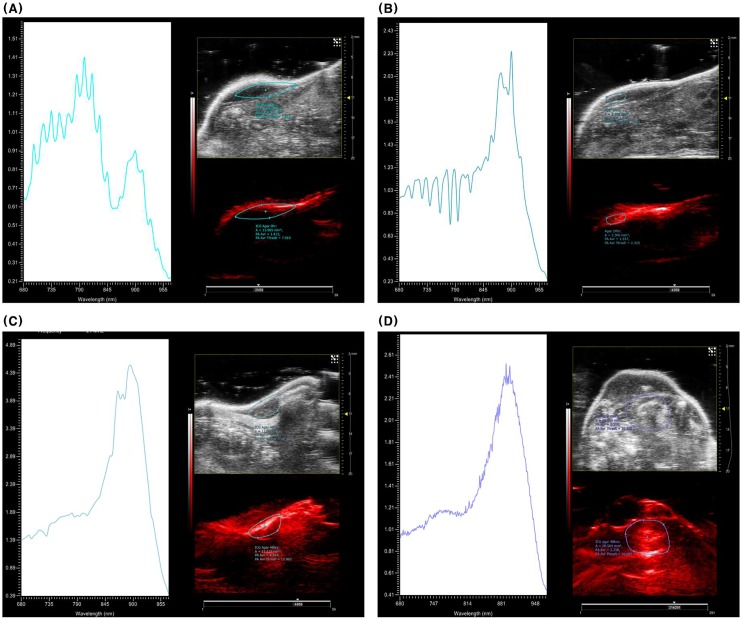
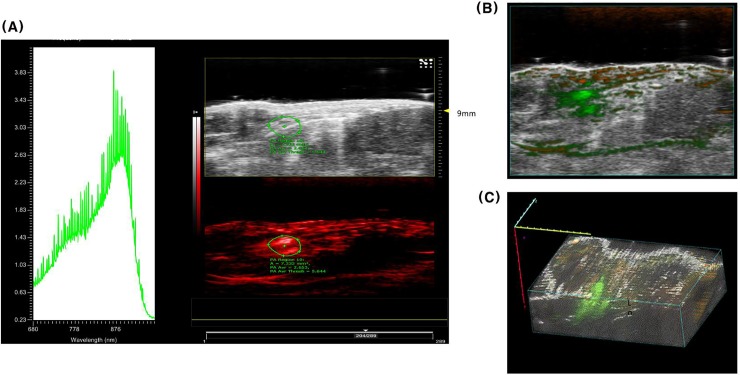
ICG-agar injected into healthy subcutaneous tissues in mice maintained its shape on US even 24h and 48 h post injection (Fig 4A–4C). Conversely, the PA signal pattern from injected ICG-agar changed over time. The PA spectrogram taken immediately following injection showed strong signal at 800 and 900 nm (Fig 4A), similar to the pattern we observed in the phantoms using the vessel mimicking tubes. At 24 h after injection, the PA signal at 800 nm gradually weakened (Fig 4B), leaving only a 900 nm peak at 48 h (Fig 4C). In addition, the strong signal at 900 nm on the PA image from ICG-agar injected deep into H460 tumors in mice was visible at 48 h, even if no clear lesion was observed with US (Fig 4D). PA spectrogram obtained 48 h after injection into mice lung showed similar pattern with that of subcutaneous model which has a 900nm peak (Fig 5A). Even if PA signals from blood (dark orange), which contains oxy or de-oxyhemoglobin, was detected in the layer of chest wall muscle, PA signal from ICG-agar (green) in right lung of mice was clearly seen on transverse overlay image (Fig 5B) and 3D rendered image (Fig 5C).

Fig 4.

Fig 4

US and PA images and corresponding PA spectrogram from injected ICG-agar into healthy subcutaneous tissue at 0hr (A), 24hr (B), and 48hr (C) Fig 4D US and PA image and spectrogram obtained from ICG agar injected deep to subcutaneous tissue H460 tumor (48hr).

Fig 5.

Fig 5

A. PA spectrogram obtained from ICG-agar 48hr after injection in mice lung. B. Transverse overlay image of mice lung with injected ICG-agar. C. 3D rendered image of mice lung with injected ICG-agar.

Histologic assessment

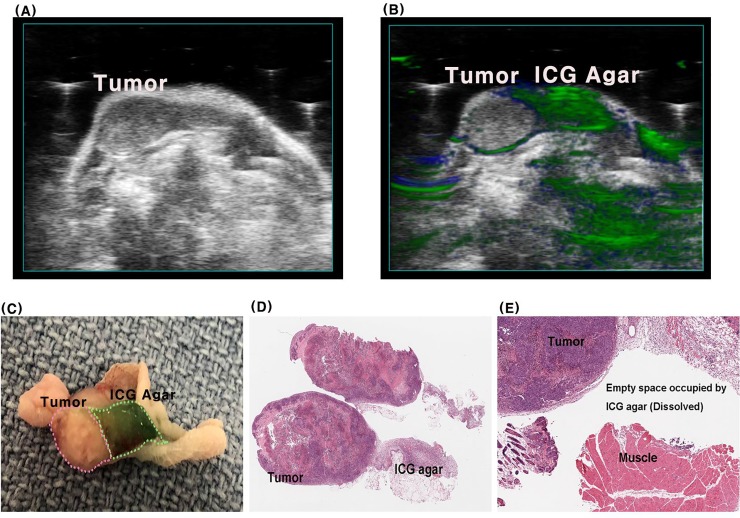
The boundary between the injected ICG-agar and H460 tumor was clearly visible in resected specimens (Fig 6A), and these delineations correlated well with PA images (Fig 6B) even though the boundary between tumor and ICG-agar was not clear on US (Fig 6C). There was none or little ICG-agar remaining in H&E-stained tissue after fixation with formalin, but the boundary of the tumor was clearly observed, and normal morphology was maintained in the surrounding healthy muscle tissue (Fig 6D and 6E).

Fig 6. Longitudinal cross section of subcutaneous tumor and ICG-agar after 48hr after injection.

Fig 6

A: US image, B: US and PA overlay image, C: Resected specimens, D, E:H&E stained slide.

Discussion

With the growing application of low-dose chest CT for lung cancer screening and regular check-ups [1,22], the detection rate of small IPNs has gradually increased. Localization during VATS resection is very difficult for non-visible nodules or non-palpable, which prolongs operation time. Preoperative localization techniques have been introduced to improve the success rates of planned resection and prevent unnecessary thoracotomy [7,8].

Among various localization methods, fluorescence-guided lung resection has improved with the injection of fluorescent agents, such as ICG under guidance with navigation bronchoscopy [9,10]. This method has advantages in reducing potential complications such as symptomatic pneumothorax or hemothorax and avoiding radiation exposure during CT-guided transthoracic localization [23,24]. However, limitations include limited penetration depth and dispersion of injected contrast agents.

Due to the scattering and absorbing nature of biological tissue, optical fluence decays rapidly with increased depth [16]. As a result, the amount of light reaching the region of interest located further away from the laser source may be insufficient to detect deeply located tumors. PAI is a nascent imaging technology based on the PA effect that was discovered by Alexander Graham Bell in 1880 [17]. This effect is due to the formation of sound waves following light absorption in an endogenous (e.g., melanin or hemoglobin) or exogenous (e.g., ICG or nanoparticles) absorber. The generated US wave can be detected with a conventional US transducer that enables deep tissue imaging while maintaining optical absorption contrast. This approach enables strong optical contrast in optically scattered biological tissue at depths <1–5 cm depending on the laser wavelength [25], optical properties of absorbers [18] and characteristics of the acoustic transducers [26].

Given IPNs deep location at 2–3 cm from visceral pleura, we employed an NIR wavelength laser for improved depth penetration. Besides melanoma, most cancer cells have few or no endogenous absorbers that can absorb the NIR wavelength [27]. This was confirmed by our confocal experiments using H460 human lung cancer cells. However, ICG incubated with H460 cells was clearly detectable with the NIR wavelength and confirmed the possibility of using ICG as an exogenous PA contrast agent [28].

Because ICG itself has a relatively low quantum yield (0.027, referring to fluorescence emission) [28], it has been adopted for cancer research studies using PAI to identify sentinel lymph nodes. However, the hydrophobicity of ICG can result in substantial concentration and environment-dependent changes in optical properties, as well as photo-instability. ICG-encapsulated nanoparticles have been explored as an option to overcome these limitations. However, one report stated that that PA signal from ICG liposome was clearly resolved to a depth of 10 mm using chicken breast muscle [29], which is not appropriate for IPN localization. Our phantom study demonstrated that the PA signal increased logarithmically without a quenching effect, which decreases the fluorescence intensity at higher ICG concentrations [9], up to 5 mg/mL. Even if an exponential decline of the PA signal intensity at a concentration of 2.0 mg/mL ICG was observed at greater depths of chicken breast muscle, the signal intensity at a depth of 22 mm could still be visible via PAI. This suggests that PAI using a high concentration of ICG would be appropriate for localizing deep IPNs.

Agar is known to retain its shape in the lung, with or without contrast agents [19,20]. We found that agar mixed with ICG maintained its shape on US images over 48 h after injection, but the PA spectrogram of injected ICG-agar was different than that of ICG mixed with BSA. This phenomenon seems to be related to the temperature dependent optical property of ICG. Mauerer et al. [30] reported temperature dependent J-aggregation at high concentrations of ICG, resulting in the absorption peak at 893 nm. ICG-agar, which was mixed in agar solution kept at 50ºC or higher just before injection, might cause a change of absorption spectrum. Furthermore, an altered pattern in the ICG-agar PA spectrogram was observed over time not only subcutaneous tissue but lung tissue in mice. We propose that the PA signal from J-aggregated ICG bound with agar might only persist for 48 h after injection, although the effect of PA signal from free ICG, which would be drained into the lymphatic system over time, was strong immediately post ICG-agar injection.

One of the desired characteristics of liquid fiducial markers is to have none or a limited effect on the tumor and surrounding tissues. Agar does not change the histologic morphology of lung tumors and surrounding tissues, either by itself [19] or after being mixed with methylene blue [20]. Although ICG can accumulate by passive tumor cell-targeting or the inherent ability of ICG to bind cell membranes, it does not affect the overall morphology or pathologic diagnosis [10,12]. Resected specimens in this study also had clear tumor margins from injected ICG-agar, and this correlated with the PA images despite the boundary being unclear on conventional US. H&E staining after fixation with formalin, which dissolved ICG-agar, did not reveal morphological changes at the tumor margin or in the surrounding tissue.

There are some limitations of this study. Although this study has been comprehensively covered in vitro, phantom and in vivo experiments using subcutaneous mice and lung mice model, but e did not examine larger animals. Further studies are therefore necessary to confirm the possibility of PAI for IPN localization using rabbits or pigs. Unlike other studies that reported a maximum penetration depth of 7 cm [17], our maximum penetration depth was shallow at 22 mm, despite the use of high ICG concentration. This is likely due to the LZ 250 (20-MHz linear array transducer) used in this study that has an optimum target depth of 10–15 mm, which is well suited for preclinical applications [26]. Future investigations should use a low-frequency transducer to identify lesions that are ≥3 cm deep. In addition, the PA spectrum of ICG-agar changed over time, even if the spectral properties remained stable 48 h after injection. Further studies using different kinds of liquid fiducial markers, such as lipiodol or PalpMarkTM for example, should be performed to minimize PA spectral changes over time.

Conclusions

This preclinical study suggests that PAI of injected ICG-agar may be useful for localizing deeply located tumors. This could be valuable for IPNs. ICG-agar maintained its shape up to 48 h post tissue injection without disrupting the histology of the tumor or surrounding tissue. The PA properties of ICG changed over time but remained detectable on PAI. These results should be validated with ICG-agar injection into large animal models such as rabbit or pig.

Supporting information

S1 Fig. The absorption spectrum of ICG dissolved in distilled water according to concentration change.

(TIF)

S2 Fig. Calibration curve for ICG in distilled water, absorbance measured at 780nm.

(TIF)

S3 Fig

ICG absorbance in distilled water (blue, dashed line), bovine serum albumin (orange, solid line) and agar (green, dotted line).

(TIF)

S4 Fig

The PA spectrogram (left), US image (right upper) and PA image (right lower). Red line shows PA spectral change of ICG agar and green line shows that of agar itself in the right image.

(TIF)

S1 Data set

(ZIP)

Data Availability

All relevant data are within the manuscript and its Supporting Information files.

Funding Statement

This research (Lee CY) was supported by Basic Science Research Program through the National Research Foundation of Korea (NRF) funded by the Ministry of Education (Grant number:2017R1D1A1B0302949714) and a faculty research grant of Yonsei University College of Medicine (Grant number:6-2016-0069). The funders had no role in study design, data collection and analysis, decision to publish or preparation of the manuscript.

References

  • 1.National Lung Screening Trial Research Team, Aberle DR, Adams AM, Berg CD, Black WC, Clapp JD, Fagerstrom RM et al. Reduced lung-cancer mortality with low-dose computed tomographic screening. N Engl J Med. 2011;365:395–409. 10.1056/NEJMoa1102873 [DOI] [PMC free article] [PubMed] [Google Scholar]
  • 2.Larscheid RC, Thorpe PE, Scott WJ. Percutaneous transthoracic needle aspiration biopsy: a comprehensive review of its current role in the diagnosis and treatment of lung tumors. Chest. 1998;114:704–709. 10.1378/chest.114.3.704 [DOI] [PubMed] [Google Scholar]
  • 3.Wang Memoli JS, Nietert PJ, Silvestri GA. Meta-analysis of guided bronchoscopy for the evaluation of the pulmonary nodule. Chest. 2012;142:385–393. 10.1378/chest.11-1764 [DOI] [PMC free article] [PubMed] [Google Scholar]
  • 4.Heerink WJ, de Bock GH, de Jonge GJ, Groen HJ, Vliegenthart R, Oudkerk M. Complication rates of CT-guided transthoracic lung biopsy: meta-analysis. Eur Radiol. 2017;27:138–148. 10.1007/s00330-016-4357-8 [DOI] [PMC free article] [PubMed] [Google Scholar]
  • 5.Congregado M, Merchan RJ, Gallardo G, Ayarra J, Loscertales J. Video-assisted thoracic surgery (VATS) lobectomy: 13 years' experience. Surg Endosc. 2008;22:1852–1857. 10.1007/s00464-007-9720-z [DOI] [PubMed] [Google Scholar]
  • 6.Nakashima S, Watanabe A, Obama T, Yamada G, Takahashi H, Higami T. Need for preoperative computed tomography-guided localization in video-assisted thoracoscopic surgery pulmonary resections of metastatic pulmonary nodules. Ann Thorac Surg. 2010;89:212–218. 10.1016/j.athoracsur.2009.09.075 [DOI] [PubMed] [Google Scholar]
  • 7.Suzuki K, Nagai K, Yoshida J, Ohmatsu H, Takahashi K, Nishimura M et al. Video-assisted thoracoscopic surgery for small indeterminate pulmonary nodules: indications for preoperative marking. Chest. 1999;115:563–568. 10.1378/chest.115.2.563 [DOI] [PubMed] [Google Scholar]
  • 8.Saito H, Minamiya Y, Matsuzaki I, Tozawa K, Taguchi K, Nakagawa T et al. Indication for preoperative localization of small peripheral pulmonary nodules in thoracoscopic surgery. J Thorac Cardiovasc Surg. 2002;124:1198–1202. 10.1067/mtc.2002.127331 [DOI] [PubMed] [Google Scholar]
  • 9.Anayama T, Qiu J, Chan H, Nakajima T, Weersink R, Daly M et al. Localization of pulmonary nodules using navigation bronchoscope and a near-infrared fluorescence thoracoscope. Ann Thorac Surg. 2015;99:224–230. 10.1016/j.athoracsur.2014.07.050 [DOI] [PubMed] [Google Scholar]
  • 10.Han KN, Kim HK. The feasibility of electromagnetic navigational bronchoscopic localization with fluorescence and radiocontrast dyes for video-assisted thoracoscopic surgery resection. J Thorac Dis. 2018;10:S739–748. 10.21037/jtd.2018.03.115 [DOI] [PMC free article] [PubMed] [Google Scholar]
  • 11.Vahrmeijer AL, Hutteman M, van der Vorst JR, van de Velde CJ, Frangioni JV. Image-guided cancer surgery using near-infrared fluorescence. Nat Rev Clin Oncol. 2013;10:507–518. 10.1038/nrclinonc.2013.123 [DOI] [PMC free article] [PubMed] [Google Scholar]
  • 12.Okusanya OT, Holt D, Heitjan D, Deshpande C, Venegas O, Jiang J et al. Intraoperative near-infrared imaging can identify pulmonary nodules. Ann Thorac Surg. 2014;98:1223–1230. 10.1016/j.athoracsur.2014.05.026 [DOI] [PMC free article] [PubMed] [Google Scholar]
  • 13.Wicky S, Mayor B, Cuttat JF, Schnyder P. CT-guided localizations of pulmonary nodules with methylene blue injections for thoracoscopic resections. Chest. 1994;106:1326–1328. 10.1378/chest.106.5.1326 [DOI] [PubMed] [Google Scholar]
  • 14.Lenglinger FX, Schwarz CD, Artmann W. Localization of pulmonary nodules before thoracoscopic surgery: value of percutaneous staining with methylene blue. AJR Am J Roentgenol. 1994;163:297–300. 10.2214/ajr.163.2.7518642 [DOI] [PubMed] [Google Scholar]
  • 15.Wang L, Yang PP, Zhao XX, Wang H. Self-assembled nanomaterials for photoacoustic imaging. Nanoscale. 2016;8:2488–2509. 10.1039/c5nr07437a [DOI] [PubMed] [Google Scholar]
  • 16.Wang LV. Multiscale photoacoustic microscopy and computed tomography. Nat Photonics. 2009;3:503–509. 10.1038/nphoton.2009.157 [DOI] [PMC free article] [PubMed] [Google Scholar]
  • 17.Ke H, Erpelding TN, Jankovic L, Liu C, Wang LV. Performance characterization of an integrated ultrasound, photoacoustic, and thermoacoustic imaging system. J Biomed Opt. 2012;17:056010 10.1117/1.JBO.17.5.056010 [DOI] [PMC free article] [PubMed] [Google Scholar]
  • 18.Garcia-Uribe A, Erpelding TN, Krumholz A, Ke H, Maslov K, Appleton C et al. Dual-Modality Photoacoustic and Ultrasound Imaging System for Noninvasive Sentinel Lymph Node Detection in Patients with Breast Cancer. Sci Rep. 2015;5:15748 10.1038/srep15748 [DOI] [PMC free article] [PubMed] [Google Scholar]
  • 19.Tsuchida M, Yamato Y, Aoki T, Watanabe T, Koizumi N, Emura I et al. CT-guided agar marking for localization of nonpalpable peripheral pulmonary lesions. Chest. 1999;116:139–143. 10.1378/chest.116.1.139 [DOI] [PubMed] [Google Scholar]
  • 20.Klijian AS. Agar blue localization of small pulmonary nodules and ground glass opacifications for thoracoscopic resection. J Thorac Dis. 2016;8:S677–680. 10.21037/jtd.2016.06.55 [DOI] [PMC free article] [PubMed] [Google Scholar]
  • 21.Nakajima T, Anayama T, Matsuda Y, Hwang DM, McVeigh PZ3, Wilson BC et al. Orthotopic lung cancer murine model by nonoperative transbronchial approach. Ann Thorac Surg. 2014;97:1771–1775. 10.1016/j.athoracsur.2014.01.048 [DOI] [PubMed] [Google Scholar]
  • 22.Field JK, Oudkerk M, Pedersen JH, Duffy SW. Prospects for population screening and diagnosis of lung cancer. Lancet. 2013;382:732–741. 10.1016/S0140-6736(13)61614-1 [DOI] [PubMed] [Google Scholar]
  • 23.Wiener RS, Schwartz LM, Woloshin S, Welch HG. Population-based risk for complications after transthoracic needle lung biopsy of a pulmonary nodule: an analysis of discharge records. Ann Intern Med. 2011;155:137–144. 10.7326/0003-4819-155-3-201108020-00003 [DOI] [PMC free article] [PubMed] [Google Scholar]
  • 24.Park CH, Han K, Hur J, Lee SM, Lee JW, Hwang SH et al. Comparative Effectiveness and Safety of Preoperative Lung Localization for Pulmonary Nodules: A Systematic Review and Meta-analysis. Chest. 2017;151:316–328. 10.1016/j.chest.2016.09.017 [DOI] [PubMed] [Google Scholar]
  • 25.Ash C, Dubec M, Donne K, Bashford T. Effect of wavelength and beam width on penetration in light-tissue interaction using computational methods. Lasers Med Sci. 2017;32:1909–1918. 10.1007/s10103-017-2317-4 [DOI] [PMC free article] [PubMed] [Google Scholar]
  • 26.Forbrich A, Heinmiller A, Zemp RJ. Photoacoustic imaging of lymphatic pumping. J Biomed Opt. 2017;22:1–6. [DOI] [PubMed] [Google Scholar]
  • 27.Strohm EM, Moore MJ, Kolios MC. Single cell photoacoustic microscopy: a review. IEEE J. Sel. Top. Quantum Electron. 2015;22: 6801215. [Google Scholar]
  • 28.Weber J, Beard PC, Bohndiek SE. Contrast agents for molecular photoacoustic imaging. Nat Methods. 2016;13:639–650. 10.1038/nmeth.3929 [DOI] [PubMed] [Google Scholar]
  • 29.Beztsinna N, Tsvetkova Y, Jose J, Rhourri-Frih B, Al Rawashdeh W, Lammers T et al. Photoacoustic imaging of tumor targeting with riboflavin-functionalized theranostic nanocarriers. Int J Nanomedicine. 2017;12:3813–3825. 10.2147/IJN.S125192 [DOI] [PMC free article] [PubMed] [Google Scholar]
  • 30.Mauerer M, Penzkofer A, Zweck J. Dimerization, J-aggregation and J-disaggregation dynamics of indocyanine green in heavy water. J. Photochem. Photohiol. B: Biol. 1998;47:68–73. [Google Scholar]

Decision Letter 0

Gabriele Multhoff

2 Jan 2020

PONE-D-19-30111

Photoacoustic Imaging to Localize Indeterminate Pulmonary Nodules: A Preclinical Study

PLOS ONE

Dear Dr Lee,

Thank you for submitting your manuscript to PLOS ONE. After careful consideration, we feel that it has merit but does not fully meet PLOS ONE’s publication criteria as it currently stands. Therefore, we invite you to submit a revised version of the manuscript that addresses the points raised during the review process.

We would appreciate receiving your revised manuscript by Feb 16 2020 11:59PM. When you are ready to submit your revision, log on to https://www.editorialmanager.com/pone/ and select the 'Submissions Needing Revision' folder to locate your manuscript file.

If you would like to make changes to your financial disclosure, please include your updated statement in your cover letter.

To enhance the reproducibility of your results, we recommend that if applicable you deposit your laboratory protocols in protocols.io, where a protocol can be assigned its own identifier (DOI) such that it can be cited independently in the future. For instructions see: http://journals.plos.org/plosone/s/submission-guidelines#loc-laboratory-protocols

Please include the following items when submitting your revised manuscript:

  • A rebuttal letter that responds to each point raised by the academic editor and reviewer(s). This letter should be uploaded as separate file and labeled 'Response to Reviewers'.

  • A marked-up copy of your manuscript that highlights changes made to the original version. This file should be uploaded as separate file and labeled 'Revised Manuscript with Track Changes'.

  • An unmarked version of your revised paper without tracked changes. This file should be uploaded as separate file and labeled 'Manuscript'.

Please note while forming your response, if your article is accepted, you may have the opportunity to make the peer review history publicly available. The record will include editor decision letters (with reviews) and your responses to reviewer comments. If eligible, we will contact you to opt in or out.

We look forward to receiving your revised manuscript.

Kind regards,

Gabriele Multhoff, Prof. Dr.

Academic Editor

PLOS ONE

Journal Requirements:

1. 

When submitting your revision, we need you to address these additional requirements.

Please ensure that your manuscript meets PLOS ONE's style requirements, including those for file naming. The PLOS ONE style templates can be found at

http://www.journals.plos.org/plosone/s/file?id=wjVg/PLOSOne_formatting_sample_main_body.pdf and http://www.journals.plos.org/plosone/s/file?id=ba62/PLOSOne_formatting_sample_title_authors_affiliations.pdf

2.  Please provide additional information about the NCI-H460 cells used in this work, including any quality control testing procedures (authentication, characterisation, and mycoplasma testing). For more information, please see http://journals.plos.org/plosone/s/submission-guidelines#loc-cell-lines.

3.  At this time, we ask that you please provide the source of the chciken breast used in this study.

4.  At this time, we request that you  please report additional details in your Methods section regarding animal care, as per our editorial guidelines:

(1) Please state the number of mice used in the study  

(2) Please provide details of animal welfare (e.g., shelter, food, water, environmental enrichment)

(3) Please describe any steps taken to minimize animal suffering and distress, such as by administering anaesthesia, during the inoculation of H460 cells

(4) Please state the specific number of H460 cells that were subcutaneously inoculated into the mice

(5) Please include the method of euthanasia  

(6) Please describe the post-operative care received by the animals, including the frequency of monitoring and the criteria used to assess animal health and well-being.

Thank you for your attention to these requests.

5.  To comply with PLOS ONE submission guidelines, in your Methods section, please provide additional information regarding your statistical analyses. For more information on PLOS ONE's expectations for statistical reporting, please see https://journals.plos.org/plosone/s/submission-guidelines.#loc-statistical-reporting.

6. PLOS requires an ORCID iD for the corresponding author in Editorial Manager on papers submitted after December 6th, 2016. Please ensure that you have an ORCID iD and that it is validated in Editorial Manager. To do this, go to ‘Update my Information’ (in the upper left-hand corner of the main menu), and click on the Fetch/Validate link next to the ORCID field. This will take you to the ORCID site and allow you to create a new iD or authenticate a pre-existing iD in Editorial Manager. Please see the following video for instructions on linking an ORCID iD to your Editorial Manager account: https://www.youtube.com/watch?v=_xcclfuvtxQ

[Note: HTML markup is below. Please do not edit.]

Reviewers' comments:

Reviewer's Responses to Questions

Comments to the Author

1. Is the manuscript technically sound, and do the data support the conclusions?

The manuscript must describe a technically sound piece of scientific research with data that supports the conclusions. Experiments must have been conducted rigorously, with appropriate controls, replication, and sample sizes. The conclusions must be drawn appropriately based on the data presented.

Reviewer #1: Partly

Reviewer #2: No

**********

2. Has the statistical analysis been performed appropriately and rigorously?

Reviewer #1: No

Reviewer #2: No

**********

3. Have the authors made all data underlying the findings in their manuscript fully available?

The PLOS Data policy requires authors to make all data underlying the findings described in their manuscript fully available without restriction, with rare exception (please refer to the Data Availability Statement in the manuscript PDF file). The data should be provided as part of the manuscript or its supporting information, or deposited to a public repository. For example, in addition to summary statistics, the data points behind means, medians and variance measures should be available. If there are restrictions on publicly sharing data—e.g. participant privacy or use of data from a third party—those must be specified.

Reviewer #1: Yes

Reviewer #2: Yes

**********

4. Is the manuscript presented in an intelligible fashion and written in standard English?

PLOS ONE does not copyedit accepted manuscripts, so the language in submitted articles must be clear, correct, and unambiguous. Any typographical or grammatical errors should be corrected at revision, so please note any specific errors here.

Reviewer #1: Yes

Reviewer #2: No

**********

5. Review Comments to the Author

Please use the space provided to explain your answers to the questions above. You may also include additional comments for the author, including concerns about dual publication, research ethics, or publication ethics. (Please upload your review as an attachment if it exceeds 20,000 characters)

Reviewer #1: The manuscript described photoacoustic (PA) imaging modality for possible detection of pulmonary nodules in lung, using ICG. ICG has been used in a variety of PA studies as an agent of choice, as standard in comparison studies, and hence authors judiciously chose it as a marker for their studies. The agar is solidfiable medium, injectable at high temperature that has been used in previous studies in pulmonary nodule detection, also taken in this study. Indeed agar has been used as phantom template by a prominent PA device manufacturer as tissue-mimicking phantom.

Hence the authors selection of agar + ICG as injectable medium for indeterminate pulmonary nodule is comprehendible. The authors indicate neither ICG nor agar affects the overall morphology or pathology of tissue, which atleast after 48h, proved by histology.

The PA generation at various concentration (ICG: 2.0 mg/mL) and at depth (upto 22 mm) was carried out which showed a logarithmic increase and exponential decrease, respectively. The authors performed phantom study with agar+ICG mixtures (as function of concentration), performed subcutaneous tumor (by intra-tumoral injection) and healthy tissue injection.

In addition, the material injected into the lung tissue and obtained PA signal after 48h. Can the PA signal be visible even after 48h, which was not carried out.

The paper is clearly well-written, yet lacks to bring up the innovation aspect. This reviewer failed understand the how the results of this study can be translated to detect pulmonary nodules. Hence an artistic (schematic) figure could help to understand how this preclinical PA imaging with injected ICG-agar predicts the localizing deeply located pulmonary nodules/tumors.

The following points need to be adressed:

1) As the PA imaging still limited with depth (and the US imaging of lung is also difficult) how you think the study can be translated.

2) 'Monomeric' ICG vs J-aggregated ICG in agar: Preparation of J-aggregated ICG was already reported (Chemical Physics 1997, 220 , 385-392). Could you please perform the characterization the latter species in agar.

3) Then, as you suggest draining characterics of 'mono ICG' was faster than 'J-aggr ICG', could it be proved by incubating both current formulation and the J-aggr ICG+agar pellet (a solidified agar+ICG) by incubating at 37C for 48h to 76h.

4) Overall the images quality is very poor; need to be post-processed to improve the quality; as well provide the spectra and graphs with clearly readable numbers.

5) Is there any study on blank agar effect on surrounding tissue of injection, please cite the pertinent references

6) The phantom image, Fig 2, extremely overlapped (high noise) does it cause signal spill-over, and over estimation. Can you comment.

7) Where is statistical evaluation of in vivo analysis.

8) Fig 5, the depth scale is missing.

9) It is known that ICG not so photostable; comment whether other reported 'stable' PA chromophores could be suited for this study.

10) Is it possible to show, in an animal model, guided injection of agar+dye in pulmonary nodule.

Reviewer #2: The main points of criticism of this manuscript pertain to (1) the confusion about the purpose of the study and (2) the unconvincing model systems used and the poor presentation of the data.

Ad 1) Even after reading the manuscript several times, it did not become clear to me which future application that preclinical study is supposed to prepare.

Is the ICG-containing agar supposed to represent a fiducial marker that is meant to aid surgical removal of suspicious nodules or is the idea that tumor cells could be labeled with ICG to facilitate their removal? For the latter case, the reader can only speculate on how selective targeting is supposed to work.

Ad 2) Numerous photoacoustic imaging studies are using ICG-labeled cells in tissue phantoms and animal models; some of them come close to a setting that could eventually be relevant for clinical applications.

None of the data presented in the current work, however, comes close to a realistic scenario of detecting ICG-labeled cells or fiducial markers (see the confusion due to conflicting information in the text described in point (1)) within lung tissue, which is an intrinsically complicated tissue to image by photoacoustics due to the high density of air-filled structures.

While in NCI-H460 cells, ICG seems to be only detected by fluorescence, neither the data from blood vessel mimicking tubes nor the chicken breast is convincing, new, or convincing.

The in vivo work was then apparently just conducted with ICG-containing agar as opposed to cells injected subcutaneously or into the lungs of mice: the data quality is bad, and it is not clear what is supposed to be learned from the data other than confirming yet one more time that highly-concentrated ICG can be localized in tissue by photoacoustics.

In general, the presentation of the spectra and images look like distorted screen-shots from a poor GUI. The scientific images are missing defined colormaps and scale bars. Just as one example, how was the color-overlay in Figure 6B computed?

There are also many linguistic weaknesses in the text.

I would thus like to encourage the authors to put more effort into presenting a consistent story and an adequate presentation of the data prior to re-submission of this work.

**********

6. PLOS authors have the option to publish the peer review history of their article (what does this mean?). If published, this will include your full peer review and any attached files.

If you choose “no”, your identity will remain anonymous but your review may still be made public.

Do you want your identity to be public for this peer review? For information about this choice, including consent withdrawal, please see our Privacy Policy.

Reviewer #1: No

Reviewer #2: No

[NOTE: If reviewer comments were submitted as an attachment file, they will be attached to this email and accessible via the submission site. Please log into your account, locate the manuscript record, and check for the action link "View Attachments". If this link does not appear, there are no attachment files to be viewed.]

While revising your submission, please upload your figure files to the Preflight Analysis and Conversion Engine (PACE) digital diagnostic tool, https://pacev2.apexcovantage.com/. PACE helps ensure that figures meet PLOS requirements. To use PACE, you must first register as a user. Registration is free. Then, login and navigate to the UPLOAD tab, where you will find detailed instructions on how to use the tool. If you encounter any issues or have any questions when using PACE, please email us at figures@plos.org. Please note that Supporting Information files do not need this step.

PLoS One. 2020 Apr 21;15(4):e0231488. doi: 10.1371/journal.pone.0231488.r002

Author response to Decision Letter 0


18 Feb 2020

Journal Requirements:

1. When submitting your revision, we need you to address these additional requirements.

Please ensure that your manuscript meets PLOS ONE's style requirements, including those for file naming. The PLOS ONE style templates can be found at

http://www.journals.plos.org/plosone/s/file?id=wjVg/PLOSOne_formatting_sample_main_body.pdf and http://www.journals.plos.org/plosone/s/file?id=ba62/PLOSOne_formatting_sample_title_authors_affiliations.pdf

-> I have rechecked additional requirements as you requested.

2. Please provide additional information about the NCI-H460 cells used in this work, including any quality control testing procedures (authentication, characterisation, and mycoplasma testing). For more information, please see http://journals.plos.org/plosone/s/submission-guidelines#loc-cell-lines.

-> As guideline recommended, a reference and repository from another company was addressed in manuscript.

3. At this time, we ask that you please provide the source of the chciken breast used in this study.

-> Chicken breast muscle was purchased from a grocery market.

4. At this time, we request that you please report additional details in your Methods section regarding animal care, as per our editorial guidelines:

(1) Please state the number of mice used in the study

-> 8 mice in total were used in this study. H406 cells were inoculated in 3mice. ICG agar was injected into another healthy 3mice and 2 mice was used for lung injection of ICG agar.

(2) Please provide details of animal welfare (e.g., shelter, food, water, environmental enrichment)

-> Cage enrichment was provided by group housing, nestlets and PVC tubing for all mice.

(3) Please describe any steps taken to minimize animal suffering and distress, such as by administering anaesthesia, during the inoculation of H460 cells

-> All surgery and procedure was performed under isoflurane anesthesia and all efforts were made to minimize suffering.

(4) Please state the specific number of H460 cells that were subcutaneously inoculated into the mice

-> H460 cells were inoculated in 3 mice.

(5) Please include the method of euthanasia

-> After all experiemtns, mice were euthanized with CO2.

(6) Please describe the post-operative care received by the animals, including the frequency of monitoring and the criteria used to assess animal health and well-being.

-> Mice were monitored by veterinary technicians once a day by veterinary technicians using body conditioning scoring.

Thank you for your attention to these requests.

5. To comply with PLOS ONE submission guidelines, in your Methods section, please provide additional information regarding your statistical analyses. For more information on PLOS ONE's expectations for statistical reporting, please see https://journals.plos.org/plosone/s/submission-guidelines.#loc-statistical-reporting.

-> All graphs were plotted using R statistics (version 3.4.1).

6. PLOS requires an ORCID iD for the corresponding author in Editorial Manager on papers submitted after December 6th, 2016. Please ensure that you have an ORCID iD and that it is validated in Editorial Manager. To do this, go to ‘Update my Information’ (in the upper left-hand corner of the main menu), and click on the Fetch/Validate link next to the ORCID field. This will take you to the ORCID site and allow you to create a new iD or authenticate a pre-existing iD in Editorial Manager. Please see the following video for instructions on linking an ORCID iD to your Editorial Manager account: https://www.youtube.com/watch?v=_xcclfuvtxQ

-> I have updated my ORCID iD in Editorial Manager.

Reviewer #1: The manuscript described photoacoustic (PA) imaging modality for possible detection of pulmonary nodules in lung, using ICG. ICG has been used in a variety of PA studies as an agent of choice, as standard in comparison studies, and hence authors judiciously chose it as a marker for their studies. The agar is solidifiable medium, injectable at high temperature that has been used in previous studies in pulmonary nodule detection, also taken in this study. Indeed agar has been used as phantom template by a prominent PA device manufacturer as tissue-mimicking phantom.

Hence the authors selection of agar + ICG as injectable medium for indeterminate pulmonary nodule is comprehendible. The authors indicate neither ICG nor agar affects the overall morphology or pathology of tissue, which atleast after 48h, proved by histology.

The PA generation at various concentration (ICG: 2.0 mg/mL) and at depth (up to 22 mm) was carried out which showed a logarithmic increase and exponential decrease, respectively. The authors performed phantom study with agar+ICG mixtures (as function of concentration), performed subcutaneous tumor (by intra-tumoral injection) and healthy tissue injection.

In addition, the material injected into the lung tissue and obtained PA signal after 48h. Can the PA signal be visible even after 48h, which was not carried out.

The paper is clearly well-written, yet lacks to bring up the innovation aspect. This reviewer failed understand the how the results of this study can be translated to detect pulmonary nodules. Hence an artistic (schematic) figure could help to understand how this preclinical PA imaging with injected ICG-agar predicts the localizing deeply located pulmonary nodules/tumors.

� Thanks for your comments and some questions.

When thoracic surgeons would encounter the patients with indeterminate pulmonary nodules (IPNs) which are not likely to being detected or palpated during minimally invasive surgery, various kinds of localization methods have been using. Recently transbronchial or transthoracic ICG injection around IPNs under CT or navigation bronchoscope guidance prior to operation has widely been accepted to see the fluorescence signal with near infrared camera during operation. However, there are two limitations in this procedure. First is penetration depth limitation of fluorescence signal that would hamper the localization of deeply located IPNs and second is the dispersion of injected ICG which might not be able to localize IPNs correctly.

Authors believe that PA technology combined with solidifiable ICG agar injection as a fiducial marker would overcome these limitations. As far as authors know, there are few studies on the utility of PA imaging to localize IPNs even if PA imaging is known to be useful for detecting sentinel lymph node or various small sized cancer such as breast cancer, melanoma or head and neck cancer.

Authors tried to comprehensibly demonstrate the possibility of PA imaging technique for IPNs from in vitro, phantom to in vivo study. However, authors agreed that this study itself would lack to draw any definitive conclusion and further study using large animal such as rabbit or pig should be necessary to incorporate this technology into clinical settings.

Authors made a schematic figure to help reviewers or readers understand how PA imaging with injected ICG agar as a fiducial marker would might be able to localize deeply located IPNs.

Figure 1. Possible clinical scenario to detect IPNs using photoacoustic imaging

The following points need to be addressed:

1) As the PA imaging still limited with depth (and the US imaging of lung is also difficult) how you think the study can be translated?

� Thanks for your comment. Maximum penetration depth on PA imaging could be affected by the frequency of US (ultrasound) transducer. In this study, 20-MHz linear array transducer was used that has optimum target depth of 10-15mm. If a low frequency US transducer would be utilized, a 3-5cm maximum penetration could be achieved like other study [17]. As you mentioned, one of concerns on PA imaging of lung would be US imaging of lung (especially inflated lung). But some researchers have developed thoracoscopic ultrasonography and have tested its efficacy with localizing sub-centimeter nodules in the porcine deflated lung as well as with obtaining sufficient sampling from lung tumors in the rabbit model (Wada H et al. Eur J Cardiothorac Surg 2016;49(2):690-7). So, authors believe that PA imaging incorporated into thoracoscopic US device in the near future` would be helpful to detect small sized nodules and ICG agar from deflated lung during operation.

2) ‘Monomeric’ ICG vs J-aggregated ICG in agar: Preparation of J-aggregated ICG was already reported (Chemical Physics 1997,220,385-392). Could you please perform the characterization the latter species in agar?

3) Then, as you suggest draining characteristics of ‘mono ICG’ was faster than ‘J-agar ICG’, could it be proved by incubating both current formulation and the J-agar pellet (a solidified agar+ICG) by incubating at 37C for 48 h to 76h.

-> Thanks for your comment, advice and ideas. I have read how to make or prepare ICG J-aggregate (IJA) from some articles. But I could not perform and complete the characterization of IJA with agar due to time limitation and lack of facility in my lab. In next experiments using rabbit, I think that we will be able to complete the characterization of IJA agar and report them.

4) Overall the image quality is very poor; need to be post-processed to improve the quality; as well provide the spectra and graphs with clearly readable numbers.

-> Thanks for your comment. The image quality has been improved and numbers in the spectrum and graphs has been changed to be readable after consulting with graphic designer.

5) Is there any study on blank agar effect on surrounding tissue of injection, please cite the pertinent references.

-> Thanks for your question. As far as authors know, there are two reports [19,20] on localization of small sized lung nodules using agar in human. Because there is no report on long term effect of agar on surrounding lung tissue because the tumor or injected agar should be completely resected during operation. However, Tuschida M et al. [19] reported that agar marker remained in place for more than 2 weeks after injection in animal models and there were no serious complications during and after injection of agar without any histologic deterioration.

6) the phantom image, Fig. 2, extremely overlapped (high noise) does it cause signal spill-over, and over estimation. Can you comment?

-> Thanks for your comment. The PA signal spill over from high dose ICG (5mg/ml) was observed at shallow depth (less than 5mm) water media. But signal spill over was not observed when small tube was put into chicken breast muscle. As you can see Fig 2.B. the spectrum of PA signal from each concentration was not overlapped and smooth, which means that there was not spill over or overestimation.

7) Where is statistical evaluation of in vivo analysis?

-> In vivo study in this article was proof of concept. And due to the request of animal usage protocol, 3 mice were used in each time point which was too small to draw any statistical conclusions.

8) Fig. 5. The depth scale is missing

-> The depth scale was added in Fig. 5.

9) It is known that ICG not so photostable; comment whether other reported ‘stable’ PA chromophores could be suited for this study.

-> Thanks for your comment. As you mentioned, ICG itself is not so photostable, which means that ICG that was exposed to light could be photobleached with time. Authors tested ICG liposome, which is known to be more photostable than ICG, as PA chromophores. However, PA signal disappeared at the 10mm depth of chicken breast muscle probably due to the small amount of ICG (about 100ug/ml) in liposomal ICG. That is why author have used relatively high concentration ICG. Even if the photostability of ICG agar in phantom model was not performed in this study, strong PA signal from ICG combined agar was still detected 48 hrs after injection into mouse, indicating significant photobleaching did not occur.

10) Is it possible to show, in an animal model, guided injection of agar+dye in pulmonary nodule.

-> I added a photo showing US guided transthoracic injection of ICG agar into lung without any tumor. Even if lung tumor model in mice could be developed, small nodule could not be detected with US. That’s why ICG agar was injected into healthy lung without tumor.

Reviewer #2: The main points of criticism of this manuscript pertain to (1) the confusion about the purpose of the study and (2) the unconvincing model systems used and the poor presentation of the data.

Ad 1) Even after reading the manuscript several times, it did not become clear to me which future application that preclinical study is supposed to prepare.

Is the ICG-containing agar supposed to represent a fiducial marker that is meant to aid surgical removal of suspicious nodules or is the idea that tumor cells could be labeled with ICG to facilitate their removal? For the latter case, the reader can only speculate on how selective targeting is supposed to work.

� Thanks for your comment and question. To help reviewers and readers understand how PA imaging and ICG agar as a liquid fiducial marker for IPNs during operation, possible clinical scenario was added as follows. ICG itself has been being used for localization of IPNs (small lung nodules) during minimally invasive surgery. But ICG has a tendency to being dispersed and being washed out quickly, which would some drawbacks of ICG as a fiducial marker. To overcomes these limitation, ICG agar was made and tested using mice model. Because the fluorescence signal of ICG agar from more than 5mm depth would not be able to being detected due to scattering, the possibility of PA imaging for detection of ICG agar was explored in this study.

Ad 2) Numerous photoacoustic imaging studies are using ICG-labeled cells in tissue phantoms and animal models; some of them come close to a setting that could eventually be relevant for clinical applications.

None of the data presented in the current work, however, comes close to a realistic scenario of detecting ICG-labeled cells or fiducial markers (see the confusion due to conflicting information in the text described in point (1)) within lung tissue, which is an intrinsically complicated tissue to image by photoacoustics due to the high density of air-filled structures.

While in NCI-H460 cells, ICG seems to be only detected by fluorescence, neither the data from blood vessel mimicking tubes nor the chicken breast is convincing, new, or convincing.

The in vivo work was then apparently just conducted with ICG-containing agar as opposed to cells injected subcutaneously or into the lungs of mice: the data quality is bad, and it is not clear what is supposed to be learned from the data other than confirming yet one more time that highly-concentrated ICG can be localized in tissue by photoacoustics.

� Thanks for your comment. As you mentioned, several ICG labeled cells or nanoparticles were studied and reported. Authors also tested ICG liposome, which is known to be more photostable than ICG, as PA chromophores. However, PA signal disappeared at the 10mm depth of chicken breast muscle probably due to the small amount of ICG (about 100ug/ml) in liposomal ICG. That is why author have used relatively high concentration ICG. Even if the photostability of ICG agar in phantom model was not performed, strong PA signal from ICG combined agar was still detected 48 hrs after injection into mouse, indicating significant photobleaching did not occur.

� As you mentioned, one of concerns on PA imaging of lung would be US imaging of lung (especially inflated lung). But some researchers have developed thoracoscopic ultrasonography and have tested its efficacy with localizing sub-centimeter nodules in the porcine deflated lung as well as with obtaining sufficient sampling from lung tumors in the rabbit model (Wada H et al. Eur J Cardiothorac Surg 2016;49(2):690-7). So, authors believe that PA imaging incorporated into thoracoscopic US device in the near future` would be helpful to detect injected ICG agar as a fiducial marker from deflated lung during operation.

In general, the presentation of the spectra and images look like distorted screen-shots from a poor GUI. The scientific images are missing defined colormaps and scale bars. Just as one example, how was the color-overlay in Figure 6B computed?

There are also many linguistic weaknesses in the text.

� Thanks for your comment. The image quality has been improved and numbers in the spectrum and graphs has been changed to be readable after consulting with graphic designer. PA images was automatically overlaid to US image in the machine itself.

Attachment

Submitted filename: Respone to reviewer letter .docx

Decision Letter 1

Gabriele Multhoff

11 Mar 2020

PONE-D-19-30111R1

Photoacoustic Imaging to Localize Indeterminate Pulmonary Nodules: A Preclinical Study

PLOS ONE

Dear Dr Lee,

Thank you for submitting your manuscript to PLOS ONE. After careful consideration, we feel that it has merit but does not fully meet PLOS ONE’s publication criteria as it currently stands. Therefore, we invite you to submit a revised version of the manuscript that addresses the points raised during the review process.

We would appreciate receiving your revised manuscript by Apr 25 2020 11:59PM. When you are ready to submit your revision, log on to https://www.editorialmanager.com/pone/ and select the 'Submissions Needing Revision' folder to locate your manuscript file.

If you would like to make changes to your financial disclosure, please include your updated statement in your cover letter.

To enhance the reproducibility of your results, we recommend that if applicable you deposit your laboratory protocols in protocols.io, where a protocol can be assigned its own identifier (DOI) such that it can be cited independently in the future. For instructions see: http://journals.plos.org/plosone/s/submission-guidelines#loc-laboratory-protocols

Please include the following items when submitting your revised manuscript:

  • A rebuttal letter that responds to each point raised by the academic editor and reviewer(s). This letter should be uploaded as separate file and labeled 'Response to Reviewers'.

  • A marked-up copy of your manuscript that highlights changes made to the original version. This file should be uploaded as separate file and labeled 'Revised Manuscript with Track Changes'.

  • An unmarked version of your revised paper without tracked changes. This file should be uploaded as separate file and labeled 'Manuscript'.

Please note while forming your response, if your article is accepted, you may have the opportunity to make the peer review history publicly available. The record will include editor decision letters (with reviews) and your responses to reviewer comments. If eligible, we will contact you to opt in or out.

We look forward to receiving your revised manuscript.

Kind regards,

Gabriele Multhoff, Prof. Dr.

Academic Editor

PLOS ONE

Additional Editor Comments (if provided):

Dear authors

I could not find a revised version of the Figures in a better quality. Please provide this in the next revision.

[Note: HTML markup is below. Please do not edit.]

Reviewers' comments:

Reviewer's Responses to Questions

Comments to the Author

1. If the authors have adequately addressed your comments raised in a previous round of review and you feel that this manuscript is now acceptable for publication, you may indicate that here to bypass the “Comments to the Author” section, enter your conflict of interest statement in the “Confidential to Editor” section, and submit your "Accept" recommendation.

Reviewer #1: All comments have been addressed

**********

2. Is the manuscript technically sound, and do the data support the conclusions?

The manuscript must describe a technically sound piece of scientific research with data that supports the conclusions. Experiments must have been conducted rigorously, with appropriate controls, replication, and sample sizes. The conclusions must be drawn appropriately based on the data presented.

Reviewer #1: Partly

**********

3. Has the statistical analysis been performed appropriately and rigorously?

Reviewer #1: No

**********

4. Have the authors made all data underlying the findings in their manuscript fully available?

The PLOS Data policy requires authors to make all data underlying the findings described in their manuscript fully available without restriction, with rare exception (please refer to the Data Availability Statement in the manuscript PDF file). The data should be provided as part of the manuscript or its supporting information, or deposited to a public repository. For example, in addition to summary statistics, the data points behind means, medians and variance measures should be available. If there are restrictions on publicly sharing data—e.g. participant privacy or use of data from a third party—those must be specified.

Reviewer #1: No

**********

5. Is the manuscript presented in an intelligible fashion and written in standard English?

PLOS ONE does not copyedit accepted manuscripts, so the language in submitted articles must be clear, correct, and unambiguous. Any typographical or grammatical errors should be corrected at revision, so please note any specific errors here.

Reviewer #1: Yes

**********

6. Review Comments to the Author

Please use the space provided to explain your answers to the questions above. You may also include additional comments for the author, including concerns about dual publication, research ethics, or publication ethics. (Please upload your review as an attachment if it exceeds 20,000 characters)

Reviewer #1: The authors attempted to address, however not satisfactorily, some of the questions raised earlier.

a) The quality of PA-images and spectra is not suitable for publication. If the visible quality of those images itself is difficult to perceive, how one can gain added value by using PA-image guided surgery in such ICG-agarose.

b) Manuscript lacks to bring out the advantage of using PA-image guided surgery.

**********

7. PLOS authors have the option to publish the peer review history of their article (what does this mean?). If published, this will include your full peer review and any attached files.

If you choose “no”, your identity will remain anonymous but your review may still be made public.

Do you want your identity to be public for this peer review? For information about this choice, including consent withdrawal, please see our Privacy Policy.

Reviewer #1: No

[NOTE: If reviewer comments were submitted as an attachment file, they will be attached to this email and accessible via the submission site. Please log into your account, locate the manuscript record, and check for the action link "View Attachments". If this link does not appear, there are no attachment files to be viewed.]

While revising your submission, please upload your figure files to the Preflight Analysis and Conversion Engine (PACE) digital diagnostic tool, https://pacev2.apexcovantage.com/. PACE helps ensure that figures meet PLOS requirements. To use PACE, you must first register as a user. Registration is free. Then, login and navigate to the UPLOAD tab, where you will find detailed instructions on how to use the tool. If you encounter any issues or have any questions when using PACE, please email us at figures@plos.org. Please note that Supporting Information files do not need this step.

PLoS One. 2020 Apr 21;15(4):e0231488. doi: 10.1371/journal.pone.0231488.r004

Author response to Decision Letter 1


17 Mar 2020

Reviewer #1: The author attempted to address, however, not satisfactorily, some of the questions raised earlier.

a) The quality of PA-images and spectra is not suitable for publication. If the visible quality of those images itself is difficult to perceive, how one can gain added value by using PA-image guided surgery in such ICG-agarose.

� Thanks for your comment. The PA image and spectra in current study were semi-automatically obtained from Vevo®LAZR system (Visualsonics, Fujifilm) and were submitted in this manuscript without any modification or manipulation to maintain the truth and reality of data. Unfortunately, authors was not able to get the PA images or spectra with more quality than those already submitted.

b) Manuscript lacks to bring out the advantage of using PA-image guided surgery.

� I partly agree with your comment. As far as I know, this study is a first attempt to explore the possibility of PA imaging technology combined with ICG-agar to detect or localize small lung nodule. Because of size limitation, I was not able to demonstrate clinically relevant lung cancer model using mice to prove the advantage of PA image guided surgery in this study. Recently, authors are developing lung cancer model using rabbit for further study. We hope that these results will be reporting soon.

Attachment

Submitted filename: Respond to reviewer II.docx

Decision Letter 2

Gabriele Multhoff

25 Mar 2020

Photoacoustic Imaging to Localize Indeterminate Pulmonary Nodules: A Preclinical Study

PONE-D-19-30111R2

Dear Dr. Lee,

We are pleased to inform you that your manuscript has been judged scientifically suitable for publication and will be formally accepted for publication once it complies with all outstanding technical requirements.

Within one week, you will receive an e-mail containing information on the amendments required prior to publication. When all required modifications have been addressed, you will receive a formal acceptance letter and your manuscript will proceed to our production department and be scheduled for publication.

Shortly after the formal acceptance letter is sent, an invoice for payment will follow. To ensure an efficient production and billing process, please log into Editorial Manager at https://www.editorialmanager.com/pone/, click the "Update My Information" link at the top of the page, and update your user information. If you have any billing related questions, please contact our Author Billing department directly at authorbilling@plos.org.

If your institution or institutions have a press office, please notify them about your upcoming paper to enable them to help maximize its impact. If they will be preparing press materials for this manuscript, you must inform our press team as soon as possible and no later than 48 hours after receiving the formal acceptance. Your manuscript will remain under strict press embargo until 2 pm Eastern Time on the date of publication. For more information, please contact onepress@plos.org.

With kind regards,

Gabriele Multhoff, Prof. Dr.

Academic Editor

PLOS ONE

Additional Editor Comments (optional):

Reviewers' comments:

Acceptance letter

Gabriele Multhoff

9 Apr 2020

PONE-D-19-30111R2

Photoacoustic Imaging to Localize Indeterminate Pulmonary Nodules: A Preclinical Study

Dear Dr. Lee:

I am pleased to inform you that your manuscript has been deemed suitable for publication in PLOS ONE. Congratulations! Your manuscript is now with our production department.

If your institution or institutions have a press office, please notify them about your upcoming paper at this point, to enable them to help maximize its impact. If they will be preparing press materials for this manuscript, please inform our press team within the next 48 hours. Your manuscript will remain under strict press embargo until 2 pm Eastern Time on the date of publication. For more information please contact onepress@plos.org.

For any other questions or concerns, please email plosone@plos.org.

Thank you for submitting your work to PLOS ONE.

With kind regards,

PLOS ONE Editorial Office Staff

on behalf of

Prof. Gabriele Multhoff

Academic Editor

PLOS ONE

Associated Data

    This section collects any data citations, data availability statements, or supplementary materials included in this article.

    Supplementary Materials

    S1 Fig. The absorption spectrum of ICG dissolved in distilled water according to concentration change.

    (TIF)

    S2 Fig. Calibration curve for ICG in distilled water, absorbance measured at 780nm.

    (TIF)

    S3 Fig

    ICG absorbance in distilled water (blue, dashed line), bovine serum albumin (orange, solid line) and agar (green, dotted line).

    (TIF)

    S4 Fig

    The PA spectrogram (left), US image (right upper) and PA image (right lower). Red line shows PA spectral change of ICG agar and green line shows that of agar itself in the right image.

    (TIF)

    S1 Data set

    (ZIP)

    Attachment

    Submitted filename: Respone to reviewer letter .docx

    Attachment

    Submitted filename: Respond to reviewer II.docx

    Data Availability Statement

    All relevant data are within the manuscript and its Supporting Information files.


    Articles from PLoS ONE are provided here courtesy of PLOS

    RESOURCES