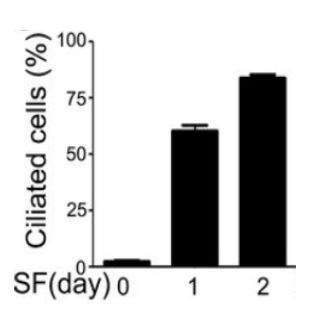
Author response image 2. A bar graph comparing the percentage of ciliated RPE-1 cells after serum starvation (SF) for 24 hour (1 day) and 48 hours (2 days).

Figure excerpted from figure 1C of our previous work (PMID31455668).

Figure excerpted from figure 1C of our previous work (PMID31455668).