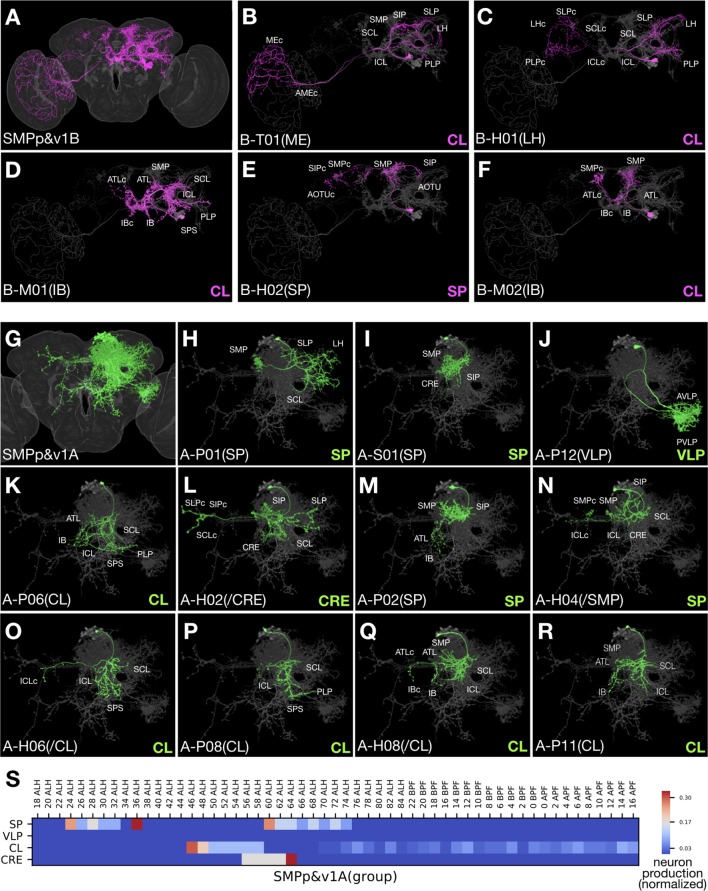
Figure 6. Clonally related neurons show diverse topology.
(A) All identified SMPp&v1B (Noff) neuron types merged onto the standard fly brain template. (B–F) Serially derived single neuron types (magenta) shown in the context of all identified SMPp&v1B neuron types merged together (grey). Note presence of T-, M-, H-topolgy neurons with comparable ipsilateral elaborations. (G) All identified SMPp&v1A (Non) neuron types merged onto the standard fly brain template. (H–R) Serially derived single neuron types (green) shown in the context of all identified SMPp&v1A neuron types merged together (grey). Note presence of P-, S-, H-topology neurons in the same hemilineage, and similarities among certain S-, P-, and H-topology neurons (I,M,N). (S) Heatmap of sample distribution of the morphological groups of SMPp&v1A neurons (Y-axis) over time of clone induction (X-axis). The sample distribution was normalized to one for each separate production window. Note presence of two recovery windows for both SP and CL groups, and no detectable recovery window (yielding six or more samples from an uninterrupted interval spanning at least two time points) for the minor VLP group.

