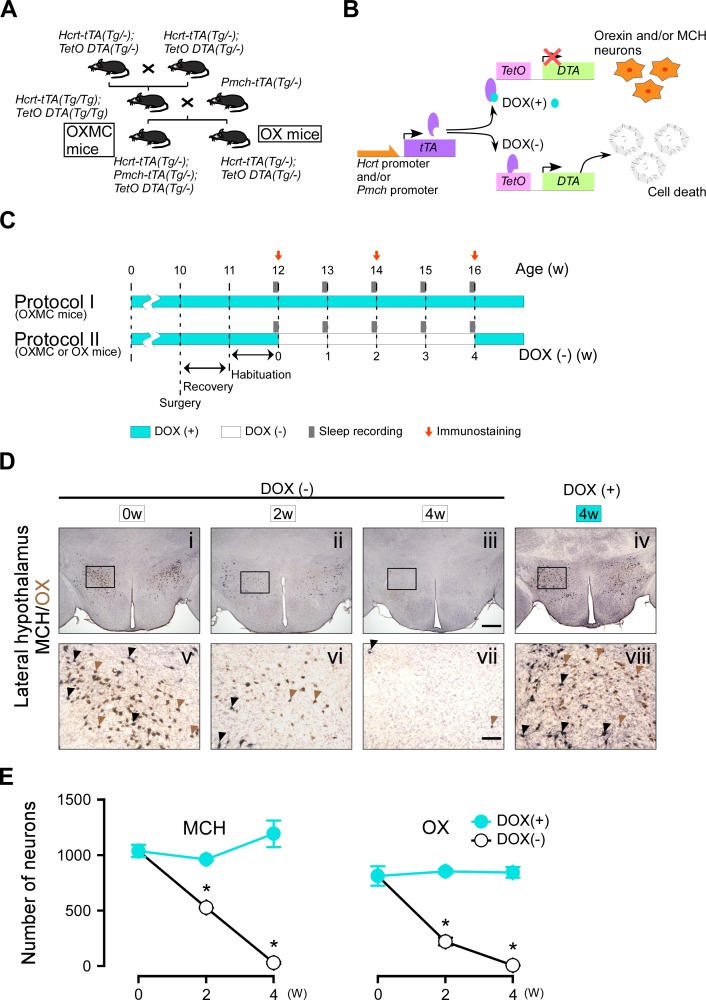
Figure 1. Dual ablation of orexin and MCH neurons using the tetracycline tTA/TetO system.
(A) Schematic illustrating generation of Hcrt-tTA (Tg/-); Pmch-tTA (Tg/-); TetO DTA (Tg/-) mice. (B) Schematic showing use of the tetracycline-controlled Tet-off gene expression system. In the presence of DOX (light blue circle), DOX binds to tTA (purple oval) and DTA expression is blocked. The absence of DOX allows tTA to bind TetO, allowing transcription of the diphtheria toxin A (DTA) subunit which results in cell death. (C) Experimental protocols for sleep recording and immunostaining. Protocol I is the control (DOX(+)) condition; Protocol II is the experimental (DOX(-) for 4 weeks) condition. EEG and EMG surgeries were performed at age 10 weeks in the sleep-recording group; the mice used for immunostaining did not undergo surgery. Light blue and white bars represent the periods of DOX chow (DOX(+)) and normal chow (DOX(-)) availability, respectively. Gray bars indicate sleep recordings; red arrows indicate when mice were sacrificed for immunostaining. (D) Immunostaining of orexin (brown) and MCH (black) neurons in the LH at DOX(-) 0 week (i and v), 2 weeks (ii and vi), 4 weeks (iii and vii), and DOX(+) 4 weeks (iv and viii). Black and brown arrowheads indicate typical examples of orexin and MCH neurons, respectively. Panels v-viii are magnifications of the areas delineated by the squares in Panels i-iv. Scale bars: i-iv, 500 µm; v-viii, 100 µm. (E) The number of orexin and MCH neurons in OXMC mice from the DOX(+) and (-) conditions (n = 3–6). Values are mean ± SEM. *p<0.05 vs. DOX(+). Data were analyzed by unpaired t test.


