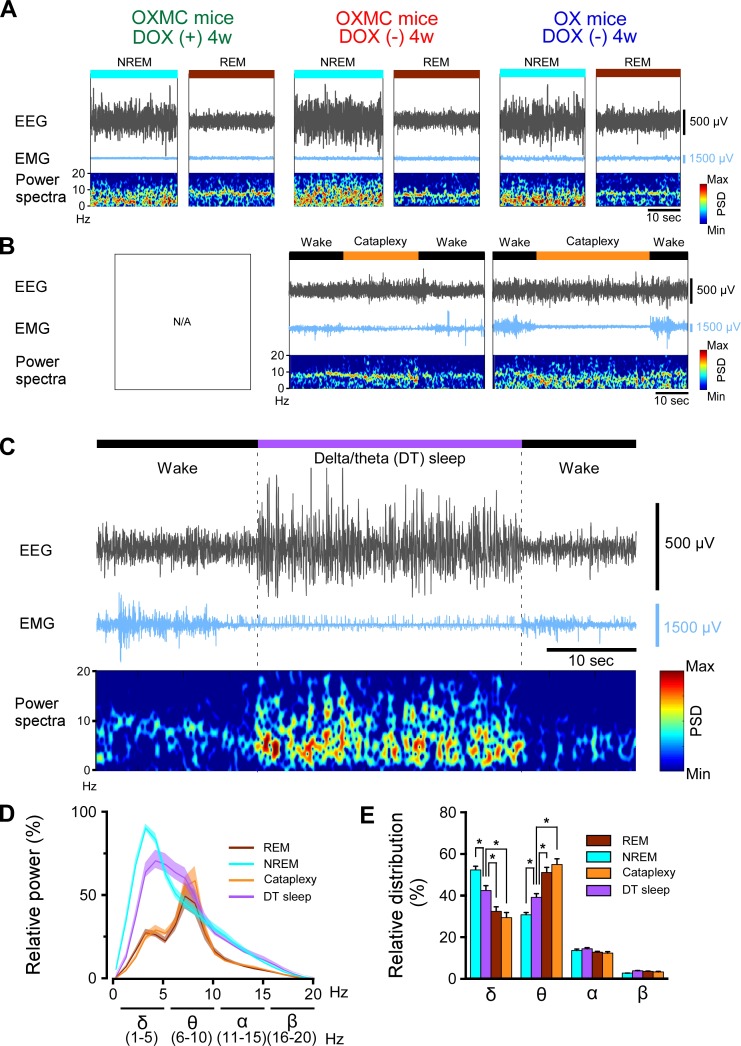
Figure 3. Criteria used to classify DT sleep.
(A) Representative EEG and EMG traces and EEG power spectral density during NREM and REM sleep for OXMC mice after 4 weeks in the DOX(+) and DOX(-) conditions and for OX mice after 4 weeks in the DOX(-) condition. (B) Representative EEG and EMG traces and EEG power spectral density during cataplexy in OXMC DOX(-) and OX DOX(-) mice. (C) Representative EEG and EMG traces and EEG power spectral density during DT sleep in OXMC DOX(-) mice. DT sleep was characterized by low EMG amplitude with high EEG spectral power in the δ (1–5 Hz) and θ (6–10 Hz) bandwidths. (D) Relative EEG power during NREM, REM, cataplexy and DT sleep in OXMC DOX(-) mice (n = 6–8) from 0 to 4 weeks DOX(-). The greatest EEG power across all stages was set at 100% for each mouse. Values are presented as mean ± SEM. (E) Relative EEG power in the standard frequency bands (δ, θ, α and β) for each state. The sum of each band is 100%. Values are presented as mean ± SEM. *p<0.05. Data were analyzed by one-way ANOVA followed by the Bonferroni post hoc test. Despite comparable EMG levels, DT sleep has significantly greater spectral power in the δ range and less power in the θ range than either REM sleep or cataplexy.

