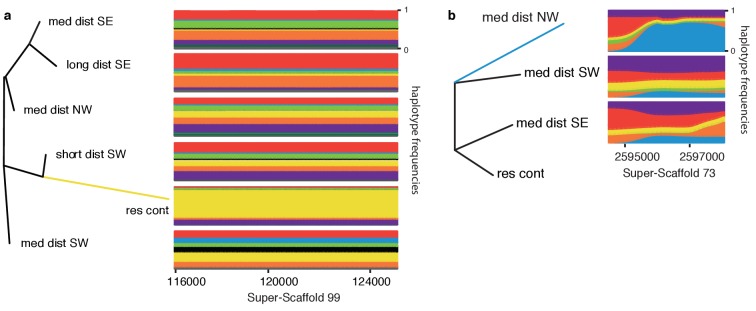
Figure 4. Exemplifying genomic regions under positive selection.
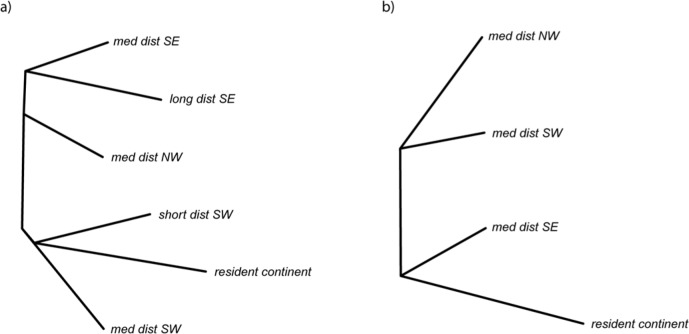
Local neighbour joining trees for regions under selection in (a) the resident continent population on Super-Scaffold 99, and (b) medium-distance NW population on Super-Scaffold 73. Selection is indicated by longer branch lengths in each population than is the case in global trees built using data from all genomic regions (Figure 4—figure supplement 1). Panels to the right of the trees show the corresponding frequency of haplotypes in each population of the tree. Haplotype clusters are colour coded (colours of haplotype clusters do not correspond to the population colour coding used in other figures), and frequencies are plotted along the Y axis. Haplotype frequency plots show the near fixation of a single dominating haplotype in (a) resident continent (yellow) and (b) medium-distance NW populations (blue). The location (in bp) of these regions on each Super-Scaffold is shown below these panels and the resident continent group is only included to root the tree in panel (b), and thus has no haplotype frequencies.


