. 2020 Apr 21;9:e54074. doi: 10.7554/eLife.54074

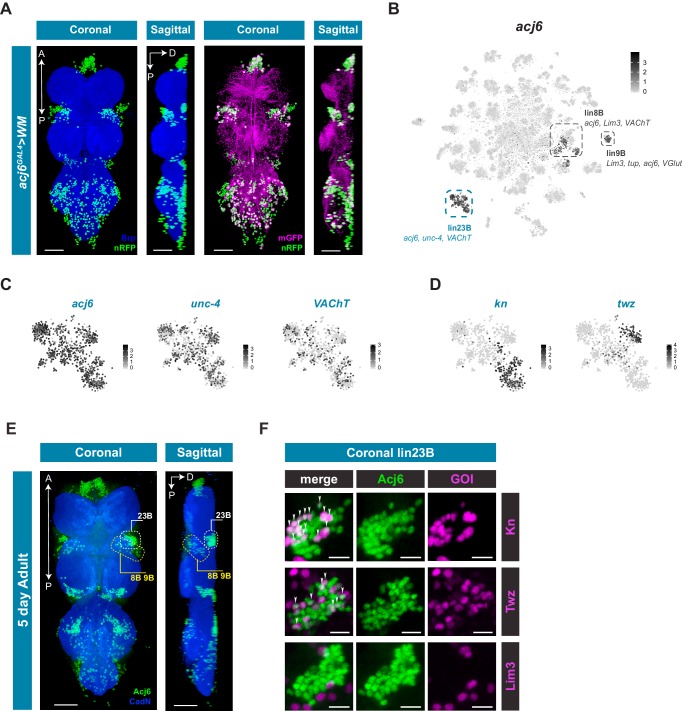
Figure 5. acj6 expression, hemilineage identity, and novel sub-lineage marker co-expression in the VNC.

(A) Visualization of acj6 expressing cells in the 5 day old adult VNC. Maximal coronal projection, and hemi-maximal sagittal projectionof acj6GAL4 driving expression of UAS-WM, enabling the visualization of cell nuclei (nRFP; green) and neuronal morphology (mGFP; magenta). Neuropil is counterstained (Brp; blue). A, Anterior, P, posterior, D, dorsal; scale bars = 50 μm. (B) t-SNE plot of acj6 expression in the VNC. Predicted hemilineage 8B, 9B, and 23B, based on known markers (shown below) are highlighted. (C) t-SNE plots of predicted hemilineage 23B, showing expression of markers acj6, unc-4, and VAChT. (D) t-SNE plots of predicted hemilineage 23B, showing expression of novel sub-type markers kn and twz. (B–D) Expression shown in black, intensity is proportional to the log-normalized expression levels. (E) Maximal coronal view (left) and hemi-maximal sagittal view (right) of Acj6 expression (green) in the 5 day old adult VNC. The posterior prothoracic hemilineages 23B (dashed white box) and the anterior mesothoracic 8B and 9B (dashed yellow box) are marked. A, Anterior, P, posterior, D, dorsal; Neuropil is counterstained (Cad-N; blue) scale bars = 50 μm. (F) Close-up maximal coronal views of dorsolateral hemilineage 23B showing the co-expression of knGAL4 and twzGAL4 driven UAS-Stinger expression (nGFP; magenta) with Acj6 (green). Co-positive cells (white) are indicated with arrow heads. Lim3GAL4 driven expression did not colocalize with Acj6 in hemilineage 23B. GOI = gene of interest, scale bars = 10 μm.

Figure 5—source data 1. Cell counts of novel sub-lineage marker co-expression in the VNC.
Cell counts of Acj6-positive and Acj6/GOI co-positive cells in prothoracic hemilineage 23B and mesothoracic hemilineages 8B and 9B. Values are for a single side of a single individual (along with means, standard deviations, and standard errors).

Figure 5.

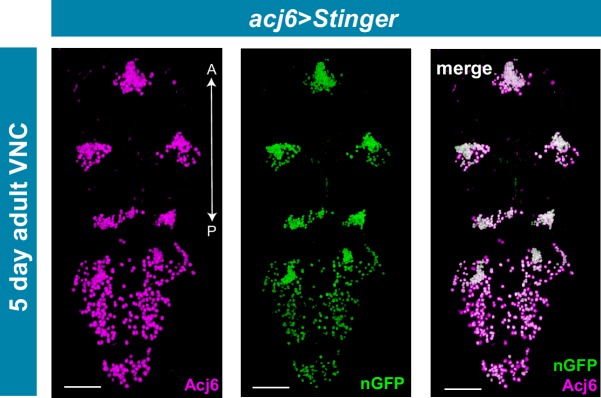
Figure 5—figure supplement 1. acj6GAL4 recapitulates Acj6 protein expression in the adult VNC.

Figure 5—figure supplement 1.

Maximal projections showing co-expression of acj6GAL4 driven expression of UAS-Stinger (nGFP; green) and endogenous Acj6 protein expression (anti-Acj6, magenta) in the 5 day old adult VNC. Merged expression shown on right in white. A, Anterior, P, posterior; scale bars = 50 μm.
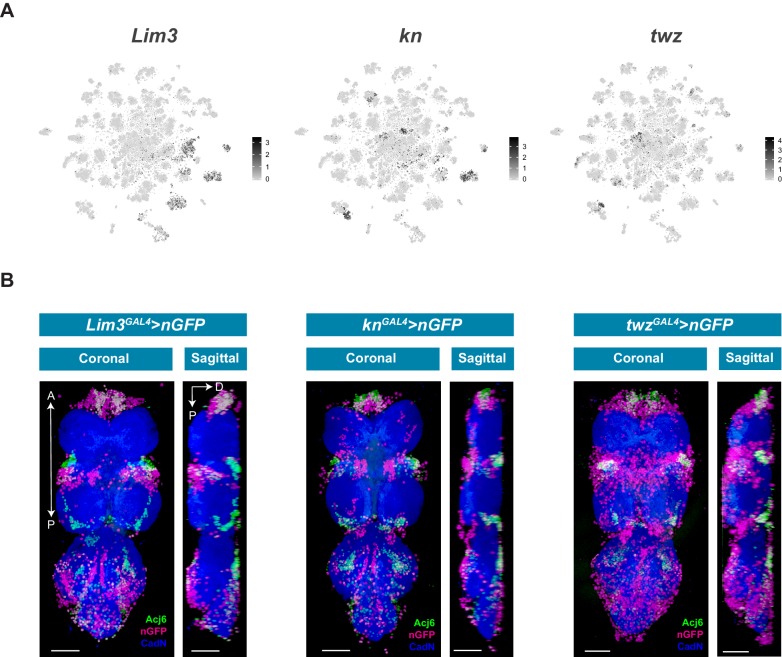
Figure 5—figure supplement 2. Novel sub-lineage marker expression in the VNC.

Figure 5—figure supplement 2.

(A) t-SNE plots of Lim3 (A), kn (B) and twz (C) expression in the VNC. Expression shown in black, intensity is proportional to the log-normalized expression levels. (B) Maximal projections showing co-expression of Acj6 (anti-Acj6; green) with Lim3GAL4, knGAL4, and twzGAL4 driven expression of UAS-Stinger (nGFP; magenta) in the 5 day adult VNC; coronal (left) and sagittal (right) views. A, Anterior, P, posterior, D, dorsal; Neuropil is counterstained (CadN; blue); scale bars = 50 μm.
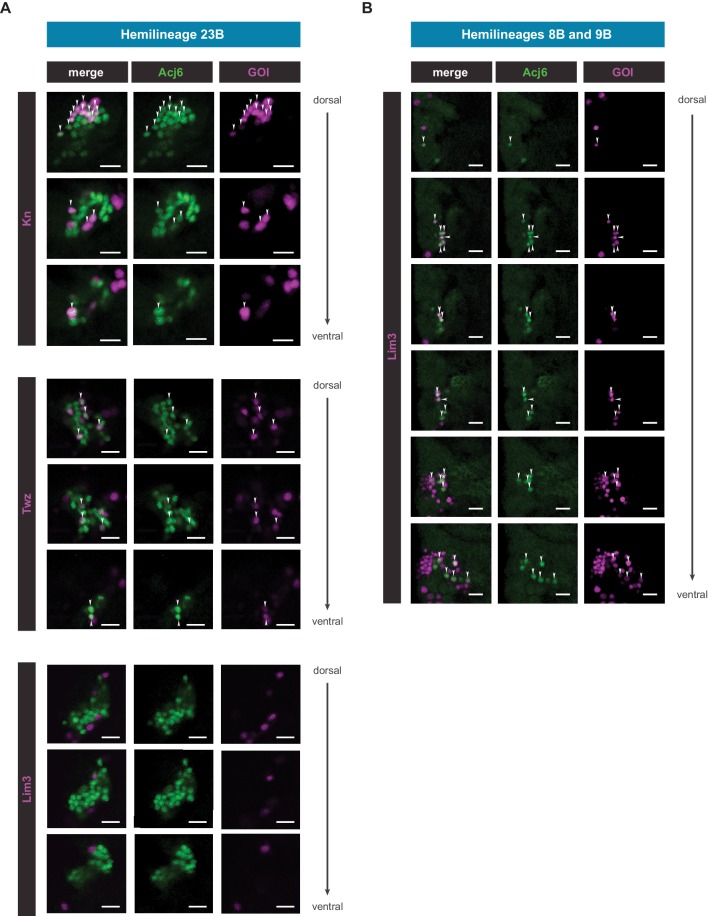
Figure 5—figure supplement 3. Single slices of novel sub-lineage marker co-expression in the VNC.

Figure 5—figure supplement 3.

(A) Single coronal slices of hemilineage 23B moving from dorsal to ventral side showing co-expression of Acj6 (anti-Acj6; green) with knGAL4, and twzGAL4 driven expression of UAS-Stinger (nGFP; magenta), and lack of co-expression of Lim3GAL4, in the 5 day adult VNC (GOI = gene of interest; arrow heads indicate co-positive cells; scale bars = 10 μm). (B) Single coronal slices of hemilineages 8B and 9B moving from dorsal to ventral side showing co-expression of Acj6 (anti-Acj6; green) with Lim3GAL4 driven expression of UAS-Stinger (nGFP; magenta), in the 5 day adult VNC (GOI = gene of interest; arrow heads indicate co-positive cells; scale bars = 10 μm).