

Abstract
Background:
Relapse is common in treatment for opioid use disorders (OUDs). Pain and depression often co-occur during OUD treatment, yet little is known about how they influence relapse among patients with a primary diagnosis of prescription opioid use disorder (POUD). Advanced statistical analyses that can simultaneously model these two conditions may lead to targeted clinical interventions.
Method:
The objective of this study was to utilize a discrete survival analysis with a growth mixture model to test time to prescription opioid relapse, predicted by parallel growth trajectories of depression and pain, in a clinical sample of patients in buprenorphine/naloxone treatment. The latent class analysis characterized heterogeneity with data collected from the National Institute of Drug Abuse Clinical Trials Network project (CTN-0030).
Results:
Results suggested that a 4-class solution was the most parsimonious based on global fit indices and clinical relevance. The 4 classes identified were: 1) low relapse, 2) high depression and moderate pain, 3) high pain, and 4) high relapse. Odds ratios for time-to-first use indicated no statistically significant difference in time to relapse between the high pain and the high depression classes, but all other classes differed significantly.
Conclusion:
This is the first longitudinal study to characterize the influence of pain, depression, and relapse in patients receiving buprenorphine and naloxone treatment. These results emphasize the need to monitor the influence of pain and depression during stabilization on buprenorphine and naloxone. Future work may identify appropriate interventions that can be introduced to extend time-to-first prescription opioid use among patients.
Keywords: prescription opioid use disorder, depression, pain, survival, growth mixture modeling, buprenorphine and naloxone treatment, opioid substitution treatment
1.0. Introduction
The devastation caused by addiction to opioids has threatened countless communities across the nation and resulted in a serious public health problem (Kolodny et al., 2015). Recently, the development of problems related to prescription opioid use specifically have become a major concern resulting in higher rates of fatal overdoses (Hedegaard et al., 2017) and prevalence of prescription OUD nationwide (Han et al., 2015; Jones, Mack, & Paulozzi, 2013; Rudd, Aleshire, Zibbell, & Gladden, 2016). According to Wu, Zhu, and Swartz, (2016), in a national sample from the 2005–2013 National Survey on Drug Use and Health, among persons with OUD, 81.9% claim use of prescription opioids only, with only 9.7% specific to use of heroin and 8.4% claiming OUD of both substances simultaneously. Despite the higher number of patients reporting prescription opioid use only and the dangers inherent in initiation of prescription opioid misuse (Cepeda et al., 2019), much of what is currently known about OUDs is specific to heroin use, with very few studies exploring whether those findings generalize to primary users of prescription opioids (Monwell et al., 2016). This is especially concerning with regards OUD treatment because the pathway into and out of active addiction for individuals misusing prescription opioids is markedly different than it is for individuals that misuse heroin (Hser et al., 2017). Research examining the harmful effects specific to the type of opioid used is needed.
Individuals in treatment for OUD often relapse early in outpatient treatment (Stone et al., 2018). Tuten and colleagues (2012) found that 50% of individuals in outpatient treatment for OUD relapsed within one month. Likewise, Marcovitz, McHugh, Volpe, Votaw, and Connery (2016) examined 202 patients in outpatient BUP+N treatment and found, that among the 23 early treatment drop-outs, over 53% had relapsed on opioids in the first month. This suggests that opioid relapse is a strong predictor of treatment retention for individuals with opioid use disorder and that outpatient treatment retention is heavily influenced by relapse in the first 30 days. While these findings are important, they do not identify factors associated with treatment success, nor how the treatment process may vary from one individual to the next. Thus, expanding our understanding of the factors influencing relapse, and whether homogeneous ‘sub-groups’ exist, can offer important insight and improve services for patients receiving BUP+N medication.
Two conditions that can contribute to relapse among patients in BUP+N treatment are pain and depression. Pain and depression are known to co-occur (Bair, Robinson, Katon, & Kroenke, 2003; IsHak et al., 2018) and are often associated with substance use and other harmful outcomes (Davis et al., 2008; Michna et al., 2004). The evidence suggests that both conditions contribute to the misuse of prescription opioids (Banta-Green et al., 2009; Clark et al., 2017). However, only one study has previously examined the co-occurrence of pain and depression in BUP+N treatment. Stein et al., (2015) trichotomized BUP+N patients into three groups; acute pain (n = 71), mild chronic pain (n = 51), and moderate to severe chronic pain (n = 103). Not surprisingly, the chronic pain groups experienced more depression than the acute group. Given the high co-occurrence of pain and depression (Nunes et al., 2004), it would be essential to study them in a simultaneous fashion to better understand how they may affect treatment outcomes.
1.1. Current Study
The existing National Institute of Drug Abuse (NIDA) Clinical Trials Network (CTN-0030) project, known as the Prescription Opioid Abuse Treatment Study (POATS; Weiss et al., 2010), offers an excellent choice for this study because of the focus on primary use of prescription opioids among patients in BUP+N treatment. The status quo as it relates to BUP+N treatment, including POATS, has largely been to focus on abstinence at end of treatment, single outcomes (e.g., percent of opioid-negative urinalyses) as the primary outcome indicator of interest (Weiss et al., 2011). While end-point analyses are necessary and clinically important, more sophisticated analyses allow us to determine when treatment worked for specific patients, when relapse occurred, and what predicted change in use over time or time to relapse. This allows researchers, and clinicians, the ability to determine critical time-points when additional treatment or specific interventions could be implemented to enhance overall BUP+N treatment success.
The overall objective of this study was to utilize the longitudinal nature of the data in the CTN-0030 POATS trial to implement advanced statistical techniques to investigate how depression and pain may impact relapse among individuals in treatment for primary prescription opioid use disorder. Specifically, we employed latent class analysis (LCA) to identify subgroups of parallel change in pain and depression over time, and their combined influence on time-to-first use/relapse (survival) among patients in BUP+N treatment.
2.0. Method
This was a secondary analysis of the NIDA CTN-0030 data set (NCT00316277) and was collected from 2006-2009. The details as they pertain specifically to this research project are described briefly as follows. For a thorough description of the study methods and primary findings please refer to Weiss and colleagues (2011).
2.1. Participants and Study Design
The larger study was completed in two consecutive phases. In phase 1, the researchers implemented a 2-week BUP+N stabilization period and then 2-week rapid titration off BUP+N and then up to an 8-week follow-up period. Only 6 percent of the 653 participants were successful in phase 1, and the unsuccessful patients were automatically transitioned to phase 2. In phase 2 of the study, which was used for the present project, 360 participants were enrolled, and the schedule included a 12-week stabilization on BUP+N, a 4-week detoxification, and an 8-week follow-up. We were only interested in data from phase 2 due to a high drop-out rate in phase 1. One participant had no scores across all study variables, as such, the final number of participants was 359. Participants were randomized in to a BUP+N group and a BUP+N with psychosocial counseling group. Because past research has found that individuals in treatment for opioid use disorder often relapse within the first few weeks of treatment (Tuten et al., 2012), and that the BUP+N stabilization period is vital to patient success in BUP+N treatment for individuals that misuse prescription opioids specifically (Sigmon et al., 2013), we focused only on the 12-week BUP+N stabilization period of phase 2. Because the psychosocial counseling was found to have no effect in the original POATS project, the treatment arms were collapsed into one data set for the purposes of this study.
2.2. Procedures
POATS participants were recruited from 10 CTN node sites across the country. Inclusion and exclusion criteria have been detailed in Weiss et al., (2010). Subjects were ineligible for the study if they had ever administered heroin by injection, had a previous diagnosis of heroin use disorder, or reported use of heroin on more than 4 occasions in the past month. Chronic pain was defined as “other than everyday kinds of pain” for at least 3 months on a self-report scale. Randomization of participants reporting chronic pain (42% of sample) or any lifetime heroin use (23%) was stratified by their self-report. Participants received a weekly supply of BUP+N drug and were expected to dose one time daily for the duration of the study. Over the 12-week stabilization study period, the patients were given two additional urinalysis tests to confirm the presence of the prescribed pharmacotherapy to assure that BUP+N was being self-administered as prescribed.
2.3. Measures
Supplement 1 illustrates the summary statistics for all participants in the phase 2 stabilization stage of study. Demographics measured baseline levels of sex, age, race, education, marital status, and employment status. Please see Supplement 2 for a timeline of primary study variables.
The Beck Depression Inventory (BDI; Beck, Ward, Mendelson, Mock, & Erbaugh, 1961) was implemented to measure presence and severity of depression (Range = 0 – 60). Cut-off scores previously established in the literature suggest that scores under 10 are consistent with minimal depression, scores from 10-18 are consistent with mild to moderate depression, scores from 19-29 are consistent with moderate to severe depression, and scores over 30 are consistent with severe depression (Beck et al., 1988). The Brief Pain Inventory (BPI; Cleeland & Ryan, 1994) pain intensity measure was used in this study because we were interested in quantifying the amount of current pain the participant was experiencing (Range = 0 – 36). Scores below 15 are generally considered mild, scores above 15 are considered moderate, and scores above 22 are considered severe (Li et al., 2007). Urine Drug Screen (UDS) was recorded for relapse-free survival1 (0 = negative, 1 = positive) of prescription analgesic opioids (only) on a weekly schedule during the buprenorphine stabilization treatment milieu. Because rates of relapse in the early stabilization period urinalysis results were high and unstable (likely due to the switch from other opioids to BUP+N), we did not include the first two urinalysis tests in our longitudinal survival models (see Supplement 2). In order to remain consistent with the original POATS measure of treatment success (abstaining from opioids during week and during at least 2 of the previous 3 weeks), we considered any missing urinalysis result to be positive for opioid use. We were not concerned with self-reported use of opioids, opting to rely on the more stringent urinalysis confirmed measure of relapse-free survival.
2.4. Data Analyses
The demographic and class probabilities were analyzed using SPSS ver. 25 (SPSS Inc., Chicago, IL, USA). The latent growth curve model (Little, 2013) and latent class mixture model (Nagin, 2005) were analyzed using MPlus version 8.2 (Muthen & Muthen, 2018). We employed latent growth curve model building techniques articulated in Little (2013) to determine the best fitting parallel longitudinal trajectories for the pain and depression measures across the four time points. We then employed discrete-time survival and latent growth mixture modeling to analyze changes in depression and pain trajectories to predict relapse-free survival (Figure 1).
Figure 1.
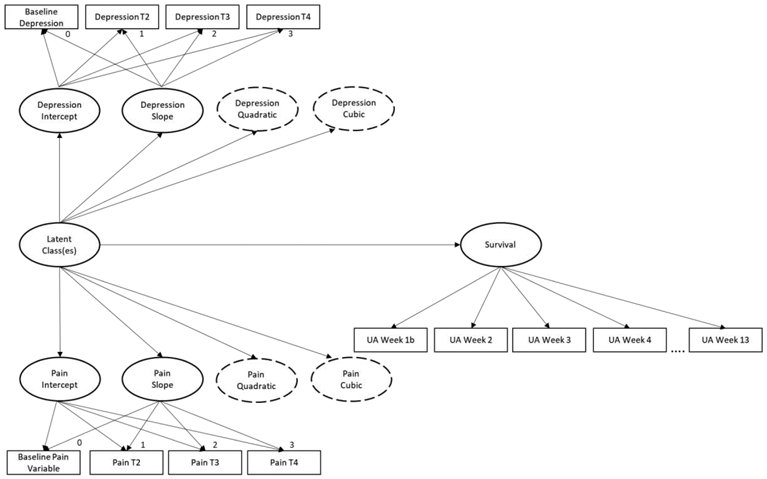
Discrete-time survival and parallel latent growth mixture modeling. Dotted line ovals represent the potential quadratic and cubic functions across the time points. For ease of understanding, lines were not drawn to each indicator variable from the quadratic and cubic latent variables for intercept and slope. All intercepts set to 1.
2.4.1. Latent class analyses of parallel growth model and survival
Latent class analysis (LCA; Muthén, 2002) is a statistical analysis procedure that can be implemented to classify participants into meaningful homogeneous subgroups. LCA is a term that is sometimes used interchangeably with latent profile analysis and latent class cluster analysis in the literature. While our design may by more closely aligned with the definition of a latent profile analysis due to our use of continuous indicators, we have chosen the LCA terminology to align better with our final “class” outcomes. This LCA model (Figure 1) utilized simultaneous analysis of parallel growth mixture modeling and discrete-time survival analysis to better understand how depression and pain impact relapse-free survival. Joint modeling of these processes was preferred because the results offer a more efficient and less biased estimate of the effect across time (Ibrahim et al., 2010; Tsiatis & Davidian, 2004; Jackson & Janssen, 2018).
2.4.2. Determining patient typology
The ideal number of latent classes is often determined by theoretical considerations regarding clinical relevance and prior research (Nagin and Odgers, 2010; Little, 2013)). Typically, the multiclass solutions are compared statistically based upon overall model fit. The Bayesian Information Criteria (BIC) is a common comparison fit statistic used to characterize the number of classes in a dataset (Kass and Raftery, 1995). Along with BIC, we also examined entropy, Lo-Mendell-Rubin (LMR; Lo et al., 2001) likelihood ratio test, and overall interpretability of the solutions to determine the most parsimonious and clinically distinct model (Nagin and Odgers, 2010). Models were fit for 1 through 10 latent class solutions. Benchmarks for model fit indices include BIC = lowest value, entropy = closest to 1.0, and LMR = non-significant. Though there is some debate on how to best handle missing data among urinalysis results (some of which has been detailed previously by our team, see McPherson et al., 2013, 2012), we felt that it was essential to remain consistent with the main POATS design. Hence, we considered missed urinalyses as positive in the survival data. For all other missing data we implemented Full Information Maximum Likelihood, robust to data missing at random2. For each class solution, we allowed the model to estimate mean values for intercept, slope, quadratic (if necessary), and cubic functions (if necessary). We then examined the estimates and reset the non-significant values to zero in a revised model, as noted in Table 1. Class membership probabilities were computed to test for between class heterogeneity and within-class homogeneity and reported in Table 2.
Table 1.
Model fit indices and estimated class size for LCA and discrete survival analysis.
| Model | AIC | BIC | Δ BIC |
Class Size | Entropy | LMR LRT |
Par. |
|---|---|---|---|---|---|---|---|
| 1 Class | 22265 | 22374 | 100% | 28 | |||
| 2 Class | 21518 | 21666 | 708 | 78%, 22% | 0.89 | 753.62*** | 38 |
| 2 Class Revised | 21518 | 21646 | 20 | 78%, 22% | 0.90 | 731.71*** | 33 |
| 3 Class | 21002 | 21169 | 477 | 62%, 24%, 14% | 0.89 | 509.11** | 43 |
| 3 Class Revised | 21007 | 21159 | 10 | 62%, 23%, 15% | 0.89 | 502.05** | 39 |
| 4 Class | 20795 | 20986 | 173 | 58%, 21%, 11%, 10% | 0.90 | 205.07 | 49 |
| 4 Class Revised | 20802 | 20976 | 10 | 58%, 21%, 11%, 10% | 0.90 | 203.92 | 45 |
| 5 Class | 20586 | 20799 | 177 | 51%, 17%, 12%, 10%, 10% | 0.89 | 212.27 | 55 |
| 5 Class Revised | 20606 | 20800 | −1 | 57%, 18%, 11%, 9%, 5% | 0.90 | 199.34 | 50 |
| 6 Class | 20420 | 20653 | 147 | 46%, 16%, 10%, 10%, 9%, 9% | 0.88 | 158.94 | 60 |
| 6 Class Revised | 20440 | 20654 | −1 | 48%, 13%, 10%, 10%, 10%, 9% | 0.88 | 170.72 | 55 |
| 7 Class | 20298 | 20546 | 208 | 44%, 16%, 10%, 10%, 9%, 8%, 3% | 0.88 | 106.98 | 64 |
| 8 Class | 20254 | 20530 | 16 | 41%, 15%, 12%, 9%, 9%, 9%, 3%, 2% | 0.88 | 47.82 | 71 |
| 9 Class | 20180 | 20495† | 35 | 38%, 18%, 10%, 8%, 7%, 6%, 5%, 4%, 3% | 0.86 | 77.03 | 81 |
| 10 Class | 20163 | 20517 | −22 | 41%, 11%, 8%, 8%, 7%, 6%, 6%, 6%, 4%, 2% | 0.87 | 54.72 | 91 |
Note: LCA = Latent Class Analysis, BIC = Bayesian Information Criterion, AIC = Akaike Information Criterion, LMR LRT = Lo-Mendel-Rubin Likelihood Ratio Test, Par. = Parameters in model. Revised models indicate that any non-significant values for intercept, slope, quadratic, or cubic function were reset to zero.
is best fit according to BIC. Bold type face indicates model chosen for best overall fit.
= p < .01
= p < .05
Table 2.
Average latent class probabilities for most likely latent class membership (row) by latent class (column).
| Class 1 | Class 2 | Class 3 | Class 4 | |
|---|---|---|---|---|
| 1 | 0.951 | 0.014 | 0.020 | 0.016 |
| 2 | 0.043 | 0.921 | 0.022 | 0.014 |
| 3 | 0.027 | 0.009 | 0.958 | 0.005 |
| 4 | 0.041 | 0.024 | 0.017 | 0.917 |
Note: Class 1 = Low Relapse; Class 2 = High Depression; Class 3 = High Pain; Class 4 = High Relapse
Lastly, given the latent classes selected for patient typology, overall class inclusion was then calculated to evaluate frequency and percentage of basic demographic variables and treatment success (see Table 3). Because these values were used for general explanatory purposes of different patient types, tests of statistical differences between class selection groups were not performed.
Table 3.
Class membership for select demographic variables.
| Demographic | Class 1 Low Relapse |
Class 2 High Depression |
Class 3 High Pain |
Class 4 High Relapse |
|---|---|---|---|---|
| Total Individuals in Class | 214 (60%) | 71 (20%) | 40 (11%) | 35 (9%) |
| Male Gender % | 137 (64%) | 23 (33%) | 23 (58%) | 25 (73%) |
| Age Mean (SD) | 32.01 (9.46) | 33.75 (10.34) | 35.14 (9.76) | 30.58 (8.80) |
| White Race % | 197 (92%) | 65 (92%) | 33 (83%) | 30 (88%) |
| Self-Report Chronic Pain | 62 (28%) | 34 (48%) | 36 (90%) | 6 (17%) |
| Self-Report Lifetime Depression | 73 (34%) | 33 (48%) | 13 (33%) | 4 (11%) |
| Above HS Education % | 84 (39%) | 32 (46%) | 30 (75%) | 25 (72%) |
| Employed Full-Time % | 140 (65%) | 34 (49%) | 21 (53%) | 22 (63%) |
| Ever Used Heroin % | 48 (22%) | 22 (31%) | 10 (25%) | 13 (37%) |
| Phase 2 Treatment Success % | 127 (59%) | 34 (48%) | 14 (35%) | 2 (6%) |
Note: These data were generated for explanatory purposes only. Chronic pain was defined as patient report of more than everyday kinds of pain for at least 3 months; lifetime depression was defined as previous or current diagnosis of major depressive disorder; HS = High School; Treatment success = abstaining from opioids during week 12 (the final week of BUP+N stabilization) and during at least 2 of the previous 3 weeks (weeks 9-11).
3.0. Results
3.1. Descriptives
The preliminary data results are displayed in Supplement 3. These results show the overall means, standard deviations, and correlations of each of the time points in the buprenorphine stabilization treatment milieu. Because the relapse-free survival analysis was not directly comparable to the overall treatment success outcome in the original POATS trial, we regressed the discrete survival outcome on the treatment condition to assure that treatment did not have significant an overall effect on survival rates, b = 0.23 (0.31), p = .46.
3.2. Model Selection
Displayed in Table 1 are the model fit indices for 1 through 10 latent classes. Examining BIC values, the 9-class model offered the best solution. We subsequently worked from larger (k = 8) to smaller class sizes to compare model fit. Taking into account the BIC, LMR, and entropy indicators, in addition to the clinical relevance of the subgroups, we settled on the 4-class revised model as the most parsimonious. Entropy was acceptable at 0.90, the LMR-LRT was non-significant, and the estimated classes were of acceptable size and clinically relevant. The 3-class solution indicated a better LMR likelihood ratio score, but the model eliminated a clinically relevant high pain group that was evident in the 4-class model (Henson et al., 2007; D. S. Nagin and Odgers, 2010; Ram and Grimm, 2009). Likewise, the 5-class solution offered an acceptable model fit, but the inclusion of a group with fewer than 20 people (less than 5% of sample) failed to justify the clinical interpretability of that class. Average latent class probabilities for the 4-class model were high, between 91.7% and 95.8% (see Table 2).
3.3. Defining the Classes
A graphical presentation of the four classes across the treatment milieu is available in Figure 2. In Supplement 4, a test of the significant differences between classes based on survival odds ratios is reported (this is also indicated in the description of Figure 2). Lastly, Table 3 shows the most likely class membership for key demographic variables of the sample. Consequently, the following classes were defined by the information available in Figure 2 and Table 3. Class 1 represents the low relapse patient group (solid lines in Figure 2; n = 214, 59.6%). The low relapse class had the best odds of relapse-free survival and showed moderate levels of both pain and depression at baseline, large decreases from baseline to week 4, and then a stable and slight decrease from week 4 to week 12. Class 2 was classified as a high depression group (long dashed lines in Figure 2; n = 71, 19.7%). The individuals in the high depression class reported moderate baseline pain intensity that was consistent throughout the treatment milieu. The high depression class had moderate levels of relapse and did not differ significantly from class 3 in odds of survival (the class did differ significantly from all other classes). Class 3 represents a high pain class (short dashed lines in Figure 2; n = 40, 11.1%). Along with increased and stable reports of pain, this class had depression rates very similar to the low relapse class and nearly all of the patients had relapsed by the end of the study. Class 4 was classified as the high relapse group (dotted lines in Figure 2; n = 34, 9.4%). This class had a high rate of relapse and it appears as though pain and depression were not playing a substantial role.”.
Fig. 2.
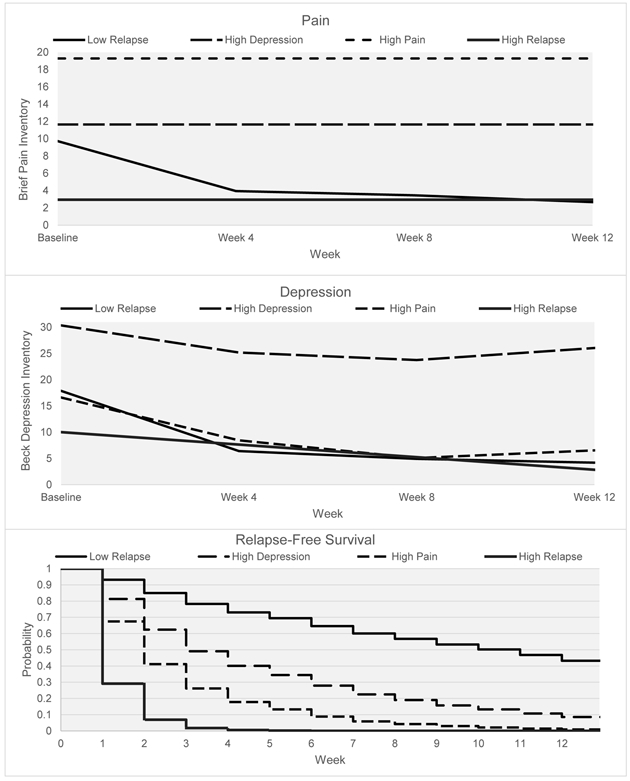
Simultaneous trajectories of pain, depression, and relapse (prescription opioid-free survival) across the 12-week treatment milieu. With the exception of the high pain and high depression classes, all of the survival probabilities were statistically different from each other (see Supp. 4).
4.0. Discussion
This study makes a significant contribution to the literature by yielding important insights into BUP+N treatment. We employed latent class analysis to identify a four-class solution for the simultaneous processes of pain, depression, and relapse in BUP+N treatment. Individuals were successfully parsed into classes which included a 1) low relapse treatment class, 2) a high depression, 3) high pain class, and 4) a high relapse class. The four classes had unique patterns across pain, depression, and relapse which increases the clinical utility of these findings. Among five of the six comparisons between groups there were significant differences in regard to their propensity to relapse (i.e., odds ratios of survival). Because the high depression and high pain groups differed significantly in their rates of relapse from the low relapse group, it suggests that “suffering”, whether emotional or physical, was impacting relapse. These results also point to the relevance of modeling relapse as a fundamental part of the BUP+N treatment milieu. To our knowledge, this is the first study to examine the dual change trajectories of pain and depression and their influence on relapse for individuals with opioid use disorder in BUP+N treatment.
The novelty of this study lies squarely in the results depicted in Figure 2. The simultaneous modeling of three clinically distinct, yet pertinent, processes across the BUP+N treatment program allowed for specific conclusions regarding the progress of each class. Our findings suggest that treatment for POUD is more complex than the presence or absence of use over the stabilization period. Rather, there exist different subgroups of patients in treatment, with some more likely to have difficulties with pain and some to have difficulties with depression. Over 30% of the patients fell into classes where pain and depression were likely to influence rates of relapse. Thus, pain and depression were a somewhat common experience among patients as they progressed through BUP+N stabilization.
4.1. Summary of the Classes
The trajectories for pain and depression in the low relapse class were characterized by a sharp decrease in the first four weeks of stabilization on BUP+N, followed by a leveling off over the rest of the treatment milieu. This trajectory pattern was similar to previous research (Daitch et al., 2012; Schmidt-Hansen, Bromham, Taubert, & Arnold, 2013; Bodkin, Zornberg, Lukas, & Cole, 1995). This suggests that pain and depression may share brain pathways that are important during the initial stages of BUP+N treatment.
Some of the results specific to the high depression class require further elaboration. To begin, the high depression class was predominantly female (67%) which is consistent with previous research among the general population (Weinberger et al., 2018) and clinical settings (Altemus et al., 2014). This finding makes sense given the high rate of females that enter into substance use disorder treatment with elevated levels of mental health conditions (Chen et al., 2011; Marsh et al., 2004), including the finding of higher rates of depression in females reported previously in the POATS project (McHugh et al., 2013). The high depression class also provides a confusing result on their baseline self-reported depression. Although the high depression class scored some 12 points above the other classes on the BDI at all time points, only 48% reported that they had been diagnosed in their lifetime with depression. Although the BDI is only a tool to measure depressive symptomatology, it has been validated as a strong predictor of clinical depression in many samples (Richter et al., 1998). This suggests that depression may be under reported on self-reports by those entering BUP+N treatment.
4.2. Clinical Implications
These results are informative for health care providers working with BUP+N treatment populations. These findings provide a clearer picture of what may be prompting relapse in BUP+N treatment. Where previous research and methodological strategies have informed clinicians that patients were relapsing, the strategy outlined in this study helps identify who was vulnerable to relapse and what parallel processes may be influencing relapse. Strategies like this will be essential as the health care field moves to fully implement a public health model of treating substance use disorders (Buck, 2011). The approach outlined in this study examines the BUP+N stabilization period from a larger lens. In this strategy, relapse was not considered the only outcome measure for treatment success; rather, relapse was simply a tool to gauge progress in treatment, and when, during treatment, specific interventions may be appropriate. Future research will be needed to evaluate other parallel processes and their effect on relapse among other substance use disorder treatment populations. Thus, this study has laid the groundwork for such forthcoming study designs.
Importantly, this study supports the previous research suggesting that the first month of BUP+N stabilization is vital to overall treatment retention (Marcovitz et al., 2016; Stone et al., 2018; Tuten et al., 2012) and extends these findings by integrating the influence of both pain and depression. In fact, an examination of the survival plot (relapse) in this study shows that the first 3 weeks of BUP+N treatment were the most unstable for patients. Although the high relapse class survival plot was the most substantial, the high pain and high depression classes also had high weekly rates of relapse. After week 3, the pattern of relapse is nearly identical for the low relapse, high depression, and high pain groups. This suggests that the first few weeks of BUP+N treatment may offer a prime target for clinical interventions that will reduce relapse rates and increase commitment to abstinence across all classes. Evidence based practices such as contingency management (Stitzer and Petry, 2006) and mindfulness meditation (Witkiewitz et al., 2012) offer potential techniques that may be effective during this high-risk period.
This study also adds to the literature with regards to the characterization of pain and depression among a large contingent of treatment seeking BUP+N patients. Because nearly 60% of the sample were grouped in a single class, this means that a little over half of the patients followed a treatment progression with few relapses and similar trajectories of pain and depression. This suggests that a large contingent of patients enter into BUP+N treatment with moderate levels of pain and depression, but these individuals report that both conditions subside in a predictable pattern over the treatment milieu. Lastly, these findings suggest that this clinical sample represents a relatively homogeneous group of POUD patients.
4.3. Limitations
The present study has a few limitations. First, this was a secondary analysis of data collected from 2006-2009 which may limit generalization to current BUP+N treatment protocols. Second, we focused on the dual change trajectories of pain and depression; there were other relevant variables that we could have included in the model. For example, alcohol use – smoking – relapse, or mutual aid involvement – quality of life – relapse, represent alternative models which would be relevant for further inquiry. Third, the present study only tested relapse to prescription opioids. This may limit the findings for relapse as it relates to other drugs. Specifically, use of cannabis may be a relevant outcome measure due to the ongoing debate on whether cannabis can provide a safe alternative to treat POUD (Humphreys and Saitz, 2019; Shover et al., 2019). Fourth, inherent among LCA studies is the challenge of determining the number of latent classes. No uniformly accepted technique for selecting the number of classes has been adopted, but the examination of model fit indices as well as graphical representations across models, strengthened the model determination. Fifth, we only examined the time-to-first use while patients were in BUP+N treatment and did not include the rates of relapse after the 12-week stabilization in our study. We feel that this would be an important follow-up to our study because of the increased risk of overdose after discontinuing BUP+N. Lastly, there was a four week interval between measurements of pain and depression in our study, perhaps a weekly measure of these indicators would provide a more fine grained approach with different LCA outcomes.
Supplementary Material
Highlights:
Identified four classes based upon unique responding patterns across pain, depression, and relapse among prescription opioid use disorder patients in buprenorphine treatment
Our finding suggest that “suffering”, whether emotional or physical, impacts relapse in buprenorphine treatment
Found that the first four weeks of buprenorphine treatment was the most volatile in terms of relapse to prescription analgesic opioids
5.0. Acknowledgments and Funding
This research was conducted as the doctoral dissertation of the first author (Noel A. Vest) under the direction of the last author (Sarah Tragesser). It was supported by an internal grant from the Alcohol and Drug Abuse Research Program at Washington State University [2474-1408]; and the National Institute on Drug Abuse (T32 035165). The content is solely the responsibility of the authors and does not necessarily represent the official views of the National Institutes of Health. We would like to thank the Clinical Trials Network reviewers for their thoughtful suggestions which strengthened the scope and focus of the manuscript.
Footnotes
Conflicts of Interest:
The authors report no conflicts of interest.
Publisher's Disclaimer: This is a PDF file of an unedited manuscript that has been accepted for publication. As a service to our customers we are providing this early version of the manuscript. The manuscript will undergo copyediting, typesetting, and review of the resulting proof before it is published in its final form. Please note that during the production process errors may be discovered which could affect the content, and all legal disclaimers that apply to the journal pertain.
Throughout this paper we refer to the common term for return to harmful use as relapse. We acknowledge that individuals in treatment may have a “one-time slip” rather than a return to a pattern of harmful misuse. For this project, we were interested in what contributed to the time-to-first use (which we termed relapse) of prescription opioids; hence, our relapse outcome is statistically defined as relapse-free survival.
Little’s Missing Completely at Random (MCAR) test of missing data for the BDI and BPI was non-significant χ2 = 59.82, p=.48.
References
- Altemus M, Sarvaiya N, Neill Epperson C, 2014. Sex differences in anxiety and depression clinical perspectives. Front. Neuroendocrinol 35, 320–330. 10.1016/j.yfrne.2014.05.004 [DOI] [PMC free article] [PubMed] [Google Scholar]
- Bair MJ, Robinson RL, Katon W, Kroenke K, 2003. Depression and Pain Comorbidity. Arch. Intern. Med 163, 2433 10.1001/archinte.163.20.2433 [DOI] [PubMed] [Google Scholar]
- Banta-Green CJ, Merrill JO, Doyle SR, Boudreau DM, Calsyn DA, 2009. Opioid use behaviors, mental health and pain-Development of a typology of chronic pain patients. Drug Alcohol Depend. 104, 34–42. 10.1016/j.drugalcdep.2009.03.021 [DOI] [PMC free article] [PubMed] [Google Scholar]
- Beck AT, Steer RA, Carbin MG, 1988. Psychometric properties of the Beck Depression Inventory: Twenty-five years of evaluation. Clin. Psychol. Rev 10.1016/0272-7358(88)90050-5 [DOI] [Google Scholar]
- Bodkin JA, Zornberg GL, Lukas SE, Cole JO, 1995. Buprenorphine treatment of refractory depression. J. Clin. Psychopharmacol 10.1097/00004714-199502000-00008 [DOI] [PubMed] [Google Scholar]
- Buck JA, 2011. The looming expansion and transformation of public substance abuse treatment under the Affordable Care Act. Health Aff 10.1377/hlthaff.2011.0480 [DOI] [PubMed] [Google Scholar]
- Cepeda JA, Astemborski J, Kirk GD, Celentano DD, Thomas DL, Mehta SH, 2019. Rising role of prescription drugs as a portal to injection drug use and associated mortality in Baltimore, Maryland. PLoS One 14, 1–13. 10.1371/journal.pone.0213357 [DOI] [PMC free article] [PubMed] [Google Scholar]
- Chen KW, Banducci AN, Guller L, Macatee RJ, Lavelle A, Daughters SB, Lejuez CW, 2011. An examination of psychiatric comorbidities as a function of gender and substance type within an inpatient substance use treatment program. Drug Alcohol Depend. 118, 92–99. 10.1016/j.drugalcdep.2011.03.003 [DOI] [PMC free article] [PubMed] [Google Scholar]
- Clark JMR, Cao Y, Krause JS, 2017. Risk of Pain Medication Misuse After Spinal Cord Injury: The Role of Substance Use, Personality, and Depression. J. Pain 18, 166–177. 10.1016/j.jpain.2016.10.011 [DOI] [PubMed] [Google Scholar]
- Cleeland CS, Ryan KM, 1994. Pain assessment: global use of the Brief Pain Inventory. Ann. Acad. Med. Singapore. 10.1016/0029-7844(94)00457-O [DOI] [PubMed] [Google Scholar]
- Daitch J, Frey ME, Silver D, Mitnick C, Daitch D, Pergolizzi J, 2012. Conversion of chronic pain patients from full-opioid agonists to sublingual buprenorphine. Pain Physician. [PubMed] [Google Scholar]
- Davis L, Uezato A, Newell JM, Frazier E, 2008. Major depression and comorbid substance use disorders. Curr. Opin. Psychiatry 10.1097/YCO.0b013e3282f32408 [DOI] [PubMed] [Google Scholar]
- Han B, Compton WM, Jones CM, Cai R, 2015. Nonmedical prescription opioid use and use disorders among adults aged 18 through 64 years in the United States, 2003-2013. JAMA - J. Am. Med. Assoc 314, 1468–1478. 10.1001/jama.2015.11859 [DOI] [PubMed] [Google Scholar]
- Hedegaard H, Warner M, Ph D, Miniño AM, 2017. Drug Overdose Deaths in the United States, 1999 – 2015 2010, 1–8. [PubMed] [Google Scholar]
- Henson JM, Reise SP, Kim KH, 2007. Detecting mixtures from structural model differences using latent variable mixture modeling: A comparison of relative model fit statistics. Struct. Equ. Model 10.1080/10705510709336744 [DOI] [Google Scholar]
- Hser Y-I, Huang D, Saxon AJ, Woody G, Moskowitz AL, Matthews AG, Ling W, 2017. Distinctive Trajectories of Opioid Use Over an Extended Follow-up of Patients in a Multisite Trial on Buprenorphine+Naloxone and Methadone. J. Addict. Med 11, 63–69. 10.1097/ADM.0000000000000274 [DOI] [PMC free article] [PubMed] [Google Scholar]
- Humphreys K, Saitz R, 2019. Should Physicians Recommend Replacing Opioids with Cannabis? JAMA - J. Am. Med. Assoc 10.1001/jama.2019.0077 [DOI] [PubMed] [Google Scholar]
- Jackson KM, Janssen T, 2018. Developmental considerations in survival models as applied to substance use research. Addict. Behav 10.1016/j.addbeh.2018.11.028 [DOI] [PMC free article] [PubMed] [Google Scholar]
- Jones CM, Mack KA, Paulozzi LJ, 2013. Pharmaceutical Overdose Deaths, United States, 2010. JAMA 309, 657 10.1001/jama.2013.272 [DOI] [PubMed] [Google Scholar]
- Kass RE, Raftery AE, 1995. Bayes factors. J. Am. Stat. Assoc 10.1080/01621459.1995.10476572 [DOI] [Google Scholar]
- Kolodny A, Courtwright D, Hwang CS, Kreiner P, Eadie JL, Clark T, Alexander G, 2015. The Prescription Opioid and Heroin Crisis: A Public Health Approach to an Epidemic of Addiction, SSRN. 10.1146/annurev-publhealth-031914-122957 [DOI] [PubMed] [Google Scholar]
- Li KK, Harris K, Hadi S, Chow E, 2007. What should be the optimal cut points for mild, moderate, and severe pain? J. Palliat. Med 10, 1338–1346. 10.1089/jpm.2007.0087 [DOI] [PubMed] [Google Scholar]
- Little TD, 2013. Longitudinal structural equation modeling. New York. [Google Scholar]
- Lo Y, Mendell NR, Rubin DB, 2001. Testing the number of components in a normal mixture. Biometrika. 10.1093/biomet/88.3.767 [DOI] [Google Scholar]
- Marcovitz DE, McHugh RK, Volpe J, Votaw V, Connery HS, 2016. Predictors of early dropout in outpatient buprenorphine/naloxone treatment. Am. J. Addict 25 10.1111/ajad.12414 [DOI] [PMC free article] [PubMed] [Google Scholar]
- Marsh JC, Cao D, D’Aunno T, 2004. Gender differences in the impact of comprehensive services in substance abuse treatment. J Subst Abus. Treat 27, 289–300. 10.1016/j.jsat.2004.08.004 [DOI] [PubMed] [Google Scholar]
- McHugh RK, DeVito EE, Dodd D, Carroll KM, Potter JS, Greenfield SF, Connery HS, Weiss RD, 2013. Gender differences in a clinical trial for prescription opioid dependence. J. Subst. Abuse Treat 45, 38–43. 10.1016/j.jsat.2012.12.007 [DOI] [PMC free article] [PubMed] [Google Scholar]
- McPherson S, Barbosa-Leiker C, Burns GL, Howell D, Roll J, 2012. Missing data in substance abuse treatment research: Current methods and modern approaches. Exp. Clin. Psychopharmacol 10.1037/a0027146 [DOI] [PMC free article] [PubMed] [Google Scholar]
- McPherson S, Barbosa-Leiker C, McDonell M, Howell D, Roll J, 2013. Longitudinal missing data strategies for substance use clinical trials using generalized estimating equations: An example with a buprenorphine trial. Hum. Psychopharmacol 10.1002/hup.2339 [DOI] [PMC free article] [PubMed] [Google Scholar]
- Michna E, Ross EL, Hynes WL, Nedeljkovic SS, Soumekh S, Janfaza D, Palombi D, Jamison RN, 2004. Predicting aberrant drug behavior in patients treated for chronic pain: Importance of abuse history. J. Pain Symptom Manage 10.1016/j.jpainsymman.2004.04.007 [DOI] [PubMed] [Google Scholar]
- Monwell Bodil, Bülow Per, Gerdner Arne, Cami J, Farré M, Panel N, Grönbladh L, Öhlund L, Gunne L, Kakko K, Eliasson L, Fischer B, Rehm J, Canfield M, Keller C, Frydrych L, Ashrafioun L, Purdy C, Blondell R, Cicero T, Ellis M, Fischer B, Cruz M, Rehm J, Busto U, Sproule B, Knight K, Romach M, Sellers E, Fiellin D, Friedland G, Gourevitch M, Veilleux C, Colvin P, Anderson J, York C, Heinzet A, Gunderson E, Fiellin D, Brink W, Haasen C, Cook C, Fugelstad A, Brooner R, King V, Kidorf M, Schmidt C, Bigelow G, Monwell B, Blix O, Bülow P, Gerdner A, Dreifuss J, Griffin M, Frost K, Fitzmaurice G, Potter J, Fiellin D, Weiss R, Wu L, Woody G, Yang C, Blazer D, Potter J, Marino E, Hillhouse M, Nielsen S, Wiest K, Canamar C, Ling W, Moore B, Fiellin D, Barry D, Sullivan L, Chawarski M, O’Connor P, Schottenfeld R, Nystrom S, Andren A, Zingmark D, Bergman H, Young A, Havens J, Lankenau S, Teti M, Silva K, Bloom J, Harocopos A, Treese M, 2016. Type of opioid dependence among patients seeking opioid substitution treatment: are there differences in background and severity of problems? Subst. Abuse Treat. Prev. Policy 11, 23 10.1186/s13011-016-0066-1 [DOI] [PMC free article] [PubMed] [Google Scholar]
- Muthén BO, 2002. Beyond SEM : general latent variable modelling. Behaviormetrika. 10.2333/bhmk.29.81 [DOI] [Google Scholar]
- Nagin D, Odgers CL, 2010. Group-Based Trajectory Modeling in Clinical Research, SSRN. 10.1146/annurev.clinpsy.121208.131413 [DOI] [PubMed] [Google Scholar]
- Nagin DS, Odgers CL, 2010. Group-Based Trajectory Modeling in Clinical Research. Annu. Rev. Clin. Psychol 10.1146/annurev.clinpsy.121208.131413 [DOI] [PubMed] [Google Scholar]
- Nunes EV, Sullivan MA, Levin FR, 2004. Treatment of depression in patients with opiate dependence. Biol. Psychiatry 10.1016/j.biopsych.2004.06.037 [DOI] [PubMed] [Google Scholar]
- Ram N, Grimm KJ, 2009. Methods and Measures: Growth mixture modeling: A method for identifying differences in longitudinal change among unobserved groups. Int. J. Behav. Dev 33, 565–576. 10.1177/0165025409343765 [DOI] [PMC free article] [PubMed] [Google Scholar]
- Richter P, Werner J, Heerlein A, Kraus A, Sauer H, 1998. On the validity of the Beck Depression Inventory. A review. Psychopathology. 10.1159/000066239 [DOI] [PubMed] [Google Scholar]
- Rudd RA, Aleshire N, Zibbell JE, Gladden RM, 2016. Increases in Drug and Opioid Overdose Deaths — United States, 2000–2014. CDC.gov 65, 2010–2015. [DOI] [PubMed] [Google Scholar]
- Schmidt-Hansen M, Bromham N, Taubert M, Arnold S, 2013. Buprenorphine for treating cancer pain. Cochrane Database Syst. Rev. 10.1002/14651858.CD009596.pub3 [DOI] [PMC free article] [PubMed] [Google Scholar]
- Shover CL, Davis CS, Gordon SC, Humphreys K, 2019. Association between medical cannabis laws and opioid overdose mortality has reversed over time. Proc. Natl. Acad. Sci. 201903434 10.1073/pnas.1903434116 [DOI] [PMC free article] [PubMed] [Google Scholar]
- Sigmon SC, Dunn KE, Saulsgiver K, Patrick ME, Badger GJ, Heil SH, Brooklyn JR, Higgins ST, 2013. A randomized, double-blind evaluation of buprenorphine taper duration in primary prescription opioid abusers. JAMA Psychiatry 70, 1347–1354. 10.1001/jamapsychiatry.2013.2216 [DOI] [PMC free article] [PubMed] [Google Scholar]
- Stein MD, Herman DS, Bailey GL, Straus J, Anderson BJ, Uebelacker LA, Weisberg RB, 2015. Chronic Pain and DepressionAmong Primary Care Patients Treated with Buprenorphine. J. Gen. Intern. Med 30, 935–941. 10.1007/s11606-015-3212-y [DOI] [PMC free article] [PubMed] [Google Scholar]
- Stitzer M, Petry N, 2006. Contingency Management for Treatment of Substance Abuse. Annu. Rev. Clin. Psychol 10.1146/annurev.clinpsy.2.022305.095219 [DOI] [PubMed] [Google Scholar]
- Stone AC, Carroll JJ, Rich JD, Green TC, 2018. Methadone maintenance treatment among patients exposed to illicit fentanyl in Rhode Island: Safety, dose, retention, and relapse at 6 months. Drug Alcohol Depend. 10.1016/j.drugalcdep.2018.07.019 [DOI] [PMC free article] [PubMed] [Google Scholar]
- Todd L, 2013. The Oxford Handbook of Quantitative Methods, Volume 2 Statistical analysis. Oxford Libr. Psychol 10.1017/CBO9781107415324.004 [DOI] [Google Scholar]
- Tuten M, Defulio A, Jones HE, Stitzer M, 2012. Abstinence-contingent recovery housing and reinforcement-based treatment following opioid detoxification. Addiction. 10.1111/j.1360-0443.2011.03750.x [DOI] [PMC free article] [PubMed] [Google Scholar]
- Weinberger AH, Gbedemah M, Martinez AM, Nash D, Galea S, Goodwin RD, 2018. Trends in depression prevalence in the USA from 2005 to 2015: Widening disparities in vulnerable groups. Psychol. Med 48, 1308–1315. 10.1017/S0033291717002781 [DOI] [PubMed] [Google Scholar]
- Weiss RD, 2011. Adjunctive Counseling During Brief and Extended Buprenorphine-Naloxone Treatment for Prescription Opioid Dependence. Arch. Gen. Psychiatry 68, 1238 10.1001/archgenpsychiatry.2011.121 [DOI] [PMC free article] [PubMed] [Google Scholar]
- Weiss RD, Potter JS, Fiellin DA, Byrne M, Connery HS, Dickinson W, Gardin J, Griffin ML, Gourevitch MN, Haller DL, Hasson AL, Huang Z, Jacobs P, Kosinski AS, Lindblad R, McCance-Katz EF, Provost SE, Selzer J, Somoza EC, Sonne SC, Ling W, 2011. Adjunctive Counseling During Brief and Extended Buprenorphine-Naloxone Treatment for Prescription Opioid Dependence. Arch. Gen. Psychiatry 68, 1238 10.1001/archgenpsychiatry.2011.121 [DOI] [PMC free article] [PubMed] [Google Scholar]
- Weiss RD, Potter JS, Provost SE, Huang Z, Jacobs P, Hasson A, Lindblad R, Connery HS, Prather K, Ling W, 2010. A multi-site, two-phase, Prescription Opioid Addiction Treatment Study (POATS): Rationale, design, and methodology. Contemp. Clin. Trials 31, 189–199. 10.1016/j.cct.2010.01.003 [DOI] [PMC free article] [PubMed] [Google Scholar]
- Witkiewitz K, Bowen S, Douglas H, Hsu SH, 2012. Mindfulness-based relapse prevention for substance craving. Addict. Behav 10.1016/j.addbeh.2012.04.001 [DOI] [PMC free article] [PubMed] [Google Scholar]
- Wu LT, Zhu H, Swartz MS, 2016. Treatment utilization among persons with opioid use disorder in the United States. Drug Alcohol Depend. 169, 117–127. 10.1016/j.drugalcdep.2016.10.015 [DOI] [PMC free article] [PubMed] [Google Scholar]
Associated Data
This section collects any data citations, data availability statements, or supplementary materials included in this article.