

Abstract
Storage is essential in improving the quality of strong‐flavor baijiu (SFB). Here, we investigated the release behaviors of metals from containers into SFB and their effects on the evolution of aroma compounds during storage. Twenty‐six metals were identified in SFB samples. The concentrations of Na, K, Ca, Mg, Al, and Fe obviously increased after storing in pottery jar, whereas those of Fe and Cu greatly increased after storing in stainless‐steel vessel. The volatility of most esters, alcohols, ketone, furan, and aldehyde decreased, whereas that of most acids increased after adding the metal ions into fresh SFB. The fluorescence intensity of SFB decreased with increased aging time in pottery jar, whereas the fluorescence intensity of acids was quenched with adding Fe3+ and Cu2+. All these results suggested that some metals released from containers had binding affinities with acids, thereby reducing SFB organoleptic stimulation by forming metal‐aroma compound complexes during storage.
Keywords: aroma compounds, metals, storage, strong‐flavor baijiu
Some metals were dissolved out from containers such as pottery jar and stainless‐steel vessel into strong‐flavor baijiu (SFB) during storage. These metals had binding affinities with aroma compounds, thereby reducing SFB organoleptic stimulation by forming metal‐aroma compound complexes during storage.

1. INTRODUCTION
Baijiu is an ancient Chinese liquor that belongs the six major distilled spirits in the world. Baijiu has a distinctive flavor different from other major distilled spirits, such as brandy, whiskey, rum, gin, and vodka (Jin, Zhu, & Xu, 2017; Liu & Sun, 2018). The flavors of baijiu are generally classified into twelve types, including three major and nine minor flavor types (Zheng & Han, 2016). Strong‐flavor baijiu (SFB) is one of the major flavor types and accounts for approximately 70% of the total baijiu production in China. Production of SFB is unique and complex, involving solid‐state fermentation, distillation, storage/aging, and blending. Sorghum or a mixture of corn, rice, glutinous rice, and wheat are mostly used as raw materials for SFB production, and daqu is used as the saccharifying and fermentative agent. Fermentation is carried out in a mud pit (Xu et al., 2017; Zou, Zhao, & Luo, 2018). As a result, SFB is rich in volatile compounds, including esters, acids, alcohols, aldehydes, ketones, pyrazines, furans, phenols, aromatics, and sulfides (Liu & Sun, 2018; Wang, Fan, & Xu, 2014). Furthermore, SFB contains some nonvolatile compounds, such as metals, amino acids, and peptides, which have potential functions and are beneficial to human health (Cui, 2008; Song et al., 2018; Zhang, Wu, Xu, & Qian, 2014).
Storage is an essential procedure in SFB production. Fresh distilled baijiu with unpleasant, rough and pungent flavor needs to be stored in a pottery jar or a stainless‐steel vessel for months or years to improve SFB quality (Zheng & Han, 2016). After storage, fresh distilled baijiu is converted into aged/stored SFB, and its flavor becomes mellow and harmonious, and even appears chen‐aroma. During storage, some metals are released into SFB from the containers (Jiang, Xie, Wan, Chen, & Zheng, 2019). These metals can affect the taste and smell of baijiu. Xiong, Xiang, and Zhao (2013) reported that Ca, Fe, Mg, and Cu released from pottery jar into baijiu improved the soft mellow and harmonious mouthfeel. However, the relationship between metals and flavor compounds of SFB, which is closely related to SFB quality, remains unclear because the flavor compounds are too complex.
Metals play an important role in modulating sensory attributes of alcoholic beverage. Cu, Fe, Mn, Al, and Zn influence the release and formation of some aroma compounds, such as hydrogen sulfide, methanethiol, and dimethyl sulfide in wine (Franco‐Luesma & Ferreira, 2014; Viviers, Smith, Wilkes, & Smith, 2013). The presence of Cu at a low level leads to a better taste and aroma of brandy (Bonic et al., 2013). Therefore, understanding the effects of metals on the release and formation of aroma compounds of baijiu are important for modulating its flavor and sensory properties.
This work aimed to investigate the effects of metals released from pottery jar or stainless‐steel vessel on the evolution of aroma compounds of SFB during storage. Release behaviors of metals into SFB were first investigated. Major metals Na, K, Ca, Mg, Al, and Fe in SFB samples were determined via inductively coupled plasma‐optical emission spectrometry (ICP‐OES), and trace metals Ag, As, Ba, Be, Cd, Cr, Cu, Li, Mn, Ni, Pb, Sr, Ti, Zn, La, Pr, Nd, Sm, Eu, and Gd were determined via inductively coupled plasma‐mass spectrometry (ICP‐MS). Then, changes of aroma compounds in SFB after adding various metal ions were analyzed via headspace solid‐phase microextraction combined with gas chromatography–mass spectrometry (HS‐SPME‐GC‐MS), and the metal‐binding abilities of aroma compounds were evaluated via fluorescence spectroscopy to further understand the effects of metals on aroma compounds of SFB.
2. MATERIALS AND METHODS
2.1. Materials
SFB samples were the same level base baijiu and provided by Luzhoulaojiao Co., Ltd. (Luzhou, China). Samples were stored in pottery jar or type 304 stainless‐steel vessel for 0, 1, 2, 3, 5, and 10 years. The volume of the pottery jar is 1 m3, and its surface area is approximately 5.8 m2 in comparison to 1 m3 of SFB. The volume of the stainless‐steel vessel is 10 m3, and its surface area is approximately 2.1 m2 in comparison to 1 m3 of SFB. During storage, the pottery jar was sealed and put in a cave at 20°C. The stainless‐steel vessel was sealed and put in the shade at a room temperature which varied with the seasons. Standard solutions of Na, K, Ca, Mg, Al, Fe, Ag, As, Ba, Be, Cd, Cr, Cu, Li, Mn, Ni, Pb, Sr, Ti, Zn, La, Pr, Nd, Sm, Eu, and Gd were purchased from Guobiao Testing & Certification Co., Ltd. Acetic acid, butanoic acid, and hexanoic acid (GC grade, ≥98% purity) were purchased from Dr. Ehrenstorfer. Internal standard, methyl hexanoate, was purchased from ANPLE Scientific Instrument Co., Ltd. A C7–C40 n‐alkane mixture (O2SI Smart Solutions) was employed to determine retention indices (RIs). Ethanol (high‐performance liquid chromatography grade, 99% purity), nitric acid, hydrogen peroxide, NaCl, KCl, CaCl2, MgCl2•6H2O, AlCl3•6H2O, FeCl3•6H2O, and CuCl2•2H2O were of analytical grade and purchased from Kelong Chemical Co., Ltd. Milli‐Q water (18.2 MΩ/cm resistivity) was prepared through a Milli‐Q system (Millipore).
2.2. Analysis of metals in the stored SFB by ICP‐OES and ICP‐MS
SFB samples (25 ml) were heated at 80°C until their volume was reduced to 2–3 ml. Then, the concentrated samples were digested at 120°C with 5 ml nitric acid and 1 ml hydrogen peroxide. After cooling to room temperature, these digested solutions were diluted to 25 ml with Milli‐Q water. The concentrations of major metals, such as Na, K, Ca, Mg, Al, and Fe, were determined by ICP‐OES (Optima 8000; PerkinElmer), and the concentrations of trace metals, such as Ag, As, Ba, Be, Cd, Cr, Cu, Li, Mn, Ni, Pb, Sr, Ti, Zn, La, Pr, Nd, Sm, Eu, and Gd, were determined by ICP‐MS (ELAN 9000/DRC‐e; PerkinElmer).
2.3. HS‐SPME extraction and GC‐MS analysis of aroma compounds in SFB
Aqueous solutions of NaCl, KCl, CaCl2, MgCl2, AlCl3, FeCl3, and CuCl2, in which the metal ion has a concentration of 1,000 mg/L, were prepared individually. Different volumes of the above‐mentioned solutions were added into fresh SFB samples to obtain 2 and 10 mg/L of Na+, K+, and Ca2+, 0.5 and 2 mg/L Mg2+, Al3+, Fe3+, and Cu2+. SFB samples with addition of metal were regarded as experimental groups, and SFB sample without addition of metal was the control group. All samples were stored at 25°C for a week.
Changes in aroma compounds of fresh SFB after adding various metal ions were analyzed through HS‐SPME‐GC‐MS using the reported method with some modifications (Huang et al., 2019; Zhang, Wu, & Xu, 2014). SFB sample (1 ml) and methyl hexanoate (10 μL, 1,310 μg/L in 70% ethanol/water solution v/v) as internal standard were added into a 20‐mL screw‐capped headspace vial. The vial was placed in thermostatic water bath, equilibrated at 40°C for 10 min and extracted for 45 min at the same temperature by being exposed to a 50/30 μm divinylbenzene/carboxen/polydimethylsiloxane fiber (2 cm; Supelco, Inc.). Subsequently, the fiber was transferred into an injector to desorb at 250°C for 5 min.
Volatile aroma compounds were then analyzed via GC‐MS (QP2020; Shimazu, Japan). HP‐Innowax column (60 m × 0.25 mm i.d. × 0.25 μm; Agilent) was used as capillary column. Helium (purity 99.999%) was used as carrier at a constant flow rate of 1 ml/min. Injector was maintained at 250°C. Oven temperature was started at 40°C for 5 min, raised to 100°C at rate of 4°C/min, then ramped to 230°C at a rate of 6°C/min and held for 15 min. For MS analysis, electron ionization was used at 70 eV. Temperatures of the interface and the ion source were set at 250 and 230°C, respectively. The mass range scanned was from 30 to 450 amu at a scan rate of 0.3 s.
Volatile aroma compounds were identified by comparing their mass spectra (MS) with the NIST14 mass spectra database and comparing their retention indices (RIs) with those of reference compounds. Net changes were used to evaluate aroma volatility and were calculated according to the equation: Net change (%) = (mean peak area of control—mean peak area of experimental group)/ mean peak area of control × 100% (Huang et al., 2018; Zhang et al., 2014).
2.4. Fluorescence spectra of SFB and acids solution
Fluorescence excitation‐emission matrix (EEM) spectra of the SFB samples stored in pottery jar for 0, 1, 2, 3, 5, and 10 years were measured using a fluorescence spectrometer (F‐7000; Hitachi). Excitation and emission wavelengths were recorded from 200 nm to 350 nm and 200 nm to 450 nm, respectively, with 2.5 nm slit widths.
Different volumes of NaCl, KCl, CaCl2, MgCl2, AlCl3, FeCl3, and CuCl2 aqueous solutions, in which metal ion concentration was 2000 mg/L, were added into fresh SFB samples to obtain different concentrations of Na+ (0.5, 5, 20, and 100 mg/L), K+ (0.5, 5, 20, and 100 mg/L), Ca2+ (0.5, 5, 20, and 100 mg/L), Mg2+ (0.5, 5, 20, and 100 mg/L), Al3+ (0.5, 2, 10, and 50 mg/L), Fe3+ (0.5, 2, 10, and 50 mg/L), and Cu2+ (0.2, 0.5, 2, and 10 mg/L). Fresh SFB samples with metal ions were stilled for a week. Then, fluorescence intensities at the maximum emission wavelength of the samples were recorded with the maximum excitation wavelength of 280 nm. F0 and F were the fluorescence intensities of the SFB with and without metal ions, respectively.
Fluorescence emission spectra of acid solutions with different concentrations of a metal ion (Na+, K+, Ca2+, Mg2+, Al3+, Fe3+, or Cu2+) were recorded at maximum excitation wavelength of 220 nm. Acid solutions include 0.5 g/L of acetic acid, butanoic acid, and hexanoic acid in 70% (v/v) ethanol/water. Metal ion concentrations were 0, 0.1, 0.5, 2, 5, 10, 20, and 50 mg/L.
2.5. Statistical analysis
Each sample was analyzed in triplicate for each determination. The results in tables are presented as mean ± standard deviation. One‐way analysis of variance (ANOVA) and Duncan's multiple range tests were carried out with SPSS 25.0 software to evaluate significant differences of assay (p < .05).
3. RESULTS AND DISCUSSIONS
3.1. Quantification of metals in SFB
Twenty‐six metals in fresh and stored SFB samples were analyzed via ICP‐OES and ICP‐MS, and the results are listed in Table 1. Na, K, Ca, Mg, Al, and Fe are the major metals with high content in baijiu (Xie, Jiang, & Wu, 2017). Hence, their concentrations were determined by ICP‐OES, which is usually used to analyze samples with high total dissolved solids content. Besides, the minor metals Ag, As, Ba, Be, Cd, Cr, Cu, Li, Mn, Ni, Pb, Sr, Ti, Zn, La, Pr, Nd, Sm, Eu, and Gd were analyzed by ICP‐MS, which is more sensitive, but limited to samples with low total dissolved solids content (Martin, Watling, & Lee, 2012; Šelih, Šala, & Drgan, 2014). Fresh SFB had little amounts of metals because most of metals remained in Zaopei after distillation (Li et al., 2016; Zou et al., 2018). However, some metals were dissolved out from containers during storage. SFB sample stored in pottery jar for 10 years contained 4,245.333 μg/L Ca, 1643.333 μg/L Na, 1548.000 μg/L K, 1,028.667 μg/L Al, 390.333 μg/L Mg, and 328.333 μg/L Fe. These metal concentrations were remarkably higher than those in other samples. The maximum concentration of Cu (336.667 μg/L) was achieved in SFB stored in stainless‐steel vessel for 5 years. These metal concentrations found in stored samples were below the international statutory limits of alcoholic beverages (Iwegbue, Overah, Bassey, & Martincigh, 2014). Concentrations of Ba, Cr, Mn, Ni, Sr, Ti, and Zn were in the range of 0.093–46.959 μg/L, and Li concentration ranged from 0.003 to 14.901 μg/L. Concentrations of trace metals Ag, As, Be, Cd, and Pb were <1.289 μg/L, and concentrations of La, Pr, Nd, Sm, Eu, and Gd were below 0.5 μg/L in all samples. Relatively low levels of major and trace metals detected in stored SFB indicated that metal concentrations released from pottery jar and stainless‐steel vessel during storage did not exceed the recommended allowable daily intake according to the alcohol control database of the WHO (Bonic et al., 2013; Iwegbue, Overah, Bassey, & Martincigh, 2014; Salako, Adekoyeni, Adegbite, & Hammed, 2016).
Table 1.
Metal concentrations (μg/L) in SFB stored in pottery jar and stainless‐steel vessel
| Metal | P0/S0 | P1 | P3 | P5 | P10 | S1 | S3 | S5 | S10 |
|---|---|---|---|---|---|---|---|---|---|
| Na | 76.633 ± 6.435d | 74.467 ± 4.100d | 184.667 ± 16.503c | 348.000 ± 23.516b | 1643.333 ± 19.296a | 57.800 ± 4.214d | 66.833 ± 7.112d | 63.767 ± 3.383d | 63.433 ± 4.875d |
| K | 25.500 ± 2.879d | 44.067 ± 3.729d | 262.667 ± 11.504c | 553.333 ± 37.754b | 1548.000 ± 58.275a | 25.267 ± 2.815d | 31.133 ± 2.627d | 52.733 ± 5.395d | 53.467 ± 2.695d |
| Ca | 60.900 ± 1.217e | 137.000 ± 8.888d | 822.000 ± 29.309c | 1,447.667 ± 21.127a | 4,245.333 ± 96.106a | 61.933 ± 7.228e | 103.333 ± 8.505de | 126.333 ± 13.051de | 158.000 ± 26.211d |
| Mg | 8.783 ± 0.958e | 20.933 ± 2.676de | 137.000 ± 11.000c | 235.667 ± 5.033b | 390.333 ± 32.005a | 7.627 ± 0.862e | 34.300 ± 0.458d | 33.967 ± 2.589d | 42.000 ± 3.606d |
| Al | 21.733 ± 2.663e | 32.267 ± 1.804e | 343.000 ± 13.077c | 567.333 ± 69.644b | 1,028.667 ± 32.347a | 24.333 ± 1.060e | 33.900 ± 3.439e | 114.333 ± 10.970d | 148.667 ± 19.655d |
| Fe | 9.473 ± 1.119f | 15.133 ± 0.586f | 112.133 ± 9.201e | 216.667 ± 26.690c | 328.333 ± 20.306a | 25.700 ± 3.020f | 87.807 ± 3.694e | 140.333 ± 23.544d | 268.667 ± 10.504b |
| Ag | 0.015 ± 0.004de | 0.010 ± 0.002ef | 0.033 ± 0.004b | 0.045 ± 0.003a | 0.021 ± 0.004d | 0.018 ± 0.003d | 0.015 ± 0.002de | 0.027 ± 0.006c | 0.007 ± 0.001f |
| As | 0.160 ± 0.017d | 0.210 ± 0.001d | 0.414 ± 0.031c | 0.745 ± 0.095b | 1.289 ± 0.256a | 0.141 ± 0.005d | 0.175 ± 0.007d | 0.776 ± 0.135b | 0.874 ± 0.053b |
| Ba | 0.093 ± 0.013c | 0.140 ± 0.016c | 0.267 ± 0.020c | 0.749 ± 0.159b | 2.700 ± 0.269a | 0.181 ± 0.022c | 0.155 ± 0.030c | 0.234 ± 0.020c | 0.260 ± 0.046c |
| Be | 0.001 ± 0.000e | 0.001 ± 0.000e | 0.017 ± 0.002c | 0.080 ± 0.003b | 0.107 ± 0.004a | 0.001 ± 0.000e | 0.001 ± 0.000e | 0.011 ± 0.002d | 0.016 ± 0.003c |
| Cd | 0.003 ± 0.001c | 0.002 ± 0.001c | 0.008 ± 0.002bc | 0.044 ± 0.006a | 0.037 ± 0.015a | 0.013 ± 0.002bc | 0.040 ± 0.010a | 0.016 ± 0.004b | 0.041 ± 0.002a |
| Cr | 0.331 ± 0.004d | 0.436 ± 0.039d | 1.828 ± 0.081c | 2.254 ± 0.890c | 1.783 ± 0.228c | 1.310 ± 0.131cd | 2.362 ± 0.104c | 4.167 ± 1.102b | 12.229 ± 1.154a |
| Cu | 0.110 ± 0.015c | 0.092 ± 0.012c | 2.152 ± 0.149c | 4.818 ± 0.428c | 8.303 ± 0.536c | 0.309 ± 0.054c | 1.138 ± 0.132c | 336.667 ± 21.733a | 196.667 ± 27.301b |
| Li | 0.003 ± 0.001e | 0.205 ± 0.015e | 2.267 ± 0.201c | 6.989 ± 0.058b | 14.901 ± 1.152a | 0.022 ± 0.004e | 0.493 ± 0.069de | 1.185 ± 0.029d | 0.515 ± 0.058de |
| Mn | 0.555 ± 0.031f | 0.732 ± 0.031f | 3.877 ± 0.298e | 9.097 ± 0.199d | 15.861 ± 1.214c | 0.731 ± 0.012f | 1.687 ± 0.055f | 19.329 ± 1.533b | 29.306 ± 1.563a |
| Ni | 1.049 ± 0.070e | 0.754 ± 0.038e | 1.656 ± 0.126e | 6.010 ± 0.074b | 2.976 ± 0.197d | 1.693 ± 0.189e | 1.127 ± 0.044e | 4.140 ± 0.803c | 10.441 ± 1.258a |
| Pb | 0.053 ± 0.008f | 0.073 ± 0.010ef | 0.164 ± 0.007de | 0.309 ± 0.007c | 0.614 ± 0.095b | 0.221 ± 0.046cd | 0.152 ± 0.037def | 0.842 ± 0.118a | 0.746 ± 0.073a |
| Sr | 0.232 ± 0.014e | 0.278 ± 0.038e | 5.121 ± 0.376c | 7.803 ± 0.189b | 15.247 ± 0.427a | 0.205 ± 0.013e | 0.293 ± 0.022e | 1.866 ± 0.225d | 2.003 ± 0.091d |
| Ti | 1.123 ± 0.123e | 2.657 ± 0.581de | 6.482 ± 0.498b | 5.417 ± 0.584bc | 20.651 ± 3.536a | 1.136 ± 0.228e | 2.626 ± 0.198de | 3.757 ± 0.532cd | 7.639 ± 0.103b |
| Zn | 1.033 ± 0.040e | 0.921 ± 0.116e | 10.644 ± 0.684d | 13.137 ± 1.051d | 26.269 ± 3.161c | 1.295 ± 0.176e | 3.609 ± 0.119e | 46.959 ± 2.893a | 34.345 ± 7.079b |
| La | 0.062 ± 0.006e | 0.104 ± 0.009d | 0.119 ± 0.005d | 0.165 ± 0.022c | 0.251 ± 0.012b | 0.046 ± 0.002e | 0.057 ± 0.003e | 0.047 ± 0.006e | 0.454 ± 0.054a |
| Pr | 0.012 ± 0.002e | 0.024 ± 0.001d | 0.029 ± 0.002d | 0.043 ± 0.005c | 0.074 ± 0.007b | 0.010 ± 0.001e | 0.012 ± 0.002e | 0.012 ± 0.001e | 0.109 ± 0.003a |
| Nd | 0.045 ± 0.004f | 0.091 ± 0.012e | 0.116 ± 0.002d | 0.174 ± 0.018c | 0.276 ± 0.009b | 0.033 ± 0.004f | 0.042 ± 0.009f | 0.043 ± 0.001f | 0.422 ± 0.009a |
| Sm | 0.009 ± 0.001ef | 0.019 ± 0.002d | 0.028 ± 0.003c | 0.035 ± 0.005b | 0.065 ± 0.005a | 0.006 ± 0.001f | 0.012 ± 0.002e | 0.004 ± 0.001f | 0.009 ± 0.001ef |
| Eu | 0.005 ± 0.001c | 0.008 ± 0.001b | 0.007 ± 0.001bc | 0.008 ± 0.001b | 0.019 ± 0.002a | 0.006 ± 0.001bc | 0.007 ± 0.002b | 0.007 ± 0.001b | 0.001 ± 0.000d |
| Gd | 0.032 ± 0.003e | 0.058 ± 0.005bc | 0.049 ± 0.003cd | 0.071 ± 0.011b | 0.123 ± 0.018a | 0.034 ± 0.005de | 0.039 ± 0.003de | 0.061 ± 0.006bc | 0.125 ± 0.010a |
Values are mean ± standard deviation of triplicates. P0, P1, P3, P5, and P10 are SFB samples stored in pottery jar for 0, 1, 3, 5, and 10 years, respectively. S0, S1, S3, S5, and S10 are SFB samples stored in stainless‐steel vessel for 0, 1, 3, 5, and 10 years, respectively.
Values in the same row with different superscript letters are significantly different (p < .05).
The concentrations of most metals in SFB increased during storage (Figure S1). When SFB was stored in pottery jar, the concentrations of Na, K, Ca, Mg, Al, and Fe increased considerably, and concentrations of Ba, Be, Cu, Li, Mn, Ni, Sr, Ti, and Zn increased slightly. Pottery jar is made from fired clay and covered with glaze over the surface. Its main components are SiO2 and Al2O3 and contain small amounts of metallic oxides, such as CaO, Fe2O3, CuO, NiO, and TiO2 (Schleicher, Miller, Watkins‐Kenney, Carnes‐McNaughton, & Wilde‐Ramsing, 2008). These metallic oxides can be slowly dissolved into baijiu during storage (Yang, Zhao, & Liu, 2001); therefore, most metals in SFB increased during storage in pottery jar. When SFB was stored in stainless‐steel vessel, concentrations of Fe and Cu in SFB increased greatly and concentrations of Cr, Mn, Ni, Sr, Ti, and Zn increased slightly. The Cu in SFB should be the impurity, which was introduced from welding process in production of the stainless‐steel vessel (Magnabosco, Ferro, Bonollo, & Arnberg, 2006).
Metals in alcoholic beverages have a two‐faced role. Metals of proper amount and type are beneficial to modulating the flavor of alcoholic beverages and human health. For example, Fe and Cu can remove bad odors, and K, Ca, Cu, Zn, Fe, and Mg are essential metals in the human body (Ibanez, Carreon‐Alvarez, Barcena‐Soto, & Casillas, 2008). However, excess metals in alcoholic beverages would negatively influence their organoleptic quality and flavor and cause harm to human health. Excess Cu can give unpleasant tastes, and excess Fe changed the color of spirits to yellow or even brown (Pohl, 2007). Hence, metal concentrations in SFB should be limited according to the international statutory limits in alcoholic beverages recommended by the WHO.
3.2. Effect of main metals on aroma compounds in SFB
Na, K, Ca, Mg, Al, Fe, and Cu, which had relatively high concentrations in stored SFB, were chosen for further study of their effects on volatile aroma compounds. HS‐SPME method is widely used for identification and quantification of volatile components in baijiu (Fan & Qian, 2005; Zhang et al., 2014). In this study, a total of 30 volatile aroma compounds, including 17 esters, 6 alcohols, 4 acids, 1 ketone, 1 aldehyde, and 1 furan, were identified in SFB and quantified through the HS‐SPME method (Table 2). Addition of 2 mg/L Na+, K+, Ca2+, Mg2+, Al3+, Fe3+, or Cu2+ to the fresh SFB resulted in different effects on the headspace concentrations of esters, alcohols, acids, ketone, furan, and aldehyde. For esters, the volatility in the experimental groups largely decreased compared with the control group. When Na+ was added, the volatility of esters decreased by 0.04%–15.84%, except ethyl pentanoate and propyl hexanoate, which increased by 0.07% and 0.38%, respectively. After adding K+, the volatility of some esters decreased by 0.22%–20.22% and others increased by 1.08%–7.93%. Addition of Ca2+, Mg2+ or Fe3+ decreased the volatility of esters by 3.28%–33.41%, 1.71%–37.63%, and 0.58%–31.83%, respectively. When Al3+ was added, the volatility of most esters decreased by 1.34%–13.22% except ethyl lactate, pentyl hexanoate, and hexyl hexanoate. After adding Cu2+, the volatility of some esters decreased by 1.21%–18.89%, and others increased by 0.88%–9.14%. For alcohols, volatility decreased by 0.50%–41.65% in the experimental groups, except that the headspace concentration of 1‐propanol increased by 4.20% after adding Fe3+. For acids, the volatility of most acids in the experimental groups increased, except that the volatility of acetic acid, butanoic acid, and pentanoic acid decreased by addition of K+ and Fe3+. For ketone, furan, and aldehyde, the headspace concentrations decreased by 0.50%–24.90% after adding metals. However, concentrations of 2‐nonanone increased by 0.98% after adding K+; concentrations of 2‐nonanone and furfural increased by 3.62% and 1.59%, respectively, after adding Al3+; and furfural concentration increased by 6.12% after adding Cu2+.
Table 2.
Effect of metal ions on mean HS‐SPME‐GC‐MS peak areas for aroma volatility in SFB
| Compounds | RI | Odor | Identification | Control (μg/L) | Net change (%) | ||||||
|---|---|---|---|---|---|---|---|---|---|---|---|
| Na+ | K+ | Ca2+ | Mg2+ | Al3+ | Fe3+ | Cu2+ | |||||
| Ethyl acetate | 889 | Pineapple | MS, RI | 160,722.8 ± 10,996.7 | 2.11 | 5.31 | 3.95 | 11.20 | 10.52 | 4.00 | 14.83 |
| Ethyl butanoate | 1,040 | Pineapple | MS, RI | 96,505.2 ± 1,216.3 | 2.39 | 6.11 | 8.03 | 8.16 | 7.85 | 3.45 | 1.57 |
| Ethyl pentanoate | 1,135 | Apple | MS, RI | 17,082.5 ± 1,190.8 | −0.07 | 7.04 | 3.28 | 4.39 | 1.34 | 0.58 | −0.88 |
| Ethyl hexanoate | 1,244 | Fruity | MS, RI | 400,137.9 ± 9,897.7 | 3.29 | 2.72 | 4.35 | 1.71 | 3.25 | 3.84 | 3.14 |
| Butyl 3‐methylbutanoate | 1,270 | Banana, cheese | MS, RI | 865.0 ± 43.5 | 5.68 | 3.49 | 8.46 | 6.04 | 4.93 | 9.81 | 1.21 |
| Propyl hexanoate | 1,323 | Fruity | MS, RI | 5,449.2 ± 206.7 | −0.38 | 0.22 | 4.54 | 8.01 | 2.57 | 7.25 | 3.81 |
| Ethyl heptanoate | 1,339 | Pineapple | MS, RI | 24,404.1 ± 911.6 | 5.72 | 2.10 | 9.14 | 8.67 | 2.28 | 6.85 | −5.08 |
| Ethyl lactate | 1,349 | Fruity | MS, RI | 4,402.7 ± 183.7 | 15.84 | 20.22 | 33.41 | 34.05 | −0.45 | 31.83 | 18.89 |
| Butyl hexanoate | 1,418 | Grape | MS, RI | 15,631.4 ± 88.9 | 14.27 | −1.37 | 11.28 | 7.00 | 1.61 | 9.64 | −3.89 |
| Ethyl octanoate | 1,440 | Fruity, fatty | MS, RI | 35,694.7 ± 53.8 | 7.28 | 0.37 | 10.71 | 16.38 | 1.90 | 9.09 | −1.20 |
| Isopentyl hexanoate | 1,465 | Green | MS, RI | 6,959.4 ± 101.5 | 8.43 | −2.25 | 15.22 | 10.44 | −0.01 | 10.72 | −9.14 |
| Pentyl hexanoate | 1517 | Fruity, pineapple | MS, RI | 4,302.0 ± 154.9 | 4.01 | −1.08 | 12.52 | 17.40 | −1.01 | 11.92 | 1.71 |
| Ethyl nonanoate | 1542 | Fruity, rose | MS, RI | 678.3 ± 25.1 | 8.26 | −2.52 | 15.88 | 25.74 | 2.05 | 15.18 | 5.59 |
| Hexyl hexanoate | 1615 | Fruity | MS, RI | 18,988.6 ± 1,050.3 | 4.23 | −6.70 | 8.10 | 4.92 | −3.85 | 13.47 | −6.38 |
| Ethyl phenylacetate | 1803 | Fruity, sweet | MS, RI | 188.5 ± 9.4 | 0.28 | −7.93 | 6.57 | 37.63 | 4.00 | 22.66 | 10.48 |
| Ethyl phenylpropiolate | 1910 | Fruity, sweet | MS, RI | 255.3 ± 12.7 | 3.17 | 2.03 | 8.57 | 29.91 | 9.91 | 24.77 | 13.38 |
| Ethyl hexadecanoate | 2,263 | Fruity | MS, RI | 289.4 ± 3.8 | 0.04 | 5.41 | 11.36 | 28.60 | 13.22 | 22.95 | 17.85 |
| 1‐Propanol | 1,047 | Alcoholic | MS, RI | 1848.4 ± 54 | 11.05 | 10.71 | 14.46 | 17.56 | 18.45 | −4.20 | 36.44 |
| 2‐Methyl−1‐propanol | 1,106 | Malty | MS, RI | 569.8 ± 40.4 | 8.78 | 9.68 | 20.83 | 41.65 | 22.27 | 2.94 | 16.09 |
| 1‐Butanol | 1,148 | Malty | MS, RI | 3,996.1 ± 174 | 6.68 | 4.75 | 8.40 | 15.44 | 4.07 | 9.67 | 6.02 |
| 3‐Methyl−1‐butanol | 1,214 | Malty | MS, RI | 2083.5 ± 100.5 | 6.27 | 5.34 | 13.68 | 21.01 | 12.57 | 15.35 | 3.19 |
| 1‐Pentanol | 1,254 | Balsamic | MS, RI | 321.6 ± 9.8 | 0.50 | 9.17 | 12.23 | 31.55 | 2.19 | 14.20 | 2.56 |
| 1‐Hexanol | 1,356 | Flower, fruity | MS, RI | 2,544.1 ± 39.6 | 13.72 | 19.56 | 29.80 | 31.04 | 15.46 | 34.58 | 9.56 |
| Acetic acid | 1,476 | Acidic, vinegar | MS, RI | 1538.0 ± 40.8 | 26.46 | 21.24 | 12.69 | −4.17 | −18.65 | 19.43 | −5.12 |
| Butanoic acid | 1648 | Sweaty, rancid | MS, RI | 2,633.0 ± 28.7 | −0.85 | 2.22 | −7.83 | −23.12 | −12.86 | 24.79 | 5.97 |
| Pentanoic acid | 1774 | Sweaty | MS, RI | 270.0 ± 23.8 | −17.52 | 11.41 | −16.59 | −31.69 | −25.85 | 7.06 | −9.78 |
| Hexanoic acid | 1865 | Sweaty | MS, RI | 3,589.3 ± 194.4 | −4.54 | −2.93 | −20.00 | −42.44 | −28.27 | −6.73 | −21.47 |
| 2‐Nonanone | 1,394 | soy sauce | MS, RI | 242.5 ± 13.5 | 0.50 | −0.98 | 17.26 | 16.27 | −3.62 | 24.90 | 9.30 |
| Furfural | 1,480 | Sweet, almond | MS, RI | 552.7 ± 21.4 | 3.00 | 1.62 | 4.63 | 5.92 | −1.59 | 1.95 | −6.12 |
| Benzaldehyde | 1548 | Fruity, berry | MS, RI | 784.0 ± 16.5 | 11.40 | 8.06 | 12.96 | 6.73 | 9.50 | 12.48 | 2.14 |
Overall, each metal had a different effect on the evolution of volatile aroma compounds. These metal cations generally promoted hydrolysis of esters, and the increase in acids helped strengthen the hydrogen bond between water and ethanol (Nose, Hojo, Suzuki, & Ueda, 2004) and reduce the organoleptic stimulation. Moreover, the decrease in the headspace concentrations of some aroma compounds implied that the hydroxyl of alcohols and the carboxyl of acids, and other aroma compounds probably bound with metal cations.
Figure 1 shows the effects of adding different concentrations of these metals on the evolution of volatile aroma compounds in SFB samples. Total headspace concentrations of esters and alcohols decreased with increased metal ion concentrations (Figure 1a,c), whereas acid concentrations increased, except for the addition of Fe3+ (Figure 1b). This result implied that Fe3+ had a stronger ability to interact with carboxyl of acids in SFB than other metal ions (Na+, K+, Ca2+, Mg2+, Al3+, and Cu2+). Esters and acids were the main aroma compounds in baijiu. Total acid content increased and total ester content decreased during the aging period (Qiao, Zhang, & Wang, 2013). Therefore, the above results indicated that the quality of aged SFB was associated with Na, K, Ca, Mg, Al, Fe, and Cu, and these metals had an aging‐advancing function.
Figure 1.
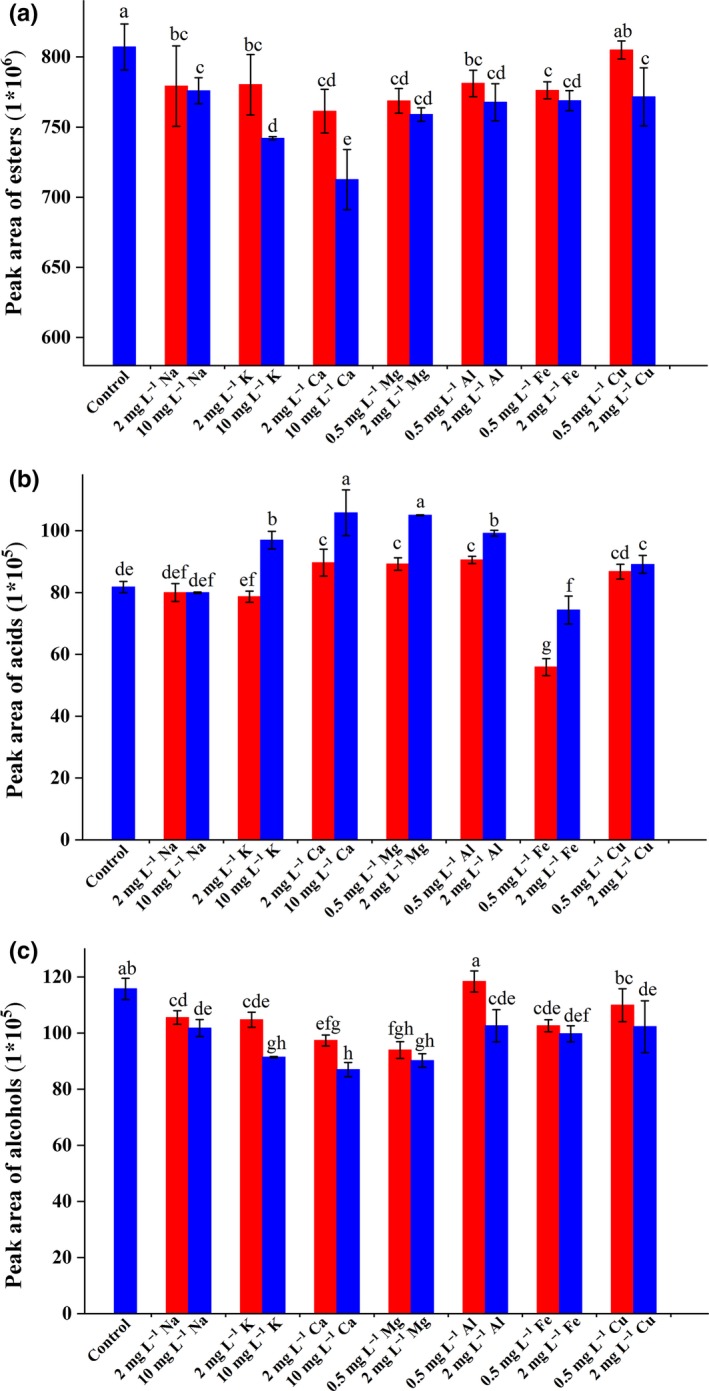
Effect of metal ions at different concentrations on esters (a), acids (b), and alcohols (c) in SFB samples. Values with different superscript letters are significantly different (p < .05)
3.3. Effects of main metals on fluorescence of SFB and acids solution
Fluorescence analysis was used to study the mechanism of interaction between metals (Na, K, Ca, Mg, Al, Fe, and Cu) and SFB. Fluorescence EEM landscapes of fresh and stored SFB samples are shown in Figure 2, and their spectral characteristics are listed in Table 3. Maximum fluorescence intensity decreased with increasing aging time in pottery jar. Maximum excitation and emission wavelengths moved from 280 nm to 250 nm and from 309 nm to 316 nm, respectively. Fluorescence of components, such as flavonoids, salicylic acid, and (–)‐epigallocatechin gallate with β‐lactoglobulin, was changed after binding with Cu2+, Sn2+, Zn2+, Mn2+, Al3+, and Fe3+ through fluorescence analysis (Lavrik & Mulloev, 2010; Zhang, Sahu, Xu, Wang, & Hu, 2017; Zhang, Shi, Sun, Xiong, & Peng, 2011). Hence, the above‐mentioned change in SFB fluorescence might be ascribed to the binding of some metals released from pottery jar to the components in SFB during storage.
Figure 2.
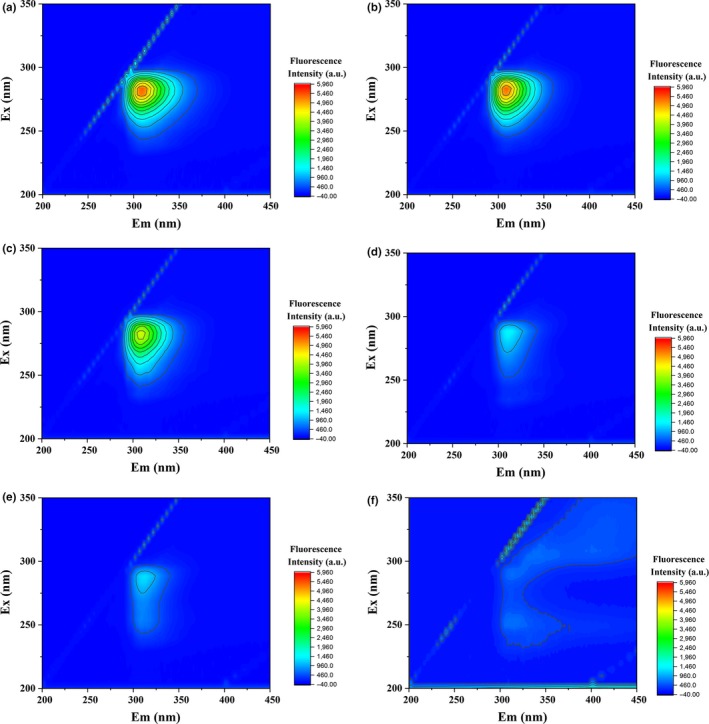
Fluorescence EEM landscapes of SFB samples. (a), (b), (c), (d), (e), and (f) are SFB samples stored in pottery jar for 0, 1, 2, 3, 5, and 10 years, respectively
Table 3.
Fluorescence EEM spectral characteristics of SFB samples aged in pottery jar
| SFB samples | Peak position λ ex/λ em (nm/nm) | Intensity (a.u.) |
|---|---|---|
| P0 | 280/309 | 5,371 |
| P1 | 280/308 | 5,355 |
| P2 | 280/307 | 4,197 |
| P3 | 285/311 | 1,441 |
| P5 | 285/312 | 1,286 |
| P10 | 250/316 | 145 |
P0, P1, P3, P5, and P10 are SFB samples stored in pottery jar for 0, 1, 3, 5, and 10 years, respectively.
Fluorescence quenching is a useful technique to determine binding affinities of metals to target components (De Costa & Jayasinghe, 2004; Tan, Kim, & Kool, 2011). Different concentrations of Na+, K+, Ca2+, Mg2+, Al3+, Fe3+, and Cu2+ were separately added into fresh SFB and acid solutions. Changes in SFB fluorescence intensity in the presence of Na+, K+, Ca2+, Mg2+, Al3+, Fe3+, and Cu2+ are shown in Figure 3. Fluorescence intensity of SFB was slightly changed by adding Na+, K+, Ca2+, Mg2+, and Al3+ at a low concentration (Figure 3a–e) but gradually decreased with increased concentrations of Fe3+ and Cu2+ (Figure 3f,g). Plots of F0/F for SFB versus metal ions at different concentrations exhibited that the binding affinity of Fe3+ was higher than that of Cu2+ (Figure 3h). Fluorescence intensities of acid solutions were almost unchanged after adding different concentrations of Na+, K+, Ca2+, Mg2+, and Al3+ into the acids solution but decreased with increased concentrations of Fe3+ and Cu2+ (Figure S2). These fluorescence quenching data showed that Fe3+ and Cu2+ had higher binding affinity with carboxyl of acetic acid, butanoic acid, and hexanoic acid in 70% (v/v) ethanol/water solution than Na+, K+, Ca2+, Mg2+, and Al3+.
Figure 3.
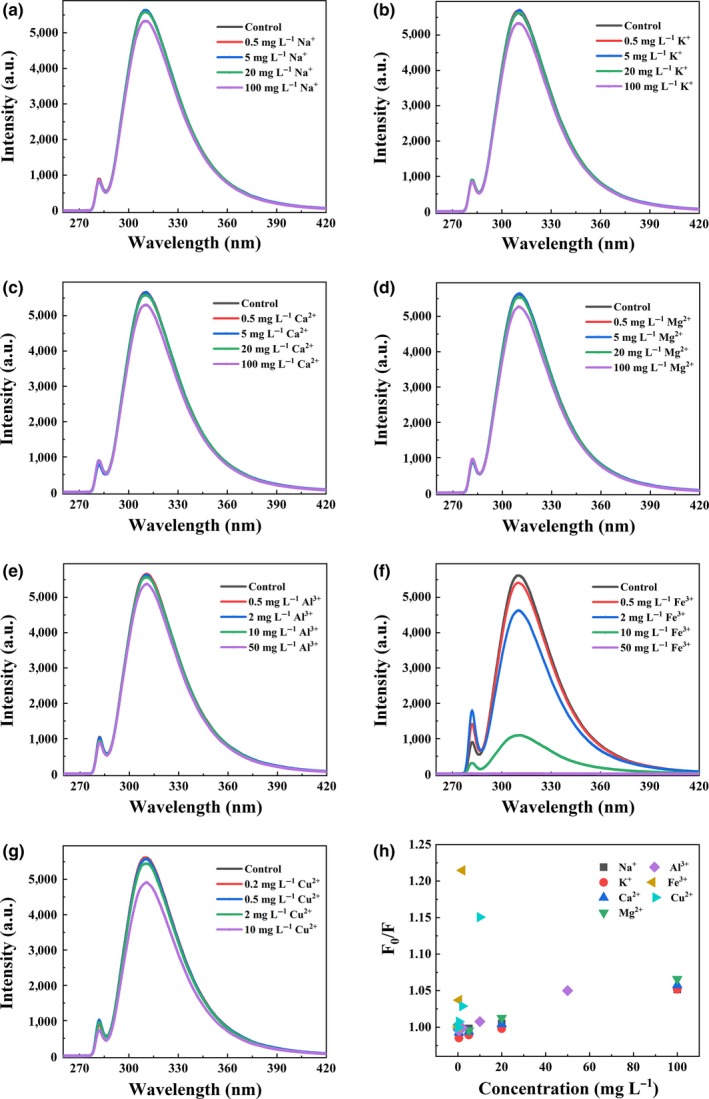
Effect of metal ions on SFB fluorescence intensity at different concentrations (a‐g). The plots for SFB fluorescence quenching by metal ions (h). λ ex = 280nm
Irto et al. (2018) reported that Fe3+, Al3+, Cu2+, and Ca2+ could bind with a compound derived from nitrilotriacetic acid. Hussain, Rahim, and Farooqui (2012) showed that the binary complexes of mandelic acid ligand with Fe3+ and Cu2+ had higher stability than those with Cd2+, Zn2+, Ni2+, and Co2+. Their results indicated that these metals, especially Fe3+ and Cu2+, could chelate or bind with different organic compounds, which is consistent with our fluorescence analyses. Besides, Fe3+ and Cu2+ even have oxidative potential and may oxidize aroma compounds in SFB (Benítez, Castro, Antonio Sanchez, Pazo, & Barroso, 2002; Danilewicz, 2007; Iwegbue, Overah, Bassey, & Martincigh, 2014). Hence, we inferred that some metal ions could bind with or oxidize aroma compounds, especially acids in SFB, and thereby form colloidal particles or complexes during the storage. This study would be helpful to understand why metals can reduce organoleptic stimulation of alcoholic beverages.
4. CONCLUSION
Some metals were dissolved out from pottery jar and stainless‐steel vessel into the SFB during storage. Their concentrations were lower than the recommended allowable daily intake. When SFB was stored in pottery jar, the concentrations of Na, K, Ca, Mg, Al, and Fe remarkably increased, and concentrations of Ba, Be, Cu, Li, Mn, Ni, Sr, Ti, and Zn slightly increased. When SFB was stored in stainless‐steel vessel, the concentrations of Fe and Cu greatly increased, and concentrations of Cr, Mn, Ni, Sr, Ti, and Zn slightly increased. Metals released from pottery jar and stainless‐steel vessel into SFB were consistent with the main components of the two containers. It is worth noting that the Cu released in SFB should be the impurity, which was introduced from welding process in production of the stainless‐steel vessel. Headspace concentrations of most esters, alcohols, ketone, furan, and aldehyde in fresh SFB decreased, whereas headspace concentrations of most acids increased after adding Na+, K+, Ca2+, Mg2+, Al3+, Fe3+, and Cu2+. These metal cations promoted the decrease in total ester content and the increase in total acid content, indicating that these metal cations had an aging‐advancing function. Furthermore, maximum fluorescence intensity of SFB decreased with increasing aging time. This result might be ascribed to the binding between metals released from the container and aroma components, especially acids in SFB during storage. This binding can promote the formation of metal‐aroma compound complexes or colloidal particles. This finding is helpful to explain the release of metal cations and the formation of aroma compounds of baijiu during storage, which is significant for modulating the flavor and sensory properties of baijiu.
CONFLICT OF INTEREST
The authors declare that they do not have any conflict of interest.
ETHICAL APPROVAL
This study does not involve any human or animal testing.
Supporting information
ACKNOWLEDGMENTS
This work was financially supported by the National Engineering Research Center of Solid‐State Brewing (K2019‐243) and the Technology Development Program of Sichuan University (19H0393).
Huang Z, Zeng Y, Liu W, Wang S, Shen C, Shi B. Effects of metals released in strong‐flavor baijiu on the evolution of aroma compounds during storage. Food Sci Nutr. 2020;8:1904–1913. 10.1002/fsn3.1475
REFERENCES
- Benítez, P. , Castro, R. , Antonio Sanchez, Pazo, J. , & Barroso, C. G. (2002). Influence of metallic content of fino sherry wine on its susceptibility to browning. Food Research International, 35(8), 785–791. 10.1016/S0963-9969(02)00075-3 [DOI] [Google Scholar]
- Bonic, M. , Tešević, V. , Nikicevic, N. , Cvejic, J. , Milosavljević, S. M. , Vajs, V. , … Jovanic, S. (2013). The contents of heavy metals in Serbian old plum brandies. Journal of the Serbian Chemical Society, 78(7), 933–945. 10.2298/JSC121106016B [DOI] [Google Scholar]
- Cui, L. (2008). Nutrition component of Chinese liquor and its benefit to human health. Liquor Making, 35, 15–18. [Google Scholar]
- Danilewicz, J. C. (2007). Interaction of sulfur dioxide, polyphenols, and oxygen in a wine‐model system: Central role of iron and copper. American Journal of Enology and Viticulture, 58(1), 53–60. [Google Scholar]
- De Costa, M. D. P. , & Jayasinghe, W. A. P. A. (2004). Detailed studies on complexation behaviour and mechanism of fluorescence quenching of naphthalene linked hydroxamic acid with transition metal ions by UV‐visible and fluorescence spectra. Journal of Photochemistry and Photobiology A: Chemistry, 162(2–3), 591–598. 10.1016/S1010-6030(03)00419-2 [DOI] [Google Scholar]
- Fan, W. , & Qian, M. C. (2005). Headspace solid phase microextraction and gas chromatography−olfactometry dilution analysis of young and aged Chinese “Yanghe Daqu” liquors. Journal of Agricultural and Food Chemistry, 53(20), 7931–7938. 10.1021/jf051011k [DOI] [PubMed] [Google Scholar]
- Franco‐Luesma, E. , & Ferreira, V. (2014). Quantitative analysis of free and bonded forms of volatile sulfur compouds in wine. Basic methodologies and evidences showing the existence of reversible cation‐complexed forms. Journal of Chromatography A, 1359, 8–15. 10.1016/j.chroma.2014.07.011 [DOI] [PubMed] [Google Scholar]
- Huang, M. , Huo, J. , Wu, J. , Zhao, M. , Sun, J. , Zheng, F. , … Li, H. (2019). Structural characterization of a tetrapeptide from Sesame flavor‐type Baijiu and its interactions with aroma compounds. Food Research International, 119, 733–740. 10.1016/j.foodres.2018.10.055 [DOI] [PubMed] [Google Scholar]
- Huang, M. , Huo, J. , Wu, J. , Zhao, M. , Zheng, F. , Sun, J. , … Li, H. (2018). Interactions between p‐Cresol and Ala‐Lys‐Arg‐Ala (AKRA) from Sesame‐Flavor‐Type Baijiu. Langmuir, 34(42), 12549–12559. 10.1021/acs.langmuir.8b02662 [DOI] [PubMed] [Google Scholar]
- Hussain, S. , Rahim, A. , & Farooqui, M. (2012). Studies of binary complexes of metal ions with mandelic acid by potentiometry. Chemistry Journal, 2(6), 206–209. [Google Scholar]
- Ibanez, J. G. , Carreon‐Alvarez, A. , Barcena‐Soto, M. , & Casillas, N. (2008). Metals in alcoholic beverages: A review of sources, effects, concentrations, removal, speciation, and analysis. Journal of Food Composition and Analysis, 21(8), 672–683. 10.1016/j.jfca.2008.06.005 [DOI] [Google Scholar]
- Irto, A. , Cardiano, P. , Chand, K. , Cigala, R. M. , Crea, F. , De Stefano, C. , … Santos, M. A. (2018). New bis‐(3‐hydroxy‐4‐pyridinone)‐NTA‐derivative: Synthesis, binding ability towards Ca2+, Cu2+, Zn2+, Al3+, Fe3+ and biological assays. Journal of Molecular Liquids, 272, 609–624. 10.1016/j.molliq.2018.09.107 [DOI] [Google Scholar]
- Iwegbue, C. M. , Overah, L. C. , Bassey, F. I. , & Martincigh, B. S. (2014). Trace metal concentrations in distilled alcoholic beverages and liquors in Nigeria. Journal of the Institute of Brewing, 120(4), 521–528. 10.1002/jib.174 [DOI] [Google Scholar]
- Jiang, X. , Xie, Y. , Wan, D. , Chen, M. , & Zheng, F. (2019). GUITAR‐enhanced facile discrimination of aged Chinese Baijiu using electrochemical impedance spectroscopy. Analytica Chimica Acta, 1059, 36–41. 10.1016/j.aca.2019.01.050 [DOI] [PubMed] [Google Scholar]
- Jin, G. , Zhu, Y. , & Xu, Y. (2017). Mystery behind Chinese liquor fermentation. Trends in Food Science & Technology, 63, 18–28. 10.1016/j.tifs.2017.02.016 [DOI] [Google Scholar]
- Lavrik, N. L. , & Mulloev, N. U. (2010). A fluorescence quenching study of the complexation of salicylic acid mono‐ and dianions with the copper (II) ion in aqueous solutions. High Energy Chemistry, 44(2), 139–142. 10.1134/S0018143910020104 [DOI] [Google Scholar]
- Li, Y. J. , Zhang, S. Y. , Huo, D. Q. , Zeng, N. , Zhou, T. , Li, D. L. , … Wang, M. (2016). Transfer of metal elements in the distillation process of Chinese Luzhou‐flavor liquor. Food Science, 37, 156–161. [Google Scholar]
- Liu, H. , & Sun, B. (2018). Effect of fermentation processing on the flavor of Baijiu. Journal of Agricultural and Food Chemistry, 66(22), 5425–5432. 10.1021/acs.jafc.8b00692 [DOI] [PubMed] [Google Scholar]
- Magnabosco, I. , Ferro, P. , Bonollo, F. , & Arnberg, L. (2006). An investigation of fusion zone microstructures in electron beam welding of copper–stainless steel. Materials Science and Engineering A, 424, 163–173. 10.1016/j.msea.2006.03.096 [DOI] [Google Scholar]
- Martin, A. E. , Watling, R. J. , & Lee, G. S. (2012). The multi‐element determination and regional discrimination of Australian wines. Food Chemistry, 133(3), 1081–1089. 10.1016/j.foodchem.2012.02.013 [DOI] [Google Scholar]
- Nose, A. , Hojo, M. , Suzuki, M. , & Ueda, T. (2004). Solute effects on the interaction between water and ethanol in aged whiskey. Journal of Agricultural and Food Chemistry, 52(17), 5359–5365. 10.1021/jf0400516 [DOI] [PubMed] [Google Scholar]
- Pohl, P. (2007). What do metals tell us about wine? TrAC Trends in Analytical Chemistry, 26(9), 941–949. 10.1016/j.trac.2007.07.005 [DOI] [Google Scholar]
- Qiao, H. , Zhang, S. , & Wang, W. (2013). Fluorescence spectroscopic and viscosity studies of hydrogen bonding in Chinese Fenjiu. Journal of Bioscience and Bioengineering, 115(4), 405–411. 10.1016/j.jbiosc.2012.10.023 [DOI] [PubMed] [Google Scholar]
- Salako, S. G. , Adekoyeni, O. O. , Adegbite, A. A. , & Hammed, T. (2016). Determination of metals content of alcohol and non‐alcoholic canned drinks consumed at Idiroko Border Town Ogun State Nigeria. British Journal of Applied Science & Technology, 12, 1–8. 10.9734/BJAST/2016/19163 [DOI] [Google Scholar]
- Schleicher, L. S. , Miller, J. W. , Watkins‐Kenney, S. C. , Carnes‐McNaughton, L. F. , & Wilde‐Ramsing, M. U. (2008). Non‐destructive chemical characterization of ceramic sherds from Shipwreck 31CR314 and Brunswick Town, North Carolina. Journal of Archaeological Science, 35(10), 2824–2838. 10.1016/j.jas.2008.05.012 [DOI] [Google Scholar]
- Šelih, V. S. , Šala, M. , & Drgan, V. (2014). Multi‐element analysis of wines by ICP‐MS and ICP‐OES and their classification according to geographical origin in Slovenia. Food Chemistry, 153, 414–423. 10.1016/j.foodchem.2013.12.081 [DOI] [PubMed] [Google Scholar]
- Song, X. , Hou, M. , Li, Z. , Zhu, L. , Zheng, F. , Huang, M. , … Sun, B. (2018). Multi‐element analysis of Baijiu (Chinese liquors) by ICP‐MS and their classification according to geographical origin. Food Quality and Safety, 2(1), 43–49. 10.1093/fqsafe/fyx030 [DOI] [Google Scholar]
- Tan, S. S. , Kim, S. J. , & Kool, E. T. (2011). Differentiating between fluorescence‐quenching metal ions with polyfluorophore sensors built on a DNA backbone. Journal of the American Chemical Society, 133(8), 2664–2671. 10.1021/ja109561e [DOI] [PMC free article] [PubMed] [Google Scholar]
- Viviers, M. Z. , Smith, M. E. , Wilkes, E. , & Smith, P. (2013). Effects of five metals on the evolution of hydrogen sulfide, methanethiol, and dimethyl sulfide during anaerobic storage of Chardonnay and Shiraz wines. Journal of Agricultural and Food Chemistry, 61(50), 12385–12396. 10.1021/jf403422x [DOI] [PubMed] [Google Scholar]
- Wang, X. , Fan, W. , & Xu, Y. (2014). Comparison on aroma compounds in Chinese soy sauce and strong aroma type liquors by gas chromatography–olfactometry, chemical quantitative and odor activity values analysis. European Food Research and Technology, 239(5), 813–825. 10.1007/s00217-014-2275-z [DOI] [Google Scholar]
- Xie, X. L. , Jiang, W. , & Wu, D. G. (2017). Anlysis of mental elements in Moutai‐flavor Baijiu. China Brewing, 36(11), 158–160. [Google Scholar]
- Xiong, X. M. , Xiang, J. , & Zhao, Y. (2013). Effects of metal ions on the quality of Baiyunbian raw liquor. Liquor Making, 3, 14. [Google Scholar]
- Xu, Y. , Sun, B. , Fan, G. , Teng, C. , Xiong, K. , Zhu, Y. , … Li, X. (2017). The brewing process and microbial diversity of strong flavour Chinese spirits: A review. Journal of the Institute of Brewing, 123(1), 5–12. 10.1002/jib.404 [DOI] [Google Scholar]
- Yang, X. B. , Zhao, Y. S. , & Liu, Y. G. (2001). Analysis of mechanism of liquor storage in ceramic pots. Liquor Making Science and Technology, 3, 39–40. [Google Scholar]
- Zhang, L. , Sahu, I. D. , Xu, M. , Wang, Y. , & Hu, X. (2017). Effect of metal ions on the binding reaction of (–)‐epigallocatechin gallate to β‐lactoglobulin. Food Chemistry, 221, 1923–1929. 10.1016/j.foodchem.2016.11.158 [DOI] [PubMed] [Google Scholar]
- Zhang, R. , Wu, Q. , & Xu, Y. (2014). Lichenysin, a cyclooctapeptide occurring in Chinese liquor Jiannanchun reduced the headspace concentration of phenolic off‐flavors via hydrogen‐bond interactions. Journal of Agricultural and Food Chemistry, 62(33), 8302–8307. 10.1021/jf502053g [DOI] [PubMed] [Google Scholar]
- Zhang, R. , Wu, Q. , Xu, Y. , & Qian, M. C. (2014). Isolation, identification, and quantification of lichenysin, a novel nonvolatile compound in Chinese distilled spirits. Journal of Food Science, 79(10), C1907–C1915. 10.1111/1750-3841.12650 [DOI] [PubMed] [Google Scholar]
- Zhang, Y. , Shi, S. , Sun, X. , Xiong, X. , & Peng, M. (2011). The effect of Cu2+ on interaction between flavonoids with different C‐ring substituents and bovine serum albumin: Structure‐affinity relationship aspect. Journal of Inorganic Biochemistry, 105(12), 1529–1537. 10.1016/j.jinorgbio.2011.08.007 [DOI] [PubMed] [Google Scholar]
- Zheng, X. W. , & Han, B. Z. (2016). Baijiu (白酒), Chinese liquor: History, classification and manufacture. Journal of Ethnic Foods, 3(1), 19–25. 10.1016/j.jef.2016.03.001 [DOI] [Google Scholar]
- Zou, W. , Zhao, C. , & Luo, H. (2018). Diversity and function of microbial community in Chinese strong‐flavor Baijiu ecosystem: A Review. Frontiers in Microbiology, 9, 671 10.3389/fmicb.2018.00671 [DOI] [PMC free article] [PubMed] [Google Scholar]
Associated Data
This section collects any data citations, data availability statements, or supplementary materials included in this article.
Supplementary Materials