Abstract
Gliomas are the most common primary brain tumors. Because of their high degree of malignancy, patient survival rates are unsatisfactory. Therefore, exploring glioma biomarkers will play a key role in early diagnosis, guiding treatment, and monitoring the prognosis of gliomas. We found two lncRNAs, six miRNAs, and nine mRNAs that were differentially expressed by analyzing genomic data of glioma patients. The diagnostic value of mRNA expression levels in gliomas was determined by receiver operating characteristic (ROC) curve analysis. Among the nine mRNAs, the area under the ROC curve values of only CEP55 and SHCBP1 were >0.7, specifically 0.834 and 0.816, respectively. Additionally, CEP55 and SHCBP1 were highly expressed in glioma specimens and showed increased expression according to the glioma grade, and outcomes of high expression patients were poor. CEP55 was enriched in the cell cycle, DNA replication, mismatch repair, and P53 signaling pathway. SHCBP1 was enriched in the cell cycle, DNA replication, ECM receptor interaction, and P53 signaling pathway. Age, grade, IDH status, chromosome 19/20 cogain, and SHCBP1 were independent factors for prognosis. Our findings suggest the PART1-hsa-miR-429-SHCBP1 regulatory network plays an important role in gliomas.
1. Introduction
Recently, gliomas have received more attention due to the unsatisfactory 5-year survival rates and median survival times of glioma patients [1–5]. However, current comprehensive treatments, comprising surgery, radiotherapy, and chemotherapy, have not achieved the desired therapeutic effects [2, 3]. With the continuous development of genomics, researchers are paying closer attention to the molecular expression changes of glioma patients, such as IDH status, MGMT promoter methylation, and 1p/19q codeletion [6, 7]. Therefore, we explored biomarkers that could guide the early diagnosis, treatment, and prognosis of gliomas through genomic data.
Most of the sequences transcribed from the human genome are long-chain noncoding RNAs (lncRNAs) [8–10]. Increasing evidence has indicated that altered interactions between lncRNAs, miRNAs, and downstream target genes are closely related to tumor development [11–14]. The lncRNAs that regulate miRNA activity by means of “sponge” adsorption are also known as competing endogenous RNAs (ceRNAs) [15]. These lncRNAs act as ceRNAs by competitively binding to miRNAs, thereby regulating protein levels and subsequently cellular behaviors [16, 17]. However, the lncRNAs that act as ceRNAs in tumors are poorly understood.
SHC binding and spindle associated 1 (SHCBP1) is located on 16q11.2 and encodes a protein in the Src homolog and collagen homolog (SHC) family that is a target of the SHC adaptor protein [18]. Studies have shown that SHCBP1 plays a role in tumor development that may be related to activation of the FGF [18], NF-κB [19], and/or TGF-β1/Smad signaling pathways [20]. Studies have also shown that SHCBP1 is involved in the development of various tumors such as hepatocellular carcinoma [21], glioma [19], breast cancer [22], and gastric cancer [23].
A centrosomal protein of 55 kDa (CEP55) is located at 10q23 and is a member of the centrosome-associated protein family [24]. CEP55 is involved in cytokinesis [25]; during late-stage cytokinesis, CEP55 recruits proteins that are directly related to cell membrane separation, such as tumor-susceptibility gene 101 (TSG101) and ALG2-interacting protein X (ALIX) [26, 27]. Regarding tumor development, CEP55 is involved in the development of glioma [28], hepatocellular carcinoma [29], breast cancer [30], lung cancer [31], and ovarian cancer [32]. Although there are reports of a relationship between SHCBP1 and CEP55 in glioma, these have only focused on their roles in the migration and invasion of glioma cells. We used glioma lncRNA and mRNA databases to analyze the role of SHCBP1 and CEP55 in glioma and their associations with prognosis.
We started with the lncRNA database to obtain differentially expressed lncRNAs, miRNAs, and mRNAs and to construct lncRNA-miRNA-mRNA regulatory networks. The receiver operating characteristic (ROC) curve showed that CEP55 and SHCBP1 had higher predictive values for patient prognosis. Furthermore, CEP55 and SHCBP1 were highly expressed in gliomas, showing higher expression in higher grade cases, and high expression patients had poorer prognoses. KEGG enrichment analysis revealed that CEP55 and SHCBP1 are enriched in multiple signaling pathways involved in tumorigenesis and development. Cox analysis found that SHCBP1 along with age, grade, IDH status, and chromosome 19/20 cogain were independent factors for determining patient prognosis.
2. Materials and Methods
2.1. Patient Samples
lncRNA and mRNA expression data were obtained from the Gene Expression Omnibus (GEO), Chinese Glioma Genome Atlas (CGGA), and The Cancer Genome Atlas (TCGA) databases. GSE103227 (https://www.ncbi.nlm.nih.gov/geo/query/acc.cgi?acc=GSE103227) contains five nontumor brain tissues and five glioma tissues. GSE103229 (https://www.ncbi.nlm.nih.gov/geo/query/acc.cgi?acc=GSE103229) contains five nontumor brain tissues and five glioma tissues. The GSE4290 and CGGA database information refers to our previous description [33, 34]. TCGA (https://www.cancer.gov/about-nci/organization/ccg/research/structural-genomics/tcga) contains 555 glioma specimens, including 210 in the World Health Organization (WHO) II, 233 in the WHO III, and 112 in the WHO IV. The WHO classification system was used according to our previous description [34]. The Xuzhou Children's Hospital Medical Ethics Committee approved this study protocol.
2.2. Identifying Differentially Expressed lncRNAs, miRNAs, mRNAs, and Overlapping Genes
To obtain differentially expressed lncRNAs, miRNAs, and mRNAs, we selected the lncRNA and mRNA databases of GSE103227 and GSE103229 and obtained differentially expressed lncRNAs and mRNAs. GSE103227 was set to logFC ≥ 3, and p values < 0.01 were considered statistically significant. GSE103229 was set to logFC ≥ 2, and p values < 0.01 were considered statistically significant. Next, we obtained miRNAs that interacted with the differentially expressed lncRNAs using miRcode software (http://www.mircode.org/). We predicted the target genes of these miRNAs using miRDB (http://mirdb.org/), miRTarBase (https://bio.tools/mirtarbase), and TargetScan (http://www.targetscan.org/vert_72/). We only accepted target genes if they were predicted by all three programs. We retained the overlapping mRNAs from these miRNA target genes and the differentially expressed mRNAs from the databases. Then, based on these overlapping mRNAs, we retained lncRNAs and miRNAs to map the ceRNA network using Cytoscape (https://cytoscape.org/). To increase the credibility of these data, we obtained a corresponding lncRNA-miRNA-mRNA regulatory network through the intersections of the respective lncRNAs, miRNAs, and mRNAs of GSE103227 and GSE103229 in R software (https://www.r-project.org/).
2.3. ROC Curve Analysis of mRNA
After obtaining differentially expressed mRNAs, we performed ROC curve analysis using R software to obtain a molecular marker that could be used to predict patient prognosis.
2.4. Expression Level and Survival Analysis of CEP55 and SHCBP1
To investigate CEP55 and SHCBP1 expression levels in nontumor brain tissue and glioma, we used the GSE4290 and CGGA databases to analyze their expression in nontumor brain tissue and different grades of gliomas. Relationships between these variables and patient prognosis were analyzed using GraphPad Prism software (GraphPad Software, Inc., San Diego, CA, USA).
2.5. Gene Set Enrichment Analysis (GSEA) and Cox Analysis of CEP55 and SHCBP1
To analyze the signaling pathways regulated by CEP55 and SHCBP1 in glioma, we performed KEGG enrichment analysis by GSEA (http://software.broadinstitute.org/gsea/index.jsp). To further determine whether CEP55 and SHCBP1 can be used as molecular markers to predict patient outcomes, we performed single-factor and multivariate Cox analyses in TCGA glioma database using R software. Multivariate Cox analysis results were presented as forest plots using R software.
2.6. Statistical Analysis
GraphPad Prism 6 was used for all statistical analyses. Statistical significance was defined as a two-tailed p value < 0.05. Univariate Cox analysis and multivariate Cox analysis were performed using R software, with p values < 0.05 considered statistically significant. GSEA was performed using GSEA software, where ∣normalized enrichment score (NES)∣ > 1, NOM p value < 0.05, and FDR q value < 0.25 were considered to indicate statistical significance.
3. Results
3.1. Acquiring Differentially Expressed lncRNAs, miRNAs, and mRNAs
To obtain lncRNAs, miRNAs, and mRNAs that predict patient prognosis, we analyzed the lncRNA and mRNA expression profiles of human glioblastomas in GSE103227 and GSE103229. In GSE103227, we obtained 24 differentially expressed lncRNAs and 23 differentially expressed mRNAs. Additionally, there were eight and 78 in GSE103229, respectively. These results are shown in the ceRNA network (Figures 1(a) and 1(b)). Based on the differentially expressed lncRNAs, we predicted miRNAs that might interact with them. GSE103227 had 13 such miRNAs, while GSE103228 had 23. To increase the reliability of these data, we obtained the intersection of differentially expressed lncRNAs, miRNAs, and mRNAs from two databases. This revealed two lncRNAs, six miRNAs, and nine mRNAs (Figures 2(a)–2(c)). PART1 interacts with hsa-miR-129-5p, hsa-miR-27a-3p, hsa-miR-301b-3p, hsa-miR-429, and hsa-miR-508-3p. AC008079 interacts with hsa-miR-107. The corresponding mRNAs for these miRNAs are shown in Figure 2(d).
Figure 1.
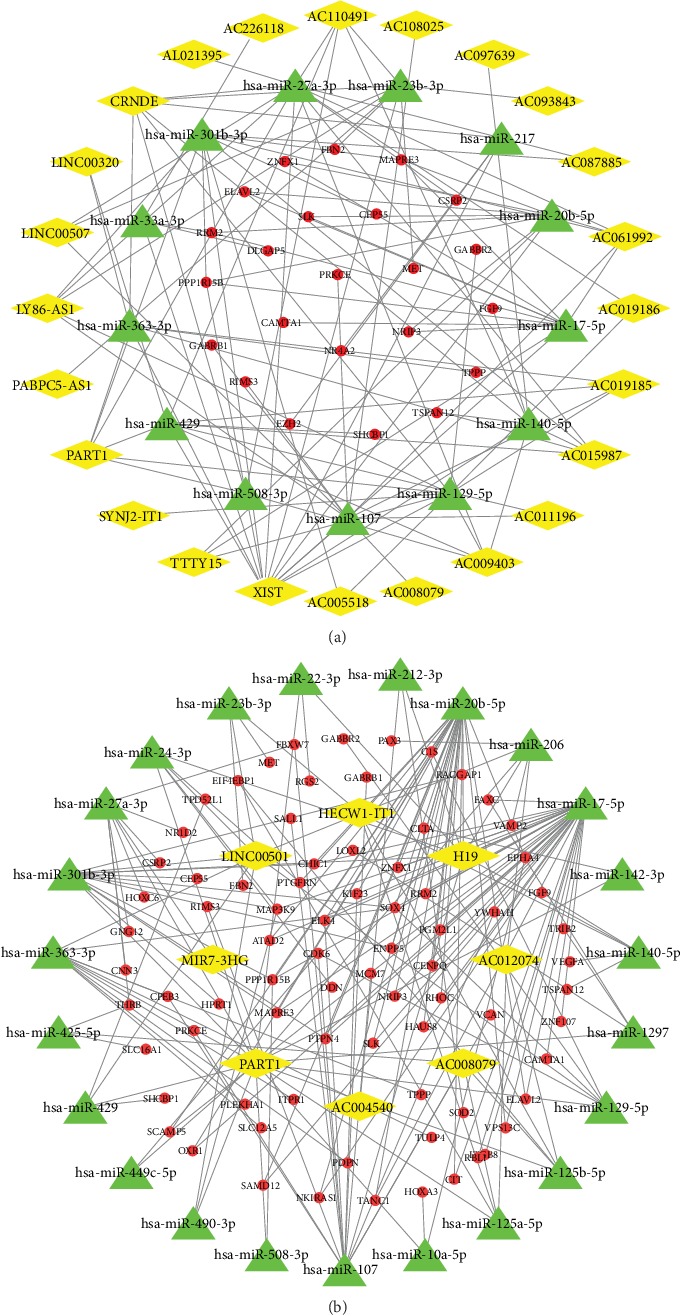
Acquisition of ceRNA networks. (a, b) To obtain lncRNA-miRNA-mRNA interaction networks, we mapped the ceRNA networks in GSE103227 (a) and GSE103229 (b). Yellow represents lncRNAs, green represents miRNAs, and red represents mRNAs.
Figure 2.
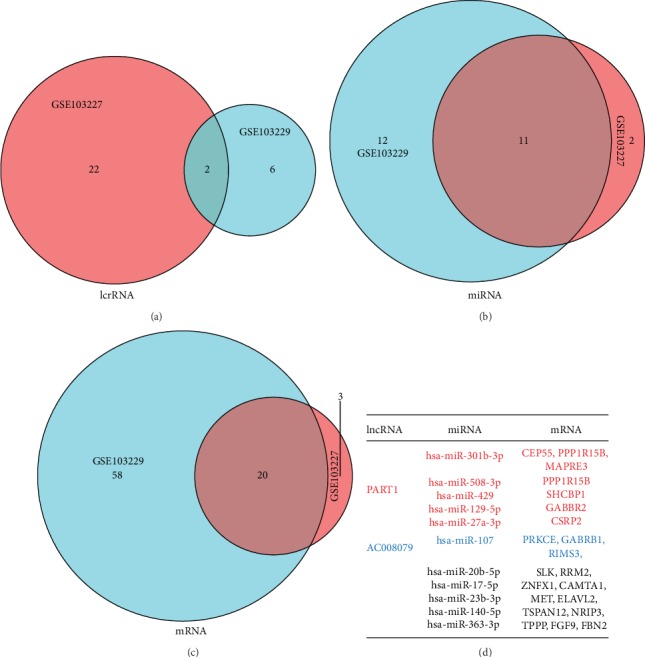
Acquisition of overlapping lncRNAs, miRNAs, and mRNAs. (a–c) To increase data credibility, we cross-validated the differentially expressed lncRNAs (a), miRNAs (b), and mRNAs (c) obtained from GSE103227 and GSE103229 to obtain a more reliable lncRNA-miRNA-mRNA regulatory network. (d) The correspondence between lncRNA-miRNA-mRNA regulatory networks are as follows: red and blue: lncRNA, miRNA, and mRNA have a corresponding relationship; black: miRNA and mRNA have no corresponding relationship.
3.2. Predicting CEP55 and SHCBP1 Expression, Patient Prognosis, and Participation in KEGG Signaling Pathways
To investigate the accuracy of differential gene prediction for patient prognosis, we plotted the ROC curves. Among them, CEP55 and SHCBP1 had values greater than 0.7. Conversely, CSRP2, GABBR2, GABRB1, MAPRE3, PPP1R15B, PRKCE, and RIMS3 had values less than 0.7 (Figures 3(a)–3(i)). By ROC curve analysis, we obtained two lncRNA-miRNA-mRNA regulatory networks: PART1-hsa-miR-429-SHCBP1 and PART1-hsa-miR-301b-3p-CEP55. By analyzing the expression of CEP55 and SHCBP1 in glioma patients and its correlations to patient prognosis, we found higher expression of CEP55 and SHCBP1 in glioma tissues than in nonmalignant tissue (Figures 4(a) and 4(b)) and increased expression with increased glioma grade (Figures 4(c) and 4(d)), and survival analysis found that patients with low CEP55 and SHCBP1 expression had better prognoses (Figures 4(e) and 4(f)). To determine the role of CEP55 and SHCBP1 in glioma, we performed KEGG analyses. These revealed that CEP55 is enriched in the cell cycle, DNA replication, mismatch repair, and P53 signaling pathway (Figure 5(a)), while SHCBP1 is enriched in the cell cycle, DNA replication, ECM receptor interaction, and P53 signaling pathway (Figure 5(b)).
Figure 3.
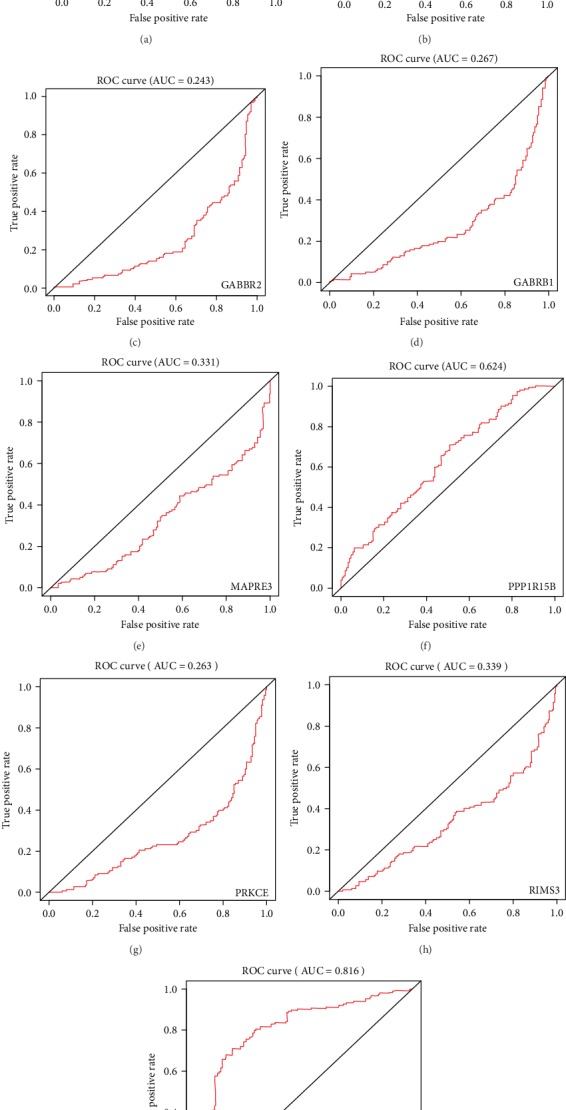
Receiver operating characteristic (ROC) curve analysis of overlapping mRNAs. To investigate the accuracy of overlapping mRNAs as a predictor of patient outcomes, we performed ROC curve analysis of CEP55 (a), CSRP2 (b), GABBR2 (c), GABRB1 (d), MAPRE3 (e), PPP1R15B (f), PRKCE (g), RIMS3 (h), and SHCBP1 (i). AUC values represent the area under the curve.
Figure 4.
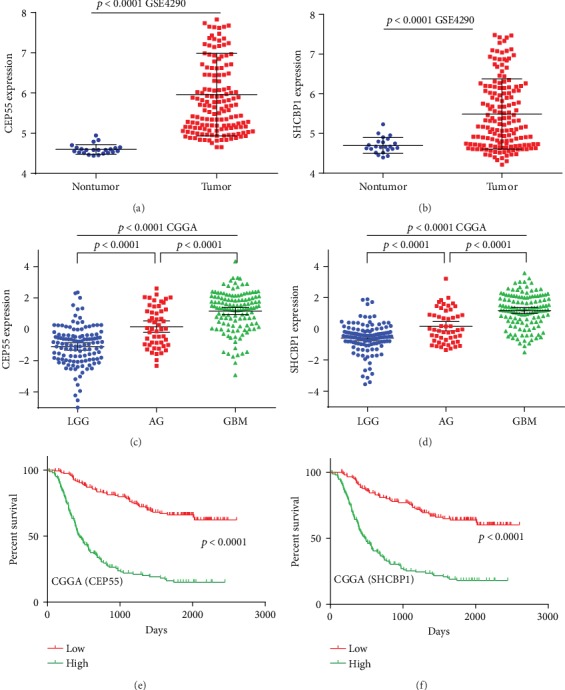
CEP55 and SHCBP1 expression levels in gliomas and their relationship to prognosis. (a, b) Expression of CEP55 (a) and SHCBP1 (b) in nontumor brain tissue and glioma tissues. (c, d) Expression of CEP55 (c) and SHCBP1 (d) in glioma tissues of different levels. (e, f) Kaplan–Meier survival curve analysis of the prognostic significance of CEP55 and SHCBP1 expression in glioma patients.
Figure 5.
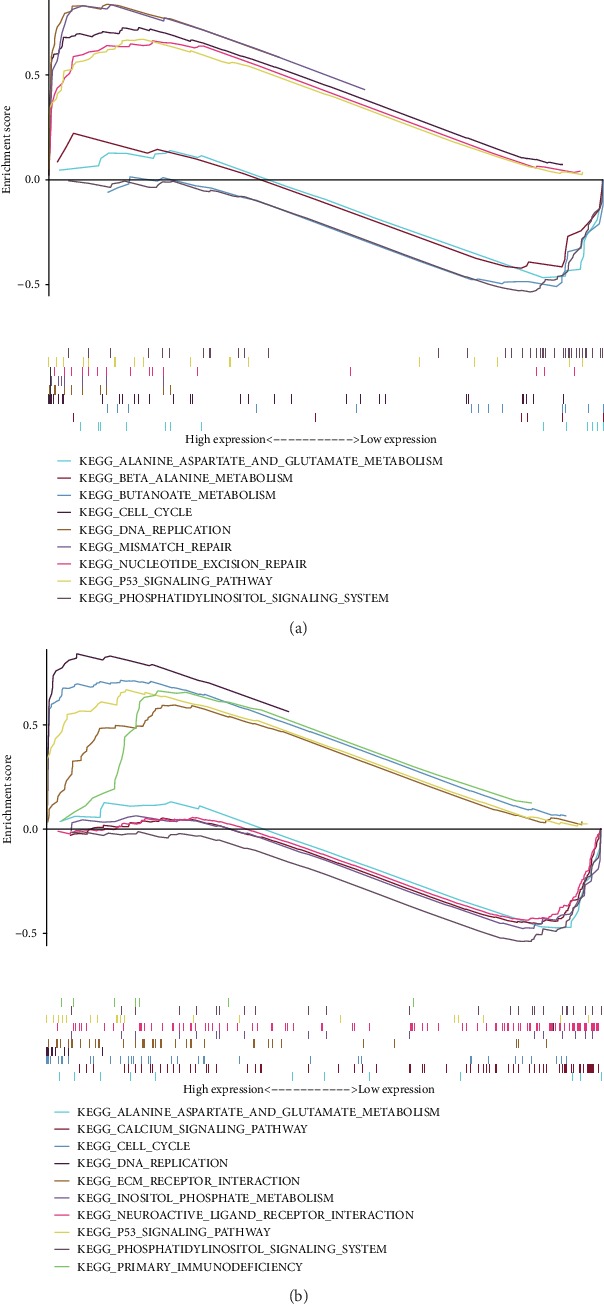
Gene Set Enrichment Analysis (GSEA) of CEP55 and SHCBP1. (a) GSEA found that CEP55 is enriched in the cell cycle, DNA replication, mismatch repair, and the P53 signaling pathway. (b) GSEA found that SHCBP1 is enriched in the cell cycle, DNA replication, ECM receptor interaction, and P53 signaling pathway.
3.3. Cox Analysis of CEP55 and SHCBP1 for Predicting Patient Prognosis
Through ROC curve analysis, we found that CEP55 and SHCBP1 had low false-positive rates as predictors of prognosis. To illustrate the relationship between CEP55, SHCBP1, and patient prognosis, we performed univariate and multivariate analyses. Univariate Cox analysis showed that except for gender and number of genetic mutations, patient prognosis increased the HR of each additional unit of the corresponding indicator, which was statistically significant. The HR of CEP55 and SHCBP1 increased by 2.26 and 2.77, respectively, for each additional unit of expression (Table 1). Multivariate Cox analysis showed that age, grade, IDH status, chromosome 19/20 cogain, and SHCBP1 were independent predictors of patient outcomes; these results are shown through forest plots (Figures 6 and 7, Table 1). Based on these results and the developed lncRNA-miRNA-mRNA regulatory network, we found that the PART1-hsa-miRNA-429-SHCBP1 signaling pathway plays an important role in glioma development.
Table 1.
Univariate analysis and multivariate analysis of the correlation of the expression of CEP55 and SHCBP1 with OS among glioma patients.
| Parameter | Univariate analysis | Multivariate analysis | |||||||
|---|---|---|---|---|---|---|---|---|---|
| 1 | 2 | ||||||||
| HR | 95% CI | p | HR | 95% CI | p | HR | 95% CI | p | |
| Age (increasing years) | 1.08 | 1.07-1.10 | 2.70 E -32 | 1.05 | 1.03-1.07 | 3.37 E -09 | 1.05 | 1.03-1.07 | 1.02 E -09 |
| Gender (male vs. female) | 0.95 | 0.69-1.32 | 0.795 | 0.95 | 0.67-1.34 | 0.769 | 0.92 | 0.65-1.31 | 0.653 |
| Grade (increasing tumor grade) | 5.15 | 3.92-6.76 | 4.33 E -32 | 1.86 | 1.32-2.66 | 0.000 | 1.88 | 1.33-2.65 | 0.000 |
| Mutation count (increasing number) | 1.00 | 1.00-1.00 | 0.340 | 0.99 | 0.98-1.00 | 0.169 | 0.99 | 0.98-1.00 | 0.125 |
| IDH status (mutant ion vs. wild) | 0.10 | 0.07-0.14 | 5.85 E -36 | 0.17 | 0.07-0.44 | 0.000 | 0.19 | 0.08-0.49 | 0.001 |
| 1p/19q codeletion (yes vs. no) | 0.24 | 0.14-0.41 | 1.60 E -07 | 0.70 | 0.24-2.02 | 0.506 | 0.70 | 0.24-2.46 | 0.521 |
| MGMT promoter status (methylated vs. unmethylated) | 0.31 | 0.22-0.43 | 2.65 E -12 | 0.94 | 0.63-1.43 | 0.800 | 0.90 | 0.60-1.35 | 0.598 |
| Chr 7 gain/Chr 10 loss (yes vs. no) | 7.97 | 5.44-11.7 | 1.98 E -26 | 1.04 | 0.67-1.61 | 0.852 | 1.07 | 0.69-1.67 | 0.753 |
| Chr 19/20 cogain (yes vs. no) | 2.72 | 1.46-5.06 | 0.002 | 0.46 | 0.23-0.91 | 0.026 | 0.44 | 0.22-0.88 | 0.020 |
| TERT expression status (yes vs. no) | 2.37 | 1.69-3.32 | 6.30 E -07 | 1.45 | 0.78-2.69 | 0.236 | 1.38 | 0.74-2.57 | 0.307 |
| ATRX status (mutant ion vs. wild) | 0.44 | 0.30-0.65 | 3.16 E -05 | 2.16 | 0.89-5.24 | 0.088 | 2.17 | 0.90-5.23 | 0.084 |
| CEP55 (increasing number) | 2.26 | 1.94-2.64 | 8.37 E -26 | 1.28 | 0.97-1.68 | 0.076 | |||
| SHCBP1 (increasing number) | 2.77 | 2.31-3.32 | 4.95 E -28 | 1.40 | 1.04-1.88 | 0.025 | |||
1 and 2 represent the results of multivariate analysis of CEP55 and SHCBP1, respectively. Bold values indicate p < 0.05. HR: hazard ratio; OS: overall survival; CI: confidence interval.
Figure 6.
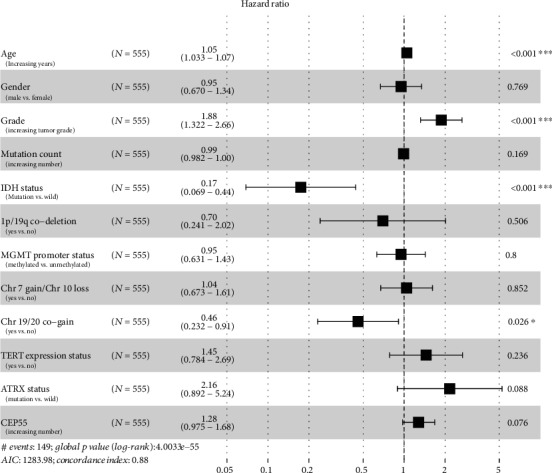
Multivariate Cox analysis of CEP55. Forest plots showing multivariate Cox analysis of whether CEP55 and multiple glioma patient characteristics can be used as independent factors to predict patient prognosis. Yes indicates that the trait is present; no indicates that the trait is absent.
Figure 7.
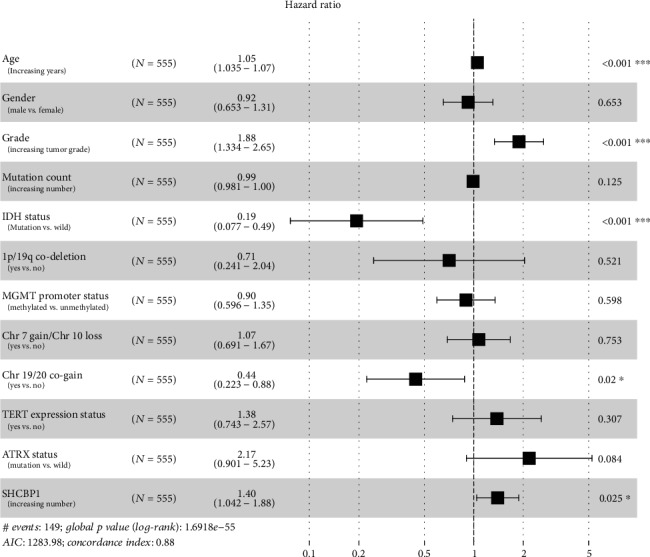
Multivariate Cox analysis of SHCBP1. Forest plots showing multivariate Cox analysis of whether SHCBP1 and multiple glioma patient characteristics can be used as independent factors to predict patient prognosis. Yes indicates that the trait is present; no indicates that the trait is absent.
4. Discussion
Through analyzing the human glioma databases GSE103227 and GSE103229, we obtained differentially expressed lncRNAs and mRNAs. We then found the miRNAs that interacted with these differentially expressed lncRNAs. To increase data, we cross-validated the two database results and obtained two lncRNAs, 11 miRNAs, and 20 mRNAs. After ROC curve analysis, we found that only CEP55 and SHCBP1 were prognostic with high accuracy, and the lncRNA-miRNA-mRNA regulatory networks used were PART1-hsa-miR-301b-CEP55 and PART1-hsa-miR-429-SHCBP1. We further analyzed CEP55 and SHCBP1 expression in gliomas, their relationships to patient prognosis, and their enriched KEGG signaling pathways. Univariate and multivariate Cox analyses revealed that SHCBP1, age, grade, IDH status, and chromosome 19/20 cogain are independent predictors of patient prognosis.
Previous studies have shown that PART1 plays a tumor suppressive function in gliomas [35], but has a procancer effect in bladder cancer [36], non-small-cell lung cancer [37], and colorectal cancer [38]. hsa-miRNA-429 plays an inhibitory role in a number of tumors [39–41], including glioma [42–44]. SHCBP1 is involved in the development of hepatocellular carcinoma [21], glioma [19], breast cancer [22], and gastric cancer [23]. However, the lncRNAs and miRNAs with which SHCBP1 interacts and whether it could be used as a prognostic molecular biomarker had been unknown. Based on the bioinformatics analysis of a large number of glioma specimens, we found that PART1 and hsa-miRNA-429 could regulate SHCBP1 expression and that SHCBP1 can be used as a molecular biomarker to judge the prognosis of glioma patients. Previous studies have found that SHCBP1 acts as a cancer-promoting gene in a variety of tumors [19–23], which is consistent with our findings. We also discovered multiple tumor-associated signaling pathways, such as cell cycle and DNA replication, that may lead to glioma development. This is consistent with the results of SHCBP1 activity in hepatocellular carcinoma cells and breast cancer cells, where it regulates cell cycle [21, 22]; SHCBP1 also regulates cell migration via EMT receptor interactions in synovial sarcoma cells [20]. Additionally, we found that SHCBP1 is low expressed in nontumor brain tissue, but as the level of glioma increases, its expression level is correspondingly increased. Finally, the prognosis of patients with high SHCBP1 expression is poor, which is consistent with the study by Zhou et al. [19]. In addition to the relationship between SHCBP1 and patient prognosis, by Cox analysis, we found that SHCBP1 expression, age, grade, IDH status, and chromosome 19/20 cogain were independent factors associated with patient prognosis. When analyzing IDH (wild) long-term (more than 36 months) and short-term (less than 10 months) survivors of primary glioblastoma, the author found that chromosome 19/20 cogain is a favorable prognostic marker for non-G-CIMP glioma (G-CIMP glioma, CpG island methylator phenotype) patients [45]. Its related mechanism still needs our further research. We obtained results similar to SHCBP1 for CEP55, but it could not be used as an independent factor to judge patient prognosis.
In conclusion, we found that CEP55 and SHCBP1 can be used to predict the prognosis of glioma patients with high accuracy and that SHCBP1 is an independent prognostic factor for glioma patients. SHCBP1 is highly expressed in glioma patients, later-staged gliomas had higher SHCBP1 expression, and SHCBP1 expression levels were negatively correlated with patient survival. SHCBP1 is enriched in multiple signaling pathways such as the cell cycle, DNA replication, ECM receptor interaction, and P53 signaling pathway. The PART1-hsa-miRNA-429-SHCBP1 signaling pathway may play an important role in glioma and provides a new direction for basic research into the underlying biology of gliomas.
Acknowledgments
The present study was supported by the Foundation of Jiangsu Provincial Health Department (grant no. YG201514) and Xuzhou Medical University (grant no. 2018KJ09).
Contributor Information
Lei Wang, Email: wltxj@sina.com.
Yong Gao, Email: drygao@126.com.
Data Availability
The authors confirm that all data underlying the findings are fully available without restriction. All relevant data are within the paper.
Conflicts of Interest
The authors declare that they have no conflicts of interest.
Authors' Contributions
Chengmin Xuan, Mingwei Jin, and Lei Wang contributed equally to this paper. The corresponding author Lei Wang is the affiliated hospital of Xuzhou Medical University, which is the fourth unit. Lei Wang is a member of Xuzhou Children's Hospital.
References
- 1.Meyer M. A. Malignant gliomas in adults. New England Journal of Medicine. 2008;359(17):p. 1850. doi: 10.1056/nejmc086380. [DOI] [PubMed] [Google Scholar]
- 2.Buonerba C., Di Lorenzo G., Marinelli A., et al. A comprehensive outlook on intracerebral therapy of malignant gliomas. Critical Reviews in Oncology/Hematology. 2011;80(1):54–68. doi: 10.1016/j.critrevonc.2010.09.001. [DOI] [PubMed] [Google Scholar]
- 3.Sherman J. H., Hoes K., Marcus J., Komotar R. J., Brennan C. W., Gutin P. H. Neurosurgery for brain tumors: update on recent technical advances. Current Neurology and Neuroscience Reports. 2011;11(3):313–319. doi: 10.1007/s11910-011-0188-9. [DOI] [PubMed] [Google Scholar]
- 4.Fiorentino A., Chiumento C., Caivano R., Cozzolino M., Pedicini P., Fusco V. Adjuvant radiochemotherapy in the elderly affected by glioblastoma: single-institution experience and literature review. La Radiologia Medica. 2013;118(5):870–881. doi: 10.1007/s11547-012-0906-7. [DOI] [PubMed] [Google Scholar]
- 5.Stupp R., Roila F., E G W Group Malignant glioma: ESMO clinical recommendations for diagnosis, treatment and follow-up. Annals of Oncology. 2009;20(Supplement 4):iv126–iv128. doi: 10.1093/annonc/mdp151. [DOI] [PubMed] [Google Scholar]
- 6.Labreche K., Kinnersley B., Berzero G., et al. Diffuse gliomas classified by 1p/19q co-deletion, Tert promoter and Idh mutation status are associated with specific genetic risk loci. Acta Neuropathologica. 2018;135(5):743–755. doi: 10.1007/s00401-018-1825-z. [DOI] [PMC free article] [PubMed] [Google Scholar]
- 7.Fontana L., Tabano S., Bonaparte E., et al. Mgmt-methylated alleles are distributed heterogeneously within glioma samples irrespective of Idh status and chromosome 10q deletion. Journal of Neuropathology & Experimental Neurology. 2016;75(8):791–800. doi: 10.1093/jnen/nlw052. [DOI] [PMC free article] [PubMed] [Google Scholar]
- 8.Gong Z., Zhang S., Zhang W., et al. Long non-coding RNAs in cancer. Science China: Life Sciences. 2012;55(12):1120–1124. doi: 10.1007/s11427-012-4413-9. [DOI] [PubMed] [Google Scholar]
- 9.Huang B. Long non-coding RNA: dancing on immune stage. Science China: Life Sciences. 2014;57(6):643–644. doi: 10.1007/s11427-014-4669-3. [DOI] [PubMed] [Google Scholar]
- 10.Bo H., Gong Z., Zhang W., et al. Upregulated long non-coding RNA Afap1-As1 expression is associated with progression and poor prognosis of nasopharyngeal carcinoma. Oncotarget. 2015;6(24):20404–20418. doi: 10.18632/oncotarget.4057. [DOI] [PMC free article] [PubMed] [Google Scholar]
- 11.Zeng Z., Bo H., Gong Z., et al. AFAP1-AS1, a long noncoding RNA upregulated in lung cancer and promotes invasion and metastasis. Tumour Biology. 2016;37(1):729–737. doi: 10.1007/s13277-015-3860-x. [DOI] [PubMed] [Google Scholar]
- 12.Zhou X., Ye F., Yin C., Zhuang Y., Yue G., Zhang G. The interaction between MiR-141 and lncRNA-H19 in regulating cell proliferation and migration in gastric cancer. Cellular Physiology and Biochemistry. 2015;36(4):1440–1452. doi: 10.1159/000430309. [DOI] [PubMed] [Google Scholar]
- 13.Liang W. C., Fu W. M., Wong C. W., et al. The lncRNA H19 promotes epithelial to mesenchymal transition by functioning as miRNA sponges in colorectal cancer. Oncotarget. 2015;6(26):22513–22525. doi: 10.18632/oncotarget.4154. [DOI] [PMC free article] [PubMed] [Google Scholar]
- 14.Sun T., Wong N. Transforming growth factor-beta-induced long noncoding RNA promotes liver cancer metastasis via RNA-RNA crosstalk. Hepatology. 2015;61(2):722–724. doi: 10.1002/hep.27599. [DOI] [PubMed] [Google Scholar]
- 15.Salmena L., Poliseno L., Tay Y., Kats L., Pandolfi P. P. A ceRNA hypothesis: the Rosetta Stone of a hidden RNA language? Cell. 2011;146(3):353–358. doi: 10.1016/j.cell.2011.07.014. [DOI] [PMC free article] [PubMed] [Google Scholar]
- 16.Wang J., Liu X., Wu H., et al. Creb up-regulates long non-coding RNA, HULC expression through interaction with microrna-372 in liver cancer. Nucleic Acids Research. 2010;38(16):5366–5383. doi: 10.1093/nar/gkq285. [DOI] [PMC free article] [PubMed] [Google Scholar]
- 17.Gao L., Wang X., Guo S., et al. LncRNA HOTAIR functions as a competing endogenous RNA to upregulate SIRT1 by sponging miR-34a in diabetic cardiomyopathy. Journal of Cellular Physiology. 2019;234(4):4944–4958. doi: 10.1002/jcp.27296. [DOI] [PubMed] [Google Scholar]
- 18.Schmandt R., Liu S. K., McGlade C. J. Cloning and characterization of mPAL, a novel Shc SH2 domain-binding protein expressed in proliferating cells. Oncogene. 1999;18(10):1867–1879. doi: 10.1038/sj.onc.1202507. [DOI] [PubMed] [Google Scholar]
- 19.Zhou Y., Tan Z., Chen K., et al. Overexpression of Shcbp1 promotes migration and invasion in gliomas by activating the NF-κB signaling pathway. Molecular Carcinogenesis. 2018;57(9):1181–1190. doi: 10.1002/mc.22834. [DOI] [PubMed] [Google Scholar]
- 20.Peng C., Zhao H., Song Y., et al. SHCBP1 promotes synovial sarcoma cell metastasis via targeting TGF-β1/Smad signaling pathway and is associated with poor prognosis. Journal of Experimental & Clinical Cancer Research. 2017;36(1):p. 141. doi: 10.1186/s13046-017-0616-z. [DOI] [PMC free article] [PubMed] [Google Scholar]
- 21.Tao H. C., Wang H. X., Dai M., et al. Targeting SHCBP1 inhibits cell proliferation in human hepatocellular carcinoma cells. Asian Pacific Journal of Cancer Prevention. 2013;14(10):5645–5650. doi: 10.7314/apjcp.2013.14.10.5645. [DOI] [PubMed] [Google Scholar]
- 22.Feng W., Li H. C., Xu K., et al. SHCBP1 is over-expressed in breast cancer and is important in the proliferation and apoptosis of the human malignant breast cancer cell line. Gene. 2016;587(1):91–97. doi: 10.1016/j.gene.2016.04.046. [DOI] [PubMed] [Google Scholar]
- 23.Dong Y. D., Yuan Y. L., Yu H. B., Tian G. J., Li D. Y. SHCBP1 is a novel target and exhibits tumor-promoting effects in gastric cancer. Oncology Reports. 2019;41(3):1649–1657. doi: 10.3892/or.2018.6952. [DOI] [PMC free article] [PubMed] [Google Scholar]
- 24.Fabbro M., Zhou B. B., Takahashi M., et al. Cdk1/Erk2- and Plk1-dependent phosphorylation of a centrosome protein, Cep55, is required for its recruitment to midbody and cytokinesis. Developmental Cell. 2005;9(4):477–488. doi: 10.1016/j.devcel.2005.09.003. [DOI] [PubMed] [Google Scholar]
- 25.Chang Y. C., Wu C. H., Yen T. C., Ouyang P. Centrosomal protein 55 (Cep55) stability is negatively regulated by P53 protein through polo-like kinase 1 (Plk1) The Journal of Biological Chemistry. 2012;287(6):4376–4385. doi: 10.1074/jbc.M111.289108. [DOI] [PMC free article] [PubMed] [Google Scholar]
- 26.Lee H. H., Elia N., Ghirlando R., Lippincott-Schwartz J., Hurley J. H. Midbody targeting of the ESCRT machinery by a noncanonical coiled coil in CEP55. Science. 2008;322(5901):576–580. doi: 10.1126/science.1162042. [DOI] [PMC free article] [PubMed] [Google Scholar]
- 27.Morita E., Sandrin V., Chung H. Y., et al. Human ESCRT and ALIX proteins interact with proteins of the midbody and function in cytokinesis. The EMBO Journal. 2007;26(19):4215–4227. doi: 10.1038/sj.emboj.7601850. [DOI] [PMC free article] [PubMed] [Google Scholar]
- 28.Wang G., Liu M., Wang H., et al. Centrosomal protein of 55 regulates glucose metabolism, proliferation and apoptosis of glioma cells via the Akt/Mtor signaling pathway. Journal of Cancer. 2016;7(11):1431–1440. doi: 10.7150/jca.15497. [DOI] [PMC free article] [PubMed] [Google Scholar]
- 29.Chen C. H., Lu P. J., Chen Y. C., et al. FLJ10540-elicited cell transformation is through the activation of PI3-kinase/AKT pathway. Oncogene. 2007;26(29):4272–4283. doi: 10.1038/sj.onc.1210207. [DOI] [PubMed] [Google Scholar]
- 30.Inoda S., Hirohashi Y., Torigoe T., et al. Cep55/C10orf3, a tumor antigen derived from a centrosome residing protein in breast carcinoma. Journal of Immunotherapy. 2009;32(5):474–485. doi: 10.1097/CJI.0b013e3181a1d109. [DOI] [PubMed] [Google Scholar]
- 31.Jiang C., Zhang Y., Li Y., et al. High CEP55 expression is associated with poor prognosis in non-small-cell lung cancer. OncoTargets and Therapy. 2018;11:4979–4990. doi: 10.2147/OTT.S165750. [DOI] [PMC free article] [PubMed] [Google Scholar]
- 32.Zhang W., Niu C., He W., et al. Upregulation of centrosomal protein 55 is associated with unfavorable prognosis and tumor invasion in epithelial ovarian carcinoma. Tumour Biology. 2016;37(5):6239–6254. doi: 10.1007/s13277-015-4419-6. [DOI] [PMC free article] [PubMed] [Google Scholar]
- 33.Gao Y., Han D., Sun L., et al. PPARα regulates the proliferation of human glioma cells through miR-214 and E2F2. BioMed Research International. 2018;2018:10. doi: 10.1155/2018/3842753.3842753 [DOI] [PMC free article] [PubMed] [Google Scholar]
- 34.Xuan C., Gao Y., Jin M., et al. Bioinformatic Analysis of Cacybp-Associated Proteins Using Human Glioma Databases. IUBMB Life. 2019;71(7):827–834. doi: 10.1002/iub.1999. [DOI] [PubMed] [Google Scholar]
- 35.Jin Z., Piao L., Sun G., Lv C., Jing Y., Jin R. Long non-coding RNA PART1 exerts tumor suppressive functions in glioma via sponging miR-190a-3p and inactivation of PTEN/AKT pathway. OncoTargets and Therapy. 2020;13:1073–1086. doi: 10.2147/OTT.S232848. [DOI] [PMC free article] [PubMed] [Google Scholar]
- 36.Hu X., Feng H., Huang H., et al. Downregulated long noncoding RNA PART1 inhibits proliferation and promotes apoptosis in bladder cancer. Technology in Cancer Research & Treatment. 2019;18 doi: 10.1177/1533033819846638. [DOI] [PMC free article] [PubMed] [Google Scholar]
- 37.Li M., Zhang W., Zhang S., Wang C., Lin Y. Part1 expression is associated with poor prognosis and tumor recurrence in stage I-III non-small cell lung cancer. Journal of Cancer. 2017;8(10):1795–1800. doi: 10.7150/jca.18848. [DOI] [PMC free article] [PubMed] [Google Scholar] [Retracted]
- 38.Lou T., Ke K., Zhang L., Miao C., Liu Y. LncRNA PART1 facilitates the malignant progression of colorectal cancer via miR-150-5p/LRG1 axis. Journal of Cellular Biochemistry. 2020 doi: 10.1002/jcb.29635. [DOI] [PubMed] [Google Scholar]
- 39.Liu X., Liu Y., Wu S., et al. Tumor-suppressing effects of miR-429 on human osteosarcoma. Cell Biochemistry and Biophysics. 2014;70(1):215–224. doi: 10.1007/s12013-014-9885-8. [DOI] [PubMed] [Google Scholar]
- 40.Lei W., Liu Y. E., Zheng Y., Qu L. MiR-429 inhibits oral squamous cell carcinoma growth by targeting Zeb1. Medical Science Monitor. 2015;21:383–389. doi: 10.12659/MSM.893412. [DOI] [PMC free article] [PubMed] [Google Scholar]
- 41.Wang Z., Zhu Z., Lin Z., et al. MiR-429 suppresses cell proliferation, migration and invasion in nasopharyngeal carcinoma by downregulation of Tln1. Cancer Cell International. 2019;19(1):p. 115. doi: 10.1186/s12935-019-0831-0. [DOI] [PMC free article] [PubMed] [Google Scholar]
- 42.Chen W., Zhang B., Guo W., et al. miR-429 inhibits glioma invasion through BMK1 suppression. Journal of Neuro-Oncology. 2015;125(1):43–54. doi: 10.1007/s11060-015-1887-x. [DOI] [PubMed] [Google Scholar]
- 43.Dong H., Hao X., Cui B., Guo M. MiR-429 suppresses glioblastoma multiforme by targeting SOX2. Cell Biochemistry and Function. 2017;35(5):260–268. doi: 10.1002/cbf.3271. [DOI] [PubMed] [Google Scholar]
- 44.Peng G., Liao Y., Shen C. miRNA-429 inhibits astrocytoma proliferation and invasion by targeting BMI1. Pathology Oncology Research. 2017;23(2):369–376. doi: 10.1007/s12253-016-0113-2. [DOI] [PubMed] [Google Scholar]
- 45.Geisenberger C., Mock A., Warta R., et al. Molecular profiling of long-term survivors identifies a subgroup of glioblastoma characterized by chromosome 19/20 co-gain. Acta Neuropathologica. 2015;130(3):419–434. doi: 10.1007/s00401-015-1427-y. [DOI] [PubMed] [Google Scholar]
Associated Data
This section collects any data citations, data availability statements, or supplementary materials included in this article.
Data Availability Statement
The authors confirm that all data underlying the findings are fully available without restriction. All relevant data are within the paper.


