

Abstract
Sleep problems are related to the elevated levels of the Alzheimer’s disease (AD) biomarker β-amyloid (Aβ). Hypotheses about the causes of this relationship can be generated from molecular markers of sleep problems identified in rodents. A major marker of sleep deprivation is Homer1a, a neural protein coded by the HOMER1 gene, which has also been implicated in brain Aβ accumulation. Here, we tested whether the relationship between cortical Aβ accumulation and self-reported sleep quality, as well as changes in sleep quality over 3 years, was stronger in cortical regions with high HOMER1 mRNA expression levels. In a sample of 154 cognitively healthy older adults, Aβ correlated with poorer sleep quality cross-sectionally and longitudinally (n = 62), but more strongly in the younger than in older individuals. Effects were mainly found in regions with high expression of HOMER1. The anatomical distribution of the sleep-Aβ relationship followed closely the Aβ accumulation pattern in 69 patients with mild cognitive impairment or AD. Thus, the results indicate that the relationship between sleep problems and Aβ accumulation may involve Homer1 activity in the cortical regions, where harbor Aβ deposits in AD. The findings may advance our understanding of the relationship between sleep problems and AD risk.
Keywords: Alzheimer’s disease, amyloid, gene expression, HOMER1, sleep
Introduction
Sleep is critical for brain function, and disturbed sleep is associated with many prevalent neurological and psychiatric conditions, including dementia (Shi et al. 2018). Sleep disturbance is an early symptom of Alzheimer’s disease (AD) (Prinz et al. 1982; Hatfield et al. 2004; Videnovic et al. 2014; Irwin and Vitiello 2019), and a bidirectional relationship is suggested between sleep and β-amyloid (Aβ) accumulation (Mander et al. 2015). Sleep quality is affected by aging (Scullin and Bliwise 2015; Mander et al.2017), and understanding the relationship between sleep and Aβ accumulation in cognitively healthy older adults could aid in understanding the role of sleep in early stages of neurodegeneration. A relationship between sleep and Aβ is demonstrated in experimental human (Ooms et al. 2014) and rodent (Xie et al.2013) studies, and also found in observational studies (Spira et al.2013; Sprecher et al. 2015; Branger et al. 2016; Brown et al. 2016). Here, we approached the question on how sleep problems and Aβ accumulation are related in humans from different angles. First, we tested the anatomical configuration of the Aβ-sleep relationship, that is in which cortical regions Aβ accumulation and sleep problems are most strongly related, and whether these are the regions accumulating Aβ in AD. We hypothesized that sleep problems, and in particular longitudinal increases in sleep problems, would be associated with Aβ accumulation in AD-vulnerable regions. Since sleep quality tends to be stable over time (Pillai et al. 2015), increase in sleep problems may reflect on the initiation of brain pathology. Thus, we hypothesized a relationship between longitudinal changes in sleep problems and Aβ deposition. Furthermore, the accumulation of Aβ is assumed to be an early event in AD, possibly plateauing even before the stage of diagnosis (Jack et al. 2010, 2013; Sperling,et al. 2011). Thus, we tested whether the relationship between Aβ and sleep problems differed between middle-age and early senescence compared with older age.
Importantly, we then tested whether cortical regions characterized by stronger sleep-Aβ relationships also showed higher levels of HOMER1 mRNA expression. HOMER1, classified as an immediate early gene, codes the neuronal protein Homer1a, which is the best-known molecular marker of sleep need (Maret,et al. 2007; Archer and Oster 2015; Diering et al. 2017). Sleep loss has a profound effect on expression of selective genes. Homer1a is widely expressed in the human cortex, especially in the frontal lobe (Szumlinski et al. 2006), and broadly upregulated in the brains of sleep-deprived rodents (Cirelli et al. 2006; Mackiewicz et al. 2007). Consistent activation of Homer1a is shown in mice when awake (Brakeman et al. 1997; Szumlinski,et al. 2006; Thompson et al. 2010), indicating a role for sleep in intracellular calcium homeostasis for protecting and recovering from glutamate-induced neuronal hyperactivityimposed by wakefulness (Maret et al. 2007). Importantly, because Homer1a is activity-dependent, it has been suggested to regulate Aβ toxicity at the early stage of AD (Luo et al. 2012), and reduced Homer1a mRNA expression has been found in the amyloid precursor protein and presenilin-1 (APP + PS1) transgenic mice (Dickey et al. 2003). In the latter study, normal expression was found in regions that did not accumulate Aβ, implying a role for Homer1a in Aβprocessing. An experimental study further showed that the activity-dependent expression of Homer1a counteracted suppression of large-conductance Ca2+-activated K+ (BK—Big Potassium) channels was demonstrated by the injections of Aβ proteins into rat and mouse neocortical pyramidal cells (Yamamoto et al. 2011). Aβ production and release are assumed to result from synaptic activity, which can explain why Aβ accumulations in humans are preferably found in multi-modal brain regions that show high-neural activity (Jagust and Mormino 2011). Thus, a first step in exploring the role of HOMER1 for Aβ accumulation in humans could be to test how its mRNA expression levels in the cerebral cortex maps onto Aβ accumulation in AD and the regional distribution of sleep-Aβ relationships in aging. We hypothesized that HOMER1 was upregulated in the same cortical regions, where Aβ accumulation due to sleep problems or AD is found.
Materials and Methods
Sample
The sample was collected in two ways. The main sample consisted of 109 cognitively normal middle-aged and older adults (49.2–80.9 years) was drawn from the ongoing studies at the Center for Lifespan Changes in Brain and Cognition, University of Oslo (Westlye et al. 2010a, 2010b; Storsve et al. 2014; Walhovd,et al. 2014; de Lange et al. 2016), for all of whom amyloid PET, magnetic resonance imaging (MRI), and sleep data were available. Forty-five additional participants were later added—yielding a total of 154 participant in this extended sample—to allow us to test the robustness of the results obtained in the main sample. All procedures followed the Declaration of Helsinki, approved by the Regional Ethical Committee of Southern Norway, and written consent was obtained from all. Participants were screened with a health interview, were right handed, fluent Norwegian speakers, with normal hearing and normal or corrected to normal vision. Exclusion criteria were the history of injury or disease known to affect central nervous system function, including neurological or psychiatric illness or serious head trauma, undergoing psychiatric treatment and use of psychoactive drugs, including sleep medication. MRIs were evaluated by a neuroradiologist and required to be free of significant injuries or conditions. Participants scored ≥26 on the Mini Mental State Examination (Folstein et al. 1975), Beck Depression Inventory [BDI (Beck and Steer 1984; Beck 1987) ≤16 and IQ ≥ 85] (Wechsler 1999). Sixty-two participants had 3-years longitudinal data (Table 1). Sleep quality was assessed using the Pittsburgh Sleep Quality Index (PSQI) (Buysse et al. 1989). PSQI assesses seven domains of sleep quality (quality, latency, duration, efficiency, problems, medication, and daytime tiredness) in addition to a global score over a 1-month interval. The global score ranges from 0 to 21 and was used as the measure of sleep quality, with high scores indicating lower quality. Participants also underwent a visuo-constructive recall test (The Rey–Osterreith Complex Figure Text: CFT) (Poulton and Moffitt 1995), where they were asked to copy a complex figure on a sheet of paper. Thirty minutes later, they were given an unannounced test, asked to reproduce the drawing from their memory. We calculated the score at baseline and follow-up, as well as annualized percent change in score across the 3 years between time points.
Table 1.
Sample descriptives
| Full sample (n = 109) | Longitudinal PSQI (n = 62) | ||
|---|---|---|---|
| Baseline | Follow-up | ||
| Age | 66.7 (49.2–80.9) | 62.1 (8.3) | 66.4 (7.9) |
| Sex (female/male) | 64/45 | 37/25 | 27/25 |
| MMSE | 28.8 (25–30) | 29.0 (27–30) | 28.5 (25–30) |
| PSQI Global | 5.0 (2.77) | 4.5 (2.73) | 4.5 (2.77) |
| BMI | 25.8 (3.96) | 26.0 (4.21) | 25.5 (3.80) |
| Beck (BDI) | 5.1 (0–18) | 5.11 (3.82) | 4.48 (4.30) |
| WASI vocabulary (t-score) | 59.9 (6.6) | 59.4 (7.1) | 59.9 (5.9) |
| WASI matrices (t-score) | 63.0 (8.3) | 62.4 (7.9) | 63.9 (7.9) |
| Rey Complex Figure (memory) | 18.0 (6.3) | 17.9 (5.4) | 17.7 (6.2) |
Beck: Available for 82. Registered 3 years before baseline in the longitudinal sample for 61. BMI: Available for 60 at baseline in the longitudinal subsample. Rey available for 87 in the full sample, and 61 in the longitudinal sample. Follow up was at a mean of 3 years after baseline.
PET scans from 20 cognitively healthy older adults (age 71.3–86.2 years, MMSE ≥ 28) and 69 patients with mild cognitive impairment (MCI)/AD (n = 44/25, 55.3–88.2 years) were obtained from the AD Neuroimaging Initiative (ADNI) database.
In addition, a replication sample was taken from (Fjell et al. 2018) where Aβ42 was measured in the CSF of 91 cognitively healthy older adults from the COGNORM study (Idland et al. 2016). The study was conducted in accordance with the Declaration of Helsinki. All participants gave informed consent as approved by the Regional Committee for Medical and Health Research Ethics. Sleep quality was assessed after the second MRI in this study, using PSQI, that is 3 years after baseline CSF assessment. This sample was used to replicate the PSQI-Aβ relationship in the main sample. General recruitment and screening procedures are previously described (Idland et al. 2016). In short, patients were scheduled for elective gynecological (genital prolapse), urological (benign prostate hyperplasia, prostate cancer, or bladder tumor/cancer), or orthopedic (knee or hip replacement) surgery in spinal anesthesia, turning 65 years or older the year of inclusion. Dementia, previous stroke with sequela, Parkinson’s disease, and other neurodegenerative diseases likely to affect cognitive function were initial exclusion criteria. As part of the clinical evaluation, participants were assessed with a multi-domain battery of cognitive tests before surgery, comprising the MMSE (Folstein et al. 1975), Clock Drawing Test (Shulman 2000), Word List Memory Task (Morris et al. 1989), Trail Making Test A and B (Reitan 1955), Kendrick Object Learning Test (Kendrick et al. 1979), and verbal fluency (FAS test and animal naming) (Spreen and Strauss 1991).CSF samples were collected by the anesthesiologist in conjunction with spinal anesthesia. About 172 participants were tested at baseline. From this pool of participants, we further selected only cognitively healthy participants based on the cognitive and clinical screening, as detailed elsewhere (Fjell et al. 2018). After screening, 103 participants were available, and 91 of these also completed the Pittsburg Sleep Quality Index (PSQI) (mean age 72 years, range 64–89). See Supplementary Material for details on the sample.
Magnetic Resonance Imaging
MRI data was collected using a 12-channel head coil on a 1.5T Avanto (Siemens Medical Solutions) at Oslo University Hospital, with two repetitions of a 160 slices sagittal T1-weighted magnetization prepared rapid gradient echo sequence: repetition time (TR)/echo time (TE)/time to inversion (TI)/flip angle (FA) = 2400 ms/3.61 ms/1000 ms/8°, matrix = 192 × 192, field of view = 240, voxel size = 1.25 × 1.25 × 1.20 mm, and scan time 4 min 42 s. Cortical surfaces were reconstructed by the use of FreeSurfer 5.3 (Fischl et al. 1999; Fischl and Dale 2000).
Positron Emission Tomography
Flutemetamol (18F) PET was used to quantify the cortical Aβ accumulation. Scans were processed and partial voluming corrected by use of the Muller–Gartner method, registered to the individual participant’s cortical surface, and cortical surface-based smoothing (full-width, half-maximum = 15 mm) applied, shown to reduce bias and variance in PET measurements (Greve et al. 2014). The cortical PET signal at each surface point was divided by the mean signal of the cerebellum cortex to obtain standardized uptake values. For some analyses, global cortical Aβ accumulation was calculated by use of principal component analysis of the 68 regions, accounting for 68.1% of the variance, with only two regions loading lower than40 (right and left cuneus), indicating that this is a reasonable data reduction approach. For ADNI participants, PIB-PET images were acquired according to protocol (Jack et al. 2008; Jagust et al. 2010).
CSF Collection and Analyses—Replication Sample
In the replication sample, Aβwas measured in CSF. CSF was collected in polypropylene tubes, centrifuged at room temperature for 10 min, the supernatant aliquoted into polypropylene tubes, and frozen at −80 °C pending analyses. Mean time from CSF sampling to freezing was below 90 min. Samples were sent on dry ice to the Clinical Neurochemistry Laboratory at Sahlgrenska University Hospital, Mölndal, Sweden, for analyses. CSF Aβ42 concentration was measured using the INNOTEST β-AMYLOID(1–42) enzyme-linked immunosorbent assay (Fujirebio). Analyses were performed by board-certified laboratory technicians masked to clinical data. Intra-assay coefficients of variation were 9–13%. In addition, Aβ42 concentration was also measured using the Meso Scale Discovery Aβ Triplex Assay (Meso Scale Discovery). This assay uses end-specific antibodies to capture Aβ peptides ending at amino acid 38, 40, and 42, respectively, and 6E10 (specific to amino acids 3–8) to detect them.
HOMER1 Expression
HOMER1 mRNA expression levels from multiple samples were extracted from the Allen Brain Atlas (www.brain-map.org) for the left hemisphere for six participants <60 years (Hawrylycz et al. 2012). Each sample was matched to each of the 34 cortical regions from the Desikan-Killiany atlas (Fischl et al. 2004). The donors in the Allen Human Brain Atlas Microarray Survey are described in detail in the Donor Profile Technical White Paper (http://help.brain-map.org/display/humanbrain/Documentation). None showed abnormal levels of amyloid plaques or neurofibrillary tangles. The procedures are described in detail elsewhere (French and Paus 2015). Briefly, normalized microarray gene expression data were downloaded, and for each donor, all cortical samples were assigned to a surface region based on their MNI152 coordinates. Summed over all donors, 1269 cortical samples were mapped to the 34 left-hemispheric regions; all regions were represented with sample data from at least three donors (28/34 regions had data from all donors), and at least six samples. For each region, median HOMER1 expression across donors was calculated.
Genotyping
Buccal swab and saliva samples were collected for DNA extraction followed by genome-wide genotyping using the “Global Screening Array” (Illumina, Inc). For a full description of genotyping and postgenotyping methods, including QC and imputation of untyped markers, please see Supplementary Material. Participants for whom DNA samples were available (n = 113) were typed for the number of APOE (Apolipoprotein E) ɛ4 alleles. In addition, we computed two different polygenic score (PGS) for AD based on (Jansen et al. 2019) and (Lambert et al. 2013).
Statistical Analyses
Pearson correlations and multiple linear regression analyses were used to test the relationships between the variables of interest. To control for statistical outliers, participants with studentized deleted residuals >2 or <−2 were excluded. These are computed by deleting the observations one at a time, and each time refitting the regression model on the remaining n – 1 observations. Then, we compared the observed response values to their fitted values based on the models with the observation in question deleted. Thus, the deviation of each observation is evaluated as the distance from the fit line when the fit line was calculated without that observation. All variables were centered in analyses, including interaction terms. To illustrate significant age interactions, a median split based on age of the main sample of participants was done, dividing the sample in a group of middle-aged and older (<68 years) versus a group of older adults (≥68 years). The main results from these analyses were tested for robustness in the extended sample of 154 participants and in an independent replication sample. Regional amyloid levels were tested vertex-wise at the cortical surface by general linear models implemented in FreeSurfer, with Aβ level at each cortical vertex as dependent variable, and age group, PSQI score, and PSQI × age group as predictors, with age as covariate to control within-group effects. The surface results were tested against an empirical null distribution of maximum cluster size across 10 000 iterations using Z Monte Carlo simulations, yielding results corrected for multiple comparisons across space. HOMER1 expression was correlated with the PSQI-Aβ effect size map (gamma values) across the 34 regions.
Results
Global Amyloid Levels—Cross-sectional Analyses
Global cortical Aβ correlated with age (r = 0.19, P < 0.05), while PSQI (r = 0.10, P = 0.29) did not, possibly because only middle-aged and older adults were included. PSQI was entered as the dependent variable in a multiple regression analysis, with Aβ, age, and sex as predictors. Aβ was not related to PSQI (P > 0.50). The Aβ × age interaction term was added, yielding a significant contribution (B = −0.62, SE = ±0.295, β = −0.22, P < 0.05). Post hoc partial correlation analyses, controlling for age, showed that this interaction was due to a positive relationship (r = 0.41, P < 0.005) between high PSQI score and Aβ in the youngest (age < 68 years, n = 52) part of the sample and no relationship (r = −0.23, P = 0.084) in the oldest (age ≥ 68 years, n = 57) (Fig. 1). To control for statistical outliers, participants with studentized deleted residuals >2 or <−2 were excluded. This strict criterion excluded six participants, with Aβ × age still being significant (B = −0.50, SE = ±0.25, β = −0.22, P < 0.05). This result was further confirmed running partial correlation analyses on the reduced sample in each age group separately, yielding a significant positive relationship (r = 0.36, P < 0.05, df = 47) in the youngest age group and no significant relationship in the older group (r = −0.20, P > 0.14, df = 50). The identified PSQI-Aβ relationship was thus not due to statistical outliers.
Figure 1.
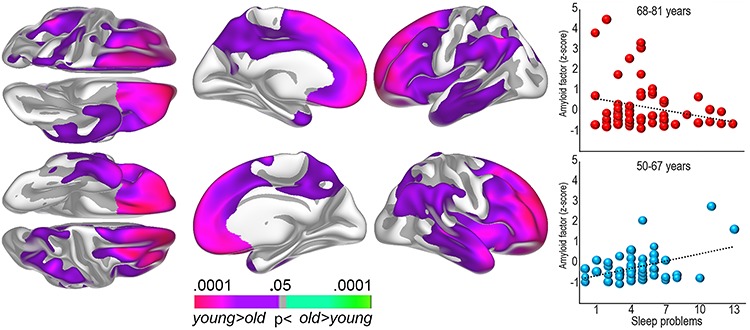
Regional Aβ levels and sleep problems. Left: The surface plots show regions where self-reported sleep problems and Aβ accumulation are significantly stronger correlated in the younger (50–67 years) compared with the older (68–81 years) age group. Right: Bubble plots of the relationship between sleep problems (PSQI global score) and global cortical Aβ levels (amyloid factor expressed in Z-scores) within each age group.
Depression (BDI) score was added as covariate. Aβ × age was still significant (B = −0.72, SE = ±0.28, β = −0.29, P < 0.05), as was BDI score (B = 0.28, SE = ±0.07, β = 0.40, P < 0.001), so that sleep problems were associated with higher BDI. Overweight and cardiovascular health can affect sleep quality (Vorona et al. 2005). The Aβ × age interaction survived including body mass index (BMI) as covariate (B = −0.61, SE = ±0.30, β = −0.22, P < 0.05), and BMI was not significant. We also added the measures of body composition from bioelectrical impedance examinations (Ling et al. 2011) (muscle mass, body fat percentage, waist circumference, waist/hip ratio, and visceral fat area), as well as blood pressure (systolic and diastolic). None explained unique variance in PSQI score, while the Aβ × age interaction was still significant (B = −0.72, SE = ±0.29, β = −0.29, P < 0.05).
PSQI-Aβ Replication Analyses: Independent Sample
As an additional validation, we tested the PSQI–Aβ relationship in the youngest and oldest part of our independent replication sample (see Fig. 2). Due to a slightly higher age than in the main sample, using the same cut-off age as in the main sample, it would yield only 16 participants in the youngest group versus 75 in the oldest. Thus, cut-off age for young–old was set to ≤70 years and old–old >70 years, yielding of 29 versus 62 participants in the youngest and the oldest groups, respectively. Aβ was measured in CSF, and we tested both the Aβ42/Aβ40 ratio using the triplex assay and the absolute Aβ42 levels using the ELISA assay. Lower numbers indicate higher brain levels of Aβ. The Aβ42/Aβ40 ratio correlated r = −0.30 (df = 28) with PSQI in the youngest age group and − 0.10 (df = 61) in the oldest group. The correlation in the youngest CSF group was not significantly different from the correlation in the youngest PET group (z-score for the difference between correlations = 0.27, P = 0.79). Due to the lower number of participants in the youngest CSF group, the correlation did not reach the α-level of 0.05 (P = 0.12, df = 28). This is a power issue, as a sample size equal to the young group in the PET sample would yield P = 0.036 for the same correlation. Thus, the positive PSQI-Aβ relationship in the youngest PET group was supported by the replication CSF sample. As seen above, the negative PSQI-Aβ relationship in the oldest PET group was not seen in the CSF sample, however. Similar to the PET sample, we also included APOE status as covariate, which only marginally affected the PSQI-amyloid relationships (“young–old” r = −0.28/“old–old” r = 0.16). We repeated the CSF analyses using Aβ ELISA instead of the Aβ42/Aβ40 triplex ratio, with similar results (r = −0.24 and 0.008 in the young and the older group, respectively). As can be seen in Figure 2, there was positive relationships between PSQI and the amount of Aβ in the youngest part of both the PET and CSF samples that were not seen in the oldest part. However, the negative relationship in the oldest PET group was not seen in the oldest CSF group.
Figure 2.
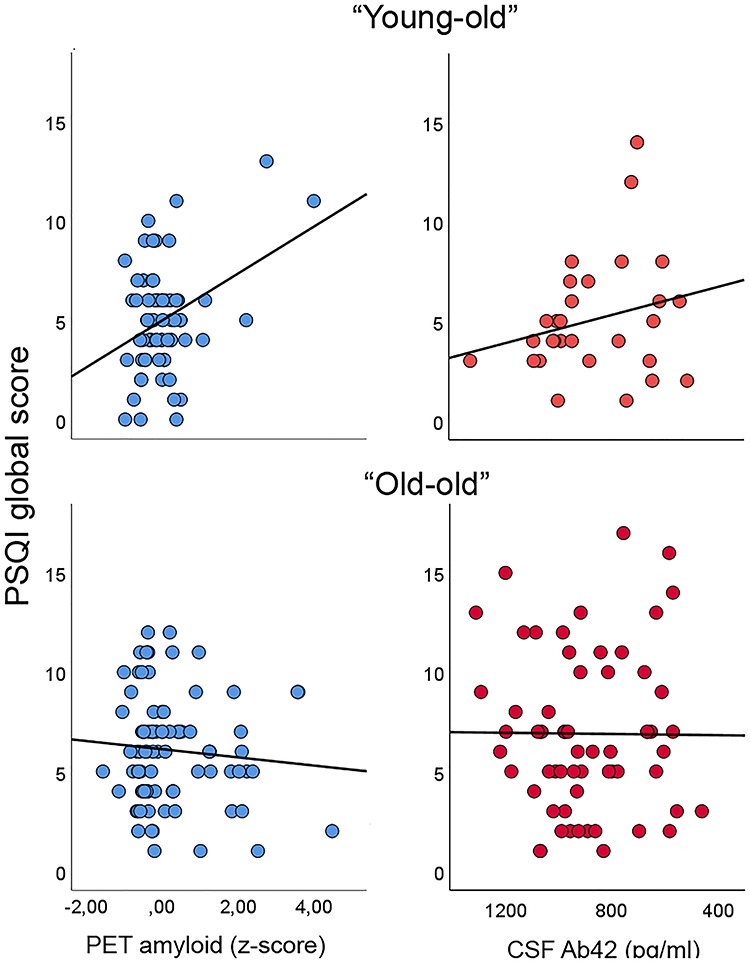
Validation sample. The different PSQI-Aβ relationship in the younger versus the older part of the sample (left column) was tested in an independent sample of cognitively normal older adults, where Aβ was measured by Aβ1–42 in CSF (right column). As can be seen, a nominal positive relationship between sleep problems and amyloid levels was seen in the young–old in both samples. In the old–old, there was a negative relationship in the PET sample and a lack of relationship on the CSF sample.
PSQI-Aβ Replication Analyses: Extended Sample
Additional participants were added to the sample from continued research projects run by Lifespan Changes in Brain and Cognition (LCBC) after the completion of the first round of data collection, increasing the number of participants from 109 to 154 (52–>72 “young–old”/57–>82 “old–old”). This sample was too small to warrant independent analyses and was thus added to the existing sample to test for the robustness of the original results. Covarying for age and sex, PSQI still correlated significantly with the amyloid factor (r = 0.41, P = 0.003) in the youngest group, but not in the oldest (r = −0.23, P = 0.083, difference between correlations z = 2.74, P = 0.0061). Similar to the analyses in the original sample, the positive correlation in the youngest group survived corrections for BMI, depression score, body composition, and blood pressure (all P’s < 0.05). We also tested whether genetic risk for AD could account for the relationship. Genetic information was available for 113 participants (n = 48 “young–old”/“old–old” n = 65). We reran the correlations, first controlling for age and the number of APOE ɛ4 alleles, and then for age and a polygenic AD score include the APOE region (see Supplementary Material), generated at P < 0.5. Covarying for genetic AD risk did not affect the correlations which in both cases were significant in the youngest group (controlling for APOE r = 0.38, P = 0.01/PGS from Jansen et al. r = 0.39, P = 0.014/PGS from Lambert et al. r = 0.44, P = 0.004) and not in the oldest group (controlling for APOE r = −0.00, P = 0.56/PGS from Jansen et al. r = −0.019, P = 0.89/PGS from Lambert et al. r = −0.02, P = 0.90).
Regional Amyloid Levels—Cross-sectional Analyses
Regional Aβ analyses revealed spatially extended age group × PSQI interactions (Fig. 1), covering the frontal, lateral temporal, inferior parietal, and medial parietal cortex. The relationships were significantly stronger in participants below 68 years (Fig. 3). To ensure effects were not due to the specific cut-off used to create age groups (median split), we ran a post hoc regression analysis using age as a continuous variable and mean Aβ levels across the vertices identified from the group statistics as dependent variable, confirming the interaction (β = −0.19, P = 0.05).
Figure 3.
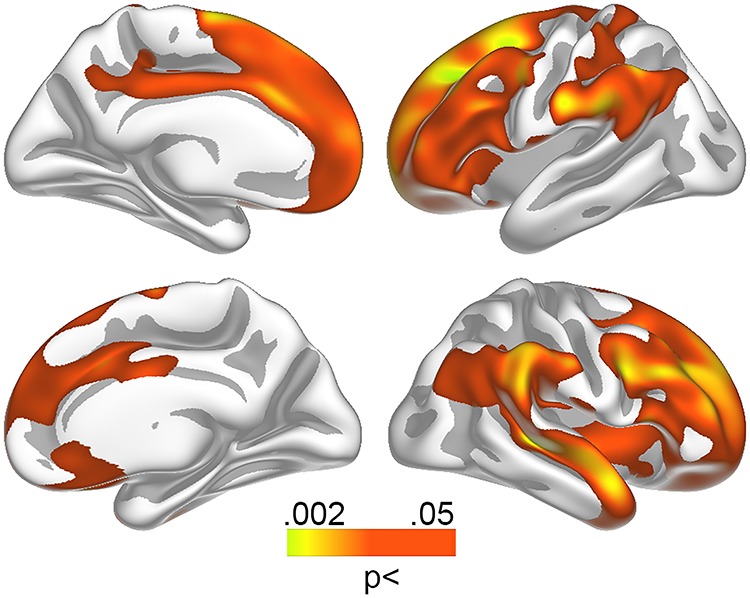
Relationships between Aβ levels and sleep problems in the youngest group. Relationship between self-reported sleep problems and Aβ accumulation in the youngest participants (50–67 years) was tested vertex-wise across the cortical surface and corrected for multiple comparisons across space. Red–yellow colors represent regions demonstrating a positive relationship between self-reported sleep problems and amyloid accumulation.
Global and Regional Amyloid Levels—Longitudinal Analyses
PSQI, memory, and depression scores were available for a subsample 3 years prior to the present investigation (n = 62). PSQI did not change significantly over this time (mean change = −4.0%, SD = 29%, t = 1.16, n.s.), and scores between the time points are correlated (r = 0.81, P < 10−14). A regression model with PSQI change as dependent, and age, global Aβ accumulation, and the age × Aβ interaction as predictors yielded the interaction term significant (B = 0.62, SE = ±0.03, β = 0.24, P = 0.05). Worsening of sleep problems over time correlated with higher Aβ levels in the youngest (r = 0.37, P < 0.05, n = 35) but not the oldest (r = −0.12, n.s, n = 27) group. The relationship in the younger group survived adding baseline PSQI score as a covariate (r = 0.40, P < 0.05).
AD-related Aβ Accumulation
Patients with MCI/AD (n = 44/25) harbored significantly more cortical Aβ than cognitively healthy participants (n = 20), especially in the superior frontal gyrus and around the central sulcus (Fig. 4). A direct comparison of the anatomical distribution of Aβ differences between controls and patients with the distribution of the sleep-related Aβ accumulation revealed close overlap (Spearman’s Rho = 0.81, P < 10−8), showing that sleep is related to Aβ in AD-sensitive regions.
Figure 4.
Aβ levels in AD and gene expression. Left: Regions with significantly higher levels of Aβ in MCI/AD patients compared with cognitively normal controls. Right: Bubble plot of the relationship between the patients versus controls differences in Aβ accumulation across 34 cortical regions (gamma values) and regional HOMER1 expression levels (top) and the strength of the sleep-Aβ relationship in the youngest group (gamma values) versus the patients-controls differences (bottom).
Gene Expression—HOMER1
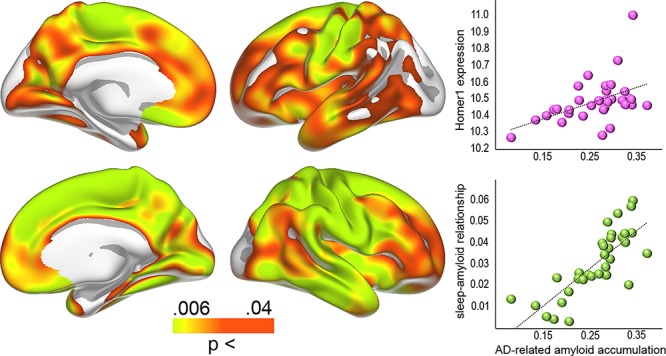
Anatomical distribution of the mRNA expression levels of HOMER1 correlated with the distribution of effects sizes in the youngest group (Fig. 3, Spearman’s Rho = 0.51, P = 0.0022, Fig. 5), demonstrating high HOMER1 expression levels in regions where Aβ-PSQI were most strongly related. As an additional test, we ran the same analysis for all 20 736 genes in the atlas. The observed correlation of .51 for HOMER1 was well above 97.5% of all positive correlations (critical value of Spearman’s Rho = 0.49), meaning that HOMER1 is among the top 5% correlated genes, similar to a two-tailed P < 0.05. Control analyses showed that all donors showed similar positive correlations when investigated individually (P-values ranging from <0.01 to <2e−10, rho between .11 and .30). Here, we first converted the Aβ-PSQI effect size surface maps to 1 mm3 MNI152 volume space. Next, for each donor separately, we extracted Aβ-PSQI effect size estimates from each cortical gene expression sample available in that donor, based on the MNI-coordinates of the sample. All Aβ-PSQI effect size estimates falling within 3 mm of the sample MNI-coordinate were considered the representative of the sample and averaged. Following this approach, the number of gene expression samples associated with a location within the MNI152 cortical ribbon ranged between 210 and 517 across the six donors (210–269 excluding the two donors being represented with samples in both hemispheres). These analyses showed that the correlation between Aβ-PSQI effect size and HOMER1 expression was present in 6/6 donors. HOMER1 expression was also positively related to Aβ accumulation in AD (Spearman’s Rho = 0.55, P < 0.001, >99th percentile compared with all genes, see Figure 5).
Figure 5.
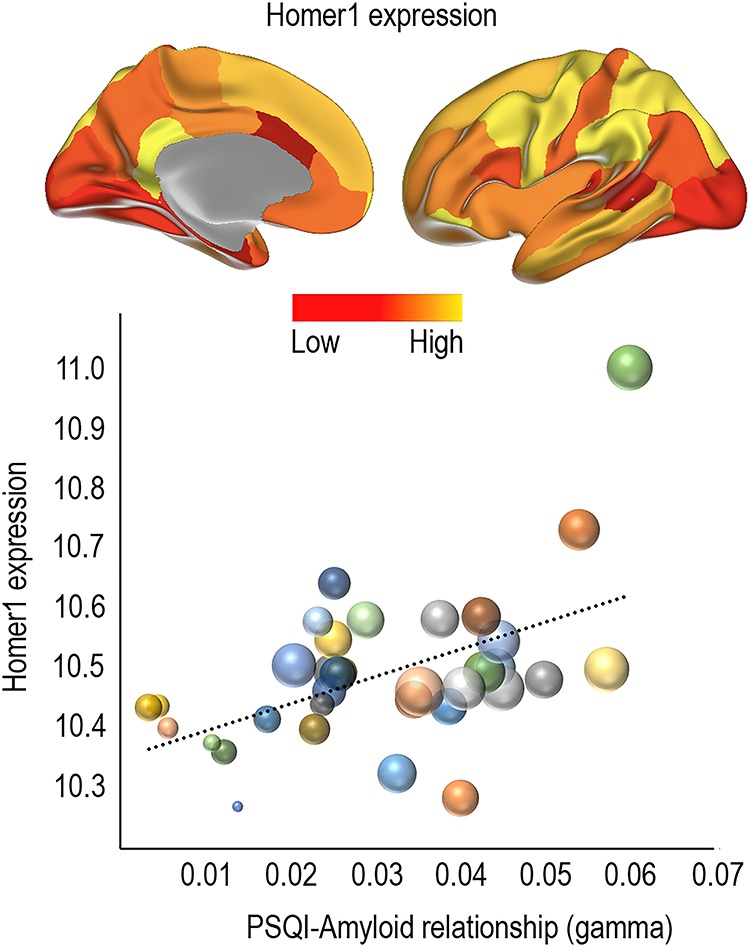
Relationship between sleep problems related Aβ accumulation and HOMER1 expression. Top: Regional expression of HOMER1 in 34 cortical regions in the left hemisphere. Bottom: Bubble plot of the relationship between regional HOMER1 expression levels and the strength of the sleep-Aβ relationship in the youngest group (gamma values). The bubbles are scaled by the group difference in Aβ accumulation between controls and MCI/AD patients. The clustering of large bubbles to the right and to the top of the plot illustrates that regions with high levels of HOMER1 expression and sleep-related Aβ accumulation also show more Aβ accumulation in AD patients.
Control Analyses—Sleep, Memory, and Depression
We tested the relationship between PSQI scores, global Aβ, memory function [Complex Figure Test (Poulton and Moffitt 1995)], and symptoms of depression (Beck 1987). We calculated memory and depression scores at baseline and follow-up, as well as annualized percent change in score across the 3 years between time points. Controlling for age, sleep problems at baseline was correlated with recall at both time points (baseline r = −0.34, P < 0.01, df = 60; follow-up r = −0.32, P < 0.05, df = 61), but no significant relationship was found between PSQI and recall score change between time points. Correcting for depression score, PSQI at baseline still correlated significantly with recall score at baseline (r = −0.30, P < 0.05, df = 58) and at follow-up (r = −0.26, P < 0.05, df = 58). None of the recall variables are correlated with global Aβ accumulation.
We also tested the relationship between sleep problems and depressive symptoms. Controlling for age, PSQI at baseline (r = 0.39, P < 0.005, df = 58) and follow-up (r = 0.32, P < 0.01) correlated with depressive symptoms at follow-up. No correlations were found for depression symptom load at baseline. Increase in depressive symptom load between the time points was associated with higher levels of sleep problems at follow-up (r = 0.32, P < 0.01, df = 67), controlling for age and interval. Neither of the depression scores correlated with global Aβ accumulation. Adding sex as an additional covariate did not cause any of the relationships to go from significant to not significant. However, when sex was included, a relationship between increase in depression symptom load and increase in sleep problems between the time points was significant (r = −0.28, P < 0.05). Adding memory function at baseline, follow-up as well as annualized percentage chance between the time points as additional covariates did not cause any of the relationships to go from significant to not significant. Thus, memory and depressive symptoms are independently related to sleep problems, but neither seems to affect the sleep–Aβ accumulation pattern.
Discussion
The present results demonstrate an age-dependent relationship between sleep problems and Aβ accumulation. These results fit with the hypothesis that sleep disturbances are related to pathogenesis early in the course of neurodegeneration (Musiek and Holtzman 2016). Disturbed sleep can lead to Aβ accumulation through disruptions of sleep-dependent Aβ clearance (Xie et al. 2013), and Aβ accumulation can cause sleep problems (Brown et al. 2016), which again may reduce the brain’s ability to clear Aβ in a positive feedback loop. Several studies have reported that sleep problems are associated with the accumulation of global Aβ in cognitively healthy older adults (Ju et al. 2013; Spira et al. 2013; Mander et al. 2015; Sprecher et al. 2015; Branger et al. 2016; Brown et al. 2016). Still, we cannot, from the present results, conclude with regard to causality, since brain aging is characterized by multiple factors other than sleep disturbance and Aβ (Fjell et al. 2014).
Sleep problems and Aβ were more strongly related earlier than later in the aging process. This is interesting, as previous studies have shown that atrophy is related to sleep problems in older (>60 years) more than in middle-aged (<60 years) adults (Sexton et al. 2014), indicating a temporal shift in the relationship with sleep for Aβ versus atrophy. Such a pattern fits some theoretical models, where increased Aβ is placed before accelerated atrophy in a cascade leading to AD (Jack et al. 2010, 2013). This model is not universally accepted (Fjell et al. 2014), however. Furthermore, even though cognitively high functioning participants can be classified with AD or Alzheimer’s pathological change according to the newly proposed NIA-AA research framework (Jack et al. 2018), the young participants in the present study have a low risk of developing dementia for the next decade. We also found that the relationship between sleep and Aβ accumulation was independent of genetic risk for AD as evidenced by APOE and two different AD PGSs. The observed relationship is interesting and may still be relevant for understanding very early pathological changes that may eventually lead to Alzheimer’s dementia, but the participants need to be followed for several years to allow firms conclusions. Also interesting, the amount of sleep problems in the youngest group was relatively low, suggesting that minor disturbances of self-reported sleep also have relevance.
The lack of relationship between self-reported sleep and Aβ in the oldest group could be due to the accumulation of comorbid conditions with higher age. For instance, in high age, primary AD pathology is less common than mixed vascular and AD pathology (Hachinski 2019), and AD pathology is very often accompanied by vascular dysfunction (Sweeney et al. 2019) and neuroinflammation (McManus and Heneka 2017; Regen et al. 2017) in older adults. With increasing comorbidities, the relationship between sleep problems and Aβ burden may be diluted, which may explain the lack of relationship in the oldest group in the present study. Although we attempted to control for certain comorbid conditions in our analyses, represented by measures of BMI, body composition, and depression, it is possible that an increased amount of comorbidities rather than Aβ is associated with sleep problems in the oldest group.
The age differences in the Aβ-sleep relationships were partly replicated in an independent sample. Although Aβ was measured in CSF, which yield different and possible less accurate measure of Aβ, the relationship with sleep problems was similar to the PET sample in the young group. However, there was no indication of an inverse relationship in the oldest group, as observed in the PET sample. Although this potentially can be due to the different methods used to measure Aβ-PET versus CSF—this finding needs further replication. Thus, the analyses in the replication sample yielded evidence supporting the observed Aβ-sleep relationship early in the aging process, but not for the negative relationship in the older age group. In the following, we will, therefore, focus the discussion on the findings in the youngest group.
Sleep problem-related Aβ accumulation in the youngest group showed high correspondence with the regional Aβ accumulation in MCI and AD patients. This is in accordance with a view that sleep problems may be relevant in very early phases of AD (Musiek and Holtzman 2016; Irwin and Vitiello 2019), before clinical symptoms are detectable. A methodological challenge is that this relationship in part can be caused by the spatial distribution of Aβ in the cortex, since correlations can only be detected if there is variance in the amount of Aβ accumulation. Thus, sleep will only correlate with Aβ burden in the regions where Aβ tends to accumulate. Acknowledging this caveat, we still believe that the spatial distribution of Aβ convey relevant information. This is supported by studies showing that the distribution of Aβ in the cortex is not invariant across different conditions, such as between APOE ɛ3 and ɛ4 carriers (Toledo et al. 2019), and between patients with posttraumatic stress disorder and patients with traumatic brain injuries [(Mohamed et al. 2018), but see (Weiner et al. 2017)], both at risk for the development of AD. In any case, follow-up studies over longer time intervals are required to test whether the findings relate to later development of clinical AD symptoms. As expected, sleep problems were also related to lower memory function and more depressive symptoms. It must be noted that one of the 21 items in BDI asks directly about sleep and another about being tired, both overlapping with questions of the PSQI. Still, the sleep–depression and the sleep–memory relationships were independent of each other, showing that sleep problems are related to both cognitive function and psychiatric symptoms in aging (Mander et al. 2017).
The Aβ-sleep results were confirmed by 3 years longitudinal information on sleep problems. As amount of sleep problems was highly correlated between the time points, it is interesting that participants with worsening of sleep problems had higher levels of cortical Aβ deposition, even when baseline levels of sleep problems were taken into account. This is in accordance with a hypothetic relationship between change in sleep problems and change in Aβ deposition. Increase in Aβ over time can be seen in cognitively normal older adults (Resnick et al. 2015), and two recent studies reported baseline measures related to sleep quality to correlate with longitudinal increase in Aβ (Carvalho et al. 2018; Sharma et al. 2018). Thus, increases in sleep problems are related to higher cross-sectional levels of Aβ, and increases in Aβ levels are related to cross-sectional measures of sleep problems. Tracking Aβ deposition and sleep problems longitudinally over multiple time points will allow disentangling the age-trajectories more accurately and determine the direction of causality.
Gene Expression
Sleep is a fundamental aspect of brain function, and expressions of selective genes are highly sensitive to time spent awake and time spent sleeping. The high but regionally varying expression of HOMER1 in the cortex (Szumlinski et al. 2006), and its suggested role in AD and Aβ pathophysiology (Dickey et al. 2003; Yamamoto et al. 2011; Luo et al. 2012), makes it a promising candidate for bridging the in vivo sleep–Aβ accumulation results, rodent studies, and human brain in vitro databases. Aβ production is tightly connected to neural activity, and models are developed to explain the regional distribution of Aβ accumulation in humans as a result of regional activity variations (Jagust and Mormino 2011). Thus, in Aβ-negative healthy controls, we expected high expression of HOMER1 in regions where high levels of AD- and sleep-related Aβ are found. This was supported by the substantial overlap between HOMER1 gene expression (Hawrylycz et al. 2012) and sleep- and AD-related Aβ accumulation.
HOMER1 expression responds to sleep loss (Maret et al. 2007; Wang et al. 2010), and is upregulated after both shorter (Mackiewicz et al. 2007) and longer (Conti et al. 2007) periods of sleep deprivation. The consistent activation of Homer1a suggests a role for sleep in intracellular calcium homeostasis for protecting and recovering from the neuronal activation imposed by wakefulness, and Homer1 appears to be a good marker for neuronal populations activated by sleep loss (Maret et al. 2007). Upregulation of Homer1 by sleep deprivation is likely a result of such sustained neural activity, as Homer1a is transiently upregulated during increases in network activity (Hu et al. 2010). Evidence for a role for Homer1 in Aβ processing comes from animal studies. APP + PS1 transgenic mice show reduced expression of Homer1, but normal levels in regions that do not accumulate Aβ (Dickey et al. 2003). It has been suggested that the inhibition of Homer1a activity is responsible for the observed neuronal degeneration in AD by the elimination of the facilitation of BK channels (Yamamoto et al. 2011). Conversely, the induction of Homer1a can reactivate Aβ-suppressed BK channels (Luo et al. 2012).
As Homer1 expression cannot be measured from living participants, the reported analyses only yield suggestive evidence for a potential implication of Homer1 in the sleep-Aβ process. However, as the study was based on experimental animal work reviewed above, we believe this approach still allows certain speculations about the molecular mechanisms involved.
Limitations
Sleep problems were measured by self-report not by polysomnography. This prevented testing of objective measures of sleep quality, such as sleep fragmentation and amount of slow wave sleep. Self-report measures may be invalid in older adults with memory impairment, due to the inaccurate recall of sleep problems. In the present sample, none had cognitive problems, suggesting they were not able to yield accurate reports of sleep quality. A further challenge is that few young people showed high levels of amyloid accumulation. Although not defined as statistical outliers according to the studentized deleted residual approach, these will still necessarily be important for the observed relationship as they represents the highest observed amyloid values. Thus, although the PSWI-Aβ relationship was observed in a relatively large sample of young participants (n = 72), and the general pattern replicated in an independent sample, it should also be replicated in a larger data set with more young participants with high levels of Aβ. Furthermore, we were not able to differentiate between different protein isoforms encoded by HOMER1. The short-form Homer1a is assumed to be more relevant for sleep loss than the longer forms (Homer1b and c) (Maret et al. 2007; Diering et al. 2017). Also, although transcriptome studies may be useful in yielding a first insight into changes associated with sleep deprivation, we cannot infer from this that the specific genes are causally related to sleep, and distinguish the observed effects from changes due to secondary effects of sleep loss. Adding to this, we cannot per se assume a static expression pattern for an immediate early gene such as Homer1. Still, we went to great length to make sure that the expression pattern showed stability across donors, and were also able to demonstrate that all donors showed similar positive correlations between the amyloid-sleep pattern and gene expression when investigated individually. The data used in the study are from different sources—a neurocognitive study at LCBC in Oslo, comparisons of healthy older adults versus MCI/AD patients from ADNI and gene expression results from the Allen Brain Atlas. We believe that there is no reason to assume that between-study differences have caused artificial anatomical similarities between the statistical results reported here, and that the currently used approach hence is valid. Finally, although the spatial relationship between HOMER1 gene expression and the Aβ-sleep relationship was statistically robust, other candidates showed even stronger relationships. However, as HOMER1 was our only a priori candidate, we did not explore the other relationships with low nominal P-values.
Conclusions
Correlations between Aβ accumulation and self-reported sleep problems have repeatedly been found. Here, we show that the sleep-Aβ relationship is anatomically heterogeneous, mainly restricted to regions that harbor Aβ in AD and stronger in regions with high HOMER1 expression. This was according to our hypothesis based on experimental animal models, and although the conclusions that can be drawn based on human data are speculative at this point, we believe these results suggest a pathway through which two major AD risk factors may be causally related.
Supplementary Material
Supplementary material is available at Cerebral Cortex online.
Funding
The National Association for Public Health’s dementia research program, the Department of Psychology at the University of Oslo, the Norwegian Research Council, the Medical Student Research Program at the University of Oslo, and the project has received funding from the European Research Council’s Starting Grant and Consolidator Grant scheme under grant agreements 283634, 725025, and 313440. Additional funding for parts of the study was received from Innlandet Hospital Trust (grant number: 150201), the Knut and Alice Wallenberg Foundation, the European Research Council (#681712), the Swedish Research Council (grant numbers: #2018-02532, 2017-0095 and K2013-61X-14002-13-5), the TorstenSöderberg Foundation (#2017-00915), the Swedish Alzheimer Foundation (#AF-742881), Hjärnfonden, Sweden (#FO2017-0243), and the Swedish state under the agreement between the Swedish government and the County Councils, the ALF-agreement (grant #ALFGBG-715986# and #ALFGBG-720931). The MCI/AD PET data collection and sharing was funded by the ADNI (National Institutes of Health Grant U01 AG024904) and DOD ADNI (Department of Defense award number W81XWH-12-2-0012), see http://adni.loni.usc.edu/about/. A complete listing of ADNI investigators can be found at http://adni.loni.usc.edu/wp-content/uploads/how_to_apply/ADNI_Acknowledgement_List.pdf.
Notes
The authors would also like to thank the study participants, and acknowledge the contributions of the Department of Gynecology, the Department of Urology, the Department of Orthopedic Surgery, the Department of Geriatric Medicine and the Department of Anesthesiology at Oslo University Hospital, and the Department of Orthopedic Surgery and the Department of Anesthesiology at Diakonhjemmet Hospital in Oslo, Norway. We thank MrsTanjaWesse and SanazSedghpourSabet as well as Drs Michael Wittig and Andre Franke at the Institute of Clinical Molecular Biology, Christian-Albrechts-University of Kiel, Kiel, Germany for technical assistance with the GSA genotyping. The LIGA team acknowledges computational support from the OMICS compute cluster at the University of Lübeck. Conflicts of Interest: None declared.
Disclosure statement
Zetterberg has served at scientific advisory boards for Roche Diagnostics, CogRx, Samumed and Wave and is a co-founder of Brain Biomarker Solutions in Gothenburg AB, a GU Ventures-based platform company at the University of Gothenburg. Blennow has served as a consultant or at advisory boards for Alzheon, CogRx, Biogen, Lilly, Novartis and Roche Diagnostics, and is a co-founder of Brain Biomarker Solutions in Gothenburg AB, a GU Ventures-based platform company at the University of Gothenburg.
Supplementary Material
References
- Archer SN, Oster H. 2015. How sleep and wakefulness influence circadian rhythmicity: effects of insufficient and mistimed sleep on the animal and human transcriptome. J Sleep Res. 24:476–493. [DOI] [PubMed] [Google Scholar]
- Beck A. 1987. Beck depression inventory scoring manual. New York: The Psychological Corporation. [Google Scholar]
- Beck AT, Steer RA. 1984. Internal consistencies of the original and revised Beck depression inventory. J Clin Psychol. 40:1365–1367. [DOI] [PubMed] [Google Scholar]
- Brakeman PR, Lanahan AA, O'Brien R, Roche K, Barnes CA, Huganir RL, Worley PF. 1997. Homer: a protein that selectively binds metabotropic glutamate receptors. Nature. 386:284–288. [DOI] [PubMed] [Google Scholar]
- Branger P, Arenaza-Urquijo EM, Tomadesso C, Mezenge F, Andre C, Flores R, Mutlu J, Sayette V, Eustache F, Chetelat G et al. 2016. Relationships between sleep quality and brain volume, metabolism, and amyloid deposition in late adulthood. Neurobiol Aging. 41:107–114. [DOI] [PubMed] [Google Scholar]
- Brown BM, Rainey-Smith SR, Villemagne VL, Weinborn M, Bucks RS, Sohrabi HR, Laws SM, Taddei K, Macaulay SL, Ames D et al. 2016. The relationship between sleep quality and brain amyloid burden. Sleep. 39:1063–1068. [DOI] [PMC free article] [PubMed] [Google Scholar]
- Buysse DJ, Reynolds CF 3rd, Monk TH, Berman SR, Kupfer DJ. 1989. The Pittsburgh sleep quality index: a new instrument for psychiatric practice and research. Psychiatry Res. 28:193–213. [DOI] [PubMed] [Google Scholar]
- Carvalho DZ, St Louis EK, Knopman DS, Boeve BF, Lowe VJ, Roberts RO, Mielke MM, Przybelski SA, Machulda MM et al. 2018. Association of Excessive Daytime Sleepiness with longitudinal beta-amyloid accumulation in elderly persons without dementia. JAMA Neurol. 75:672–680. [DOI] [PMC free article] [PubMed] [Google Scholar]
- Cirelli C, Faraguna U, Tononi G. 2006. Changes in brain gene expression after long-term sleep deprivation. J Neurochem. 98:1632–1645. [DOI] [PubMed] [Google Scholar]
- Conti B, Maier R, Barr AM, Morale MC, Lu X, Sanna PP, Bilbe G, Hoyer D, Bartfai T. 2007. Region-specific transcriptional changes following the three antidepressant treatments electro convulsive therapy, sleep deprivation and fluoxetine. Mol Psychiatry. 12:167–189. [DOI] [PubMed] [Google Scholar]
- Lange AG, Brathen AC, Grydeland H, Sexton C, Johansen-Berg H, Andersson JL, Rohani DA, Nyberg L, Fjell AM, Walhovd KB. 2016. White matter integrity as a marker for cognitive plasticity in aging. Neurobiol Aging. 47:74–82. [DOI] [PMC free article] [PubMed] [Google Scholar]
- Dickey CA, Loring JF, Montgomery J, Gordon MN, Eastman PS, Morgan D. 2003. Selectively reduced expression of synaptic plasticity-related genes in amyloid precursor protein + presenilin-1 transgenic mice. J Neurosci. 23:5219–5226. [DOI] [PMC free article] [PubMed] [Google Scholar]
- Diering GH, Nirujogi RS, Roth RH, Worley PF, Pandey A, Huganir RL. 2017. Homer1a drives homeostatic scaling-down of excitatory synapses during sleep. Science. 355:511–515. [DOI] [PMC free article] [PubMed] [Google Scholar]
- Fischl B, Dale AM. 2000. Measuring the thickness of the human cerebral cortex from magnetic resonance images. Proc Natl Acad Sci USA. 97:11050–11055. [DOI] [PMC free article] [PubMed] [Google Scholar]
- Fischl B, Sereno MI, Dale AM. 1999. Cortical surface-based analysis. II: inflation, flattening, and a surface-based coordinate system. NeuroImage. 9:195–207. [DOI] [PubMed] [Google Scholar]
- Fischl B, Kouwe A, Destrieux C, Halgren E, Segonne F, Salat DH, Busa E, Seidman LJ, Goldstein J et al. 2004. Automatically parcellating the human cerebral cortex. Cereb Cortex. 14:11–22. [DOI] [PubMed] [Google Scholar]
- Fjell AM, Idland AV, Sala-Llonch R, Watne LO, Borza T, Braekhus A, Lona T, Zetterberg H, Blennow K et al. 2018. Neuroinflammation and tau interact with amyloid in predicting sleep problems in aging independently of atrophy. Cereb Cortex. 28:2775–2785. [DOI] [PubMed] [Google Scholar]
- Fjell AM, McEvoy L, Holland D, Dale AM, Walhovd KB, Alzheimer's Disease Neuroimaging I . 2014. What is normal in normal aging? Effects of aging, amyloid and Alzheimer's disease on the cerebral cortex and the hippocampus. Prog Neurobiol. 117:20–40. [DOI] [PMC free article] [PubMed] [Google Scholar]
- Folstein MF, Folstein SE, McHugh PR. 1975. ``Mini-mental state''. A practical method for grading the cognitive state of patients for the clinician. J Psychiatr Res. 12:189–198. [DOI] [PubMed] [Google Scholar]
- French L, Paus T. 2015. A FreeSurfer view of the cortical transcriptome generated from the Allen Human Brain Atlas. Front Neurosci. 9:323. [DOI] [PMC free article] [PubMed] [Google Scholar]
- Greve DN, Svarer C, Fisher PM, Feng L, Hansen AE, Baare W, Rosen B, Fischl B, Knudsen GM. 2014. Cortical surface-based analysis reduces bias and variance in kinetic modeling of brain PET data. NeuroImage. 92:225–236. [DOI] [PMC free article] [PubMed] [Google Scholar]
- Hachinski V. 2019. Dementia: paradigm shifting into high gear. Alzheimers Dement. 15(7): 985–994. [DOI] [PubMed] [Google Scholar]
- Hatfield CF, Herbert J, van Someren EJ, Hodges JR, Hastings MH. 2004. Disrupted daily activity/rest cycles in relation to daily cortisol rhythms of home-dwelling patients with early Alzheimer's dementia. Brain. 127:1061–1074. [DOI] [PubMed] [Google Scholar]
- Hawrylycz MJ, Lein ES, Guillozet-Bongaarts AL, Shen EH, Ng L, Miller JA, Lagemaat LN, Smith KA, Ebbert A, Riley ZL et al. 2012. An anatomically comprehensive atlas of the adult human brain transcriptome. Nature. 489:391–399. [DOI] [PMC free article] [PubMed] [Google Scholar]
- Hu JH, Park JM, Park S, Xiao B, Dehoff MH, Kim S, Hayashi T, Schwarz MK, Huganir RL, Seeburg PH et al. 2010. Homeostatic scaling requires group I mGluR activation mediated by Homer1a. Neuron. 68:1128–1142. [DOI] [PMC free article] [PubMed] [Google Scholar]
- Idland AV, Sala-Llonch R, Borza T, Watne LO, Wyller TB, Braekhus A, Zetterberg H, Blennow K, Walhovd KB, Fjell AM. 2016. CSF neurofilament light levels predict hippocampal atrophy in cognitively healthy older adults. Neurobiol Aging. 49:138–144. [DOI] [PubMed] [Google Scholar]
- Irwin MR, Vitiello MV. 2019. Implications of sleep disturbance and inflammation for Alzheimer's disease dementia. Lancet Neurol.. 18(3): 296–306. [DOI] [PubMed] [Google Scholar]
- Jack CR, Bernstein MA, Fox NC, Thompson P, Alexander G, Harvey D, Borowski B, Britson PJ, Whitwell JL, Ward C et al. 2008. The Alzheimer's Disease Neuroimaging initiative (ADNI): MRI methods. JMRI. 27:685–691. [DOI] [PMC free article] [PubMed] [Google Scholar]
- Jack CR Jr, Bennett DA, Blennow K, Carrillo MC, Dunn B, Haeberlein SB, Holtzman DM, Jagust W, Jessen F, Karlawish J et al. 2018. NIA-AA research framework: toward a biological definition of Alzheimer's disease. Alzheimers Dement. 14:535–562. [DOI] [PMC free article] [PubMed] [Google Scholar]
- Jack CR Jr, Knopman DS, Jagust WJ, Petersen RC, Weiner MW, Aisen PS, Shaw LM, Vemuri P, Wiste HJ, Weigand SD et al. 2013. Tracking pathophysiological processes in Alzheimer's disease: an updated hypothetical model of dynamic biomarkers. Lancet Neurol. 12:207–216. [DOI] [PMC free article] [PubMed] [Google Scholar]
- Jack CR Jr, Knopman DS, Jagust WJ, Shaw LM, Aisen PS, Weiner MW, Petersen RC, Trojanowski JQ. 2010. Hypothetical model of dynamic biomarkers of the Alzheimer's pathological cascade. Lancet Neurol. 9:119–128. [DOI] [PMC free article] [PubMed] [Google Scholar]
- Jagust WJ, Bandy D, Chen K, Foster NL, Landau SM, Mathis CA, Price JC, Reiman EM, Skovronsky D, Koeppe RA et al. 2010. The ADNI PET core. Alzheimers Dement. 6:221–229. [DOI] [PMC free article] [PubMed] [Google Scholar]
- Jagust WJ, Mormino EC. 2011. Lifespan brain activity, beta-amyloid, and Alzheimer's disease. Trends Cogn Sci. 15:520–526. [DOI] [PMC free article] [PubMed] [Google Scholar]
- Jansen IE, Savage JE, Watanabe K, Bryois J, Williams DM, Steinberg S, Sealock J, Karlsson IK, Hagg S, Athanasiu L et al. 2019. Genome-wide meta-analysis identifies new loci and functional pathways influencing Alzheimer's disease risk. Nat Genet. 51:404–413. [DOI] [PMC free article] [PubMed] [Google Scholar]
- Ju YE, McLeland JS, Toedebusch CD, Xiong C, Fagan AM, Duntley SP, Morris JC, Holtzman DM. 2013. Sleep quality and preclinical Alzheimer disease. JAMA Neurol. 70:587–593. [DOI] [PMC free article] [PubMed] [Google Scholar]
- Kendrick DC, Gibson AJ, Moyes IC. 1979. The revised Kendrick battery: clinical studies. Br J Soc Clin Psychol. 18:329–340. [DOI] [PubMed] [Google Scholar]
- Lambert JC, Ibrahim-Verbaas CA, Harold D, Naj AC, Sims R, Bellenguez C, AL DS, Bis JC, Beecham GW, Grenier-Boley B et al. 2013. Meta-analysis of 74,046 individuals identifies 11 new susceptibility loci for Alzheimer's disease. Nat Genet. 45:1452–1458. [DOI] [PMC free article] [PubMed] [Google Scholar]
- Ling CH, Craen AJ, Slagboom PE, Gunn DA, Stokkel MP, Westendorp RG, Maier AB. 2011. Accuracy of direct segmental multi-frequency bioimpedance analysis in the assessment of total body and segmental body composition in middle-aged adult population. Clin Nutr. 30:610–615. [DOI] [PubMed] [Google Scholar]
- Luo P, Li X, Fei Z, Poon W. 2012. Scaffold protein Homer1: implications for neurological diseases. Neurochem Int. 61:731–738. [DOI] [PubMed] [Google Scholar]
- Mackiewicz M, Shockley KR, Romer MA, Galante RJ, Zimmerman JE, Naidoo N, Baldwin DA, Jensen ST, Churchill GA, Pack AI. 2007. Macromolecule biosynthesis: a key function of sleep. Physiol Genomics. 31:441–457. [DOI] [PubMed] [Google Scholar]
- Mander BA, Marks SM, Vogel JW, Rao V, Lu B, Saletin JM, Ancoli-Israel S, Jagust WJ, Walker MP. 2015. Beta-amyloid disrupts human NREM slow waves and related hippocampus-dependent memory consolidation. Nat Neurosci. 18:1051–1057. [DOI] [PMC free article] [PubMed] [Google Scholar]
- Mander BA, Winer JR, Walker MP. 2017. Sleep and human aging. Neuron. 94:19–36. [DOI] [PMC free article] [PubMed] [Google Scholar]
- Maret S, Dorsaz S, Gurcel L, Pradervand S, Petit B, Pfister C, Hagenbuchle O, O'Hara BF, Franken P, Tafti M. 2007. Homer1a is a core brain molecular correlate of sleep loss. Proc Natl Acad Sci USA. 104:20090–20095. [DOI] [PMC free article] [PubMed] [Google Scholar]
- McManus RM, Heneka MT. 2017. Role of neuroinflammation in neurodegeneration: new insights. Alzheimers Res Ther. 9:14. [DOI] [PMC free article] [PubMed] [Google Scholar]
- Mohamed AZ, Cumming P, Srour H, Gunasena T, Uchida A, Haller CN, Nasrallah F, Department of Defense Alzheimer's Disease Neuroimaging I . 2018. Amyloid pathology fingerprint differentiates post-traumatic stress disorder and traumatic brain injury. Neuroimage Clin. 19:716–726. [DOI] [PMC free article] [PubMed] [Google Scholar]
- Morris JC, Heyman A, Mohs RC, Hughes JP, van Belle G, Fillenbaum G, Mellits ED, Clark C. 1989. The consortium to establish aregistry for Alzheimer's Disease (CERAD). Part I. clinical and neuropsychological assessment of Alzheimer's disease. Neurology. 39:1159–1165. [DOI] [PubMed] [Google Scholar]
- Musiek ES, Holtzman DM. 2016. Mechanisms linking circadian clocks, sleep, and neurodegeneration. Science. 354:1004–1008. [DOI] [PMC free article] [PubMed] [Google Scholar]
- Ooms S, Overeem S, Besse K, Rikkert MO, Verbeek M, Claassen JA. 2014. Effect of 1 night of total sleep deprivation on cerebrospinal fluid beta-amyloid 42 in healthy middle-aged men: a randomized clinical trial. JAMA Neurol. 71:971–977. [DOI] [PubMed] [Google Scholar]
- Pillai V, Roth T, Drake CL. 2015. The nature of stable insomnia phenotypes. Sleep. 38:127–138. [DOI] [PMC free article] [PubMed] [Google Scholar]
- Poulton RG, Moffitt TE. 1995. The Rey–Osterreith Complex Figure Text: norms for young adolescents and an examination of validity. Arch Clin Neuropsychol. 10:47–56. [PubMed] [Google Scholar]
- Prinz PN, Vitaliano PP, Vitiello MV, Bokan J, Raskind M, Peskind E, Gerber C. 1982. Sleep, EEG and mental function changes in senile dementia of the Alzheimer's type. Neurobiol Aging. 3:361–370. [DOI] [PubMed] [Google Scholar]
- Regen F, Hellmann-Regen J, Costantini E, Reale M. 2017. Neuroinflammation and Alzheimer's disease: implications for microglial activation. Curr Alzheimer Res. 14:1140–1148. [DOI] [PubMed] [Google Scholar]
- Reitan RM. 1955. The relation of the trail making test to organic brain damage. J Consult Psychol. 19:393–394. [DOI] [PubMed] [Google Scholar]
- Resnick SM, Bilgel M, Moghekar A, An Y, Cai Q, Wang MC, Thambisetty M, Prince JL, Zhou Y, Soldan A et al. 2015. Changes in Abeta biomarkers and associations with APOE genotype in 2 longitudinal cohorts. Neurobiol Aging. 36:2333–2339. [DOI] [PMC free article] [PubMed] [Google Scholar]
- Scullin MK, Bliwise DL. 2015. Sleep, cognition, and normal aging: integrating a half century of multidisciplinary research. Perspect Psychol Sci. 10:97–137. [DOI] [PMC free article] [PubMed] [Google Scholar]
- Sexton CE, Storsve AB, Walhovd KB, Johansen-Berg H, Fjell AM. 2014. Poor sleep quality is associated with increased cortical atrophy in community-dwelling adults. Neurology. 83:967–973. [DOI] [PMC free article] [PubMed] [Google Scholar]
- Sharma RA, Varga AW, Bubu OM, Pirraglia E, Kam K, Parekh A, Wohlleber M, Miller MD, Andrade A, Lewis C et al. 2018. Obstructive sleep Apnea severity affects amyloid burden in cognitively normal elderly. A longitudinal study. Am J Respir Crit Care Med. 197:933–943. [DOI] [PMC free article] [PubMed] [Google Scholar]
- Shi L, Chen SJ, Ma MY, Bao YP, Han Y, Wang YM, Shi J, Vitiello MV, Lu L. 2018. Sleep disturbances increase the risk of dementia: a systematic review and meta-analysis. Sleep Med Rev. 40:4–16. [DOI] [PubMed] [Google Scholar]
- Shulman KI. 2000. Clock-drawing: is it the ideal cognitive screening test? Int J Geriatr Psychiatry. 15:548–561. [DOI] [PubMed] [Google Scholar]
- Sperling RA, Aisen PS, Beckett LA, Bennett DA, Craft S, Fagan AM, Iwatsubo T, Jack CR Jr, Kaye J, Montine TJ et al. 2011. Toward defining the preclinical stages of Alzheimer's disease: recommendations from the National Institute on Aging-Alzheimer's Association workgroups on diagnostic guidelines for Alzheimer's disease. Alzheimers Dement. 7:280–292. [DOI] [PMC free article] [PubMed] [Google Scholar]
- Spira AP, Gamaldo AA, An Y, Wu MN, Simonsick EM, Bilgel M, Zhou Y, Wong DF, Ferrucci L, Resnick SM. 2013. Self-reported sleep and beta-amyloid deposition in community-dwelling older adults. JAMA Neurol. 70:1537–1543. [DOI] [PMC free article] [PubMed] [Google Scholar]
- Sprecher KE, Bendlin BB, Racine AM, Okonkwo OC, Christian BT, Koscik RL, Sager MA, Asthana S, Johnson SC, Benca RM. 2015. Amyloid burden is associated with self-reported sleep in nondemented late middle-aged adults. Neurobiol Aging. 36:2568–2576. [DOI] [PMC free article] [PubMed] [Google Scholar]
- Spreen O, Strauss E. 1991. A compendium of neuropsychological tests: administration, norms, and commentary. New York: Oxford University Press. [Google Scholar]
- Storsve AB, Fjell AM, Tamnes CK, Westlye LT, Overbye K, Aasland HW, Walhovd KB. 2014. Differential longitudinal changes in cortical thickness, surface area and volume across the adult life span: regions of accelerating and decelerating change. J Neurosci. 34:8488–8498. [DOI] [PMC free article] [PubMed] [Google Scholar]
- Sweeney MD, Montagne A, Sagare AP, Nation DA, Schneider LS, Chui HC, Harrington MG, Pa J, Law M, Wang DJJ et al. 2019. Vascular dysfunction—the disregarded partner of Alzheimer's disease. Alzheimers Dement. 15:158–167. [DOI] [PMC free article] [PubMed] [Google Scholar]
- Szumlinski KK, Kalivas PW, Worley PF. 2006. Homer proteins: implications for neuropsychiatric disorders. Curr Opin Neurobiol. 16:251–257. [DOI] [PubMed] [Google Scholar]
- Thompson CL, Wisor JP, Lee CK, Pathak SD, Gerashchenko D, Smith KA, Fischer SR, Kuan CL, Sunkin SM, Ng LL et al. 2010. Molecular and anatomical signatures of sleep deprivation in the mouse brain. Front Neurosci. 4:165. [DOI] [PMC free article] [PubMed] [Google Scholar]
- Toledo JB, Habes M, Sotiras A, Bjerke M, Fan Y, Weiner MW, Shaw LM, Davatzikos C, Trojanowski JQ, Alzheimer's Disease Neuroimaging I . 2019. APOE effect on amyloid-beta PET spatial distribution, deposition rate, and cut-points. J Alzheimers Dis. 69:783–793. [DOI] [PMC free article] [PubMed] [Google Scholar]
- Videnovic A, Lazar AS, Barker RA, Overeem S. 2014. 'The clocks that time us'—circadian rhythms in neurodegenerative disorders. Nat Rev Neurol. 10:683–693. [DOI] [PMC free article] [PubMed] [Google Scholar]
- Vorona RD, Winn MP, Babineau TW, Eng BP, Feldman HR, Ware JC. 2005. Overweight and obese patients in a primary care population report less sleep than patients with a normal body mass index. Arch Intern Med. 165:25–30. [DOI] [PubMed] [Google Scholar]
- Walhovd KB, Storsve AB, Westlye LT, Drevon CA, Fjell AM. 2014. Blood markers of fatty acids and vitamin D, cardiovascular measures, body mass index, and physical activity relate to longitudinal cortical thinning in normal aging. Neurobiol Aging. 35:1055–1064. [DOI] [PubMed] [Google Scholar]
- Wang H, Liu Y, Briesemann M, Yan J. 2010. Computational analysis of gene regulation in animal sleep deprivation. Physiol Genomics. 42:427–436. [DOI] [PubMed] [Google Scholar]
- Wechsler D. 1999. Wechsler abbreviated scale of intelligence. San Antonio, TX: The Psychological Corporation. [Google Scholar]
- Weiner MW, Harvey D, Hayes J, Landau SM, Aisen PS, Petersen RC, Tosun D, Veitch DP, Jack CR Jr, Decarli C et al. 2017. Effects of traumatic brain injury and posttraumatic stress disorder on development of Alzheimer's disease in Vietnam veterans using the Alzheimer's Disease Neuroimaging initiative: preliminary report. Alzheimers Dement (N Y). 3:177–188. [DOI] [PMC free article] [PubMed] [Google Scholar]
- Westlye LT, Grydeland H, Walhovd KB, Fjell AM. 2010a. Associations between regional cortical thickness and Attentionalnetworks as measured by the attention network test. Cerebral cortex. 21:345–356. [DOI] [PubMed] [Google Scholar]
- Westlye LT, Walhovd KB, Dale AM, Bjornerud A, Due-Tonnessen P, Engvig A, Grydeland H, Tamnes CK, Ostby Y, Fjell AM. 2010b. Differentiating maturational and aging-related changes of the cerebral cortex by use of thickness and signal intensity. NeuroImage. 52:172–185. [DOI] [PubMed] [Google Scholar]
- Xie L, Kang H, Xu Q, Chen MJ, Liao Y, Thiyagarajan M, O'Donnell J, Christensen DJ, Nicholson C, Iliff JJ et al. 2013. Sleep drives metabolite clearance from the adult brain. Science. 342:373–377. [DOI] [PMC free article] [PubMed] [Google Scholar]
- Yamamoto K, Ueta Y, Wang L, Yamamoto R, Inoue N, Inokuchi K, Aiba A, Yonekura H, Kato N. 2011. Suppression of a neocortical potassium channel activity by intracellular amyloid-beta and its rescue with Homer1a. J Neurosci. 31:11100–11109. [DOI] [PMC free article] [PubMed] [Google Scholar]
Associated Data
This section collects any data citations, data availability statements, or supplementary materials included in this article.