

Abstract
Primary visual cortex (V1) is the locus of numerous forms of experience-dependent plasticity. Restricting visual stimulation to one eye at a time has revealed that many such forms of plasticity are eye-specific, indicating that synaptic modification occurs prior to binocular integration of thalamocortical inputs. A common feature of these forms of plasticity is the requirement for NMDA receptor (NMDAR) activation in V1. We therefore hypothesized that NMDARs in cortical layer 4 (L4), which receives the densest thalamocortical input, would be necessary for all forms of NMDAR-dependent and input-specific V1 plasticity. We tested this hypothesis in awake mice using a genetic approach to selectively delete NMDARs from L4 principal cells. We found, unexpectedly, that both stimulus-selective response potentiation and potentiation of open-eye responses following monocular deprivation (MD) persist in the absence of L4 NMDARs. In contrast, MD-driven depression of deprived-eye responses was impaired in mice lacking L4 NMDARs, as was L4 long-term depression in V1 slices. Our findings reveal a crucial requirement for L4 NMDARs in visual cortical synaptic depression, and a surprisingly negligible role for them in cortical response potentiation. These results demonstrate that NMDARs within distinct cellular subpopulations support different forms of experience-dependent plasticity.
Keywords: amblyopia, long-term depression, NMDA receptor, ocular dominance plasticity, stimulus-selective response potentiation, visual cortex
Introduction
The cerebral cortex is highly malleable, modified to meet the ever-changing demands of our environment (Lashley 1931; Hebb 1949; Fuster 1995; Buonomano and Merzenich 1998; Ramachandran 2005). Cortical plasticity is elicited by various challenges, including altered sensory experience (Goldstone 1998; Xerri et al. 1999; Letzkus et al. 2011), sensory deprivation (Wiesel and Hubel 1963; Flor et al. 1995; Muhlnickel et al. 1998), or a combination of these two factors (Mitchell 1991; Diamond et al. 1993; Engineer et al. 2011). Plasticity resulting from altered experience and deprivation has perhaps been best studied in the primary visual cortex (V1). Since V1 contains many key elements common to all neocortical circuits, it serves as a strong model for neocortical plasticity at the structural, functional, and molecular levels (Douglas and Martin 2004).
The most well-studied example of experience-dependent cortical plasticity is the shift in ocular dominance (OD) that occurs in V1 following temporary monocular deprivation (MD). In juvenile animals, this manifests first as a rapid reduction in cortical response to vision through the deprived eye, followed by a gradual potentiation of responses to vision through the non-deprived eye (Wiesel and Hubel 1963; Drager 1978; Mioche and Singer 1989; Gordon and Stryker 1996; Frenkel and Bear 2004; Mrsic-Flogel et al. 2007). Early life OD plasticity results in pronounced deficits in vision that can last into adulthood (Blakemore et al. 1978; Fong et al. 2016), modeling the disabling human condition of amblyopia (Webber and Wood 2005). Additionally, OD plasticity can persist into adulthood in mice, though the shift is primarily driven by potentiation of V1 responses elicited through the open eye, rather than by depression of responses through the previously deprived eye (Sawtell et al. 2003; Sato and Stryker 2008). While the qualities of OD plasticity differ in juveniles and adults, both deprived-eye depression and open-eye potentiation generalize across visual stimuli. In contrast, a third form of experience-dependent plasticity, known as stimulus-selective response potentiation (SRP), features a robust increase in responses in V1 evoked by repeated exposure to an oriented visual grating stimulus in mice (Frenkel et al. 2006). Recent work indicates that SRP is a critical factor in learning to recognize visual stimuli (Cooke et al. 2015; Kaplan et al. 2016). Both SRP and OD plasticity can be studied in mice using the same simple experimental measure; the magnitude of visual-evoked potentials (VEPs) recorded from thalamo-recipient layer 4 (L4) (Porciatti et al. 1999; Sawtell et al. 2003; Frenkel and Bear 2004; Frenkel et al. 2006). Thus, V1 represents a single, tractable experimental system that can be used for evaluating a plethora of plasticity mechanisms occurring in the cerebral cortex in response to altered sensory experience.
While the expression of SRP, open-eye potentiation, and deprived-eye depression differ in terms of stimulus selectivity and directionality of the altered cortical response, these three forms of plasticity share a few key features that suggest overlapping mechanisms. First, testing expression of plasticity through one eye at a time has revealed that each form of plasticity is input-specific within binocular V1 (Gordon and Stryker 1996; Sawtell et al. 2003; Frenkel and Bear 2004; Pham et al. 2004; Frenkel et al. 2006; Cooke et al. 2015), implying that they all occur prior to binocular integration. Because these forms of response modification depend on mechanisms local to V1, it has been hypothesized that plasticity occurs at thalamocortical synapses (Cooke & Bear 2014). The combined evidence implicates modification of synapses onto neurons within L4, the cortical layer with the densest thalamocortical input (Frost and Caviness 1980), where binocularity first emerges (Drager 1975). A second common feature of all these forms of plasticity is the requirement for activation of the NMDA-type ionotropic glutamate receptors (NMDARs) in V1. The NMDAR is a critical factor in the induction of many forms of input-specific Hebbian synaptic plasticity (Dudek and Bear 1992; Bliss and Collingridge 1993; Kirkwood and Bear 1995; Feldman 2009) thanks to its twin properties of voltage-dependency and ligand-gating (Nowak et al. 1984). Disruption of NMDAR function in V1 of mice prevents SRP (Frenkel et al. 2006; Cooke et al. 2015), juvenile OD plasticity (Sato and Stryker 2008; Cho et al. 2009), and adult OD plasticity (Sawtell et al. 2003).
Intersectional genetic approaches using subregion-specific Cre recombinase mouse lines to ablate the mandatory GluN1 subunit of NMDAR have previously been used with remarkable success to delineate circuits that are modified to support particular forms of learning and memory (Tsien et al. 1996b; McHugh et al. 2007; McHugh and Tonegawa 2009). Here, we take a similar approach to test the hypothesis that NMDARs specific to excitatory neurons in neocortical L4 are necessary for input-specific visual cortical plasticity recorded at that site. Unexpectedly, we found that SRP and its behavioral correlate of long-term habituation persisted even when NMDARs were genetically eliminated only from L4. Moreover, following MD, the potentiation of visual cortical responses to stimulation of the open eye remained similarly intact in the absence of L4 NMDARs in both juvenile and adult mice. In contrast, deprived-eye depression following MD in juvenile mice was impaired in the absence of L4 NMDARs. This impairment in plasticity spared mice from the loss of acuity and contrast sensitivity that typically follow early life MD. Experiments in V1 slices ex vivo revealed that long-term synaptic depression (LTD) in L4 was absent in animals lacking NMDARs, providing a simple explanation for the failure of V1 response depression after MD.
The observation that various forms of response potentiation persist despite deletion of L4 NMDARs was unexpected. These results indicate that SRP and open-eye potentiation after MD reflect NMDAR-dependent plasticity occurring on cells other than L4 excitatory neurons and challenge how eye-specific visual plasticity is traditionally interpreted.
Methods and Materials
Animals
All experiments were conducted using male and female transgenic mice on the C57BL/6J background and maintained at MIT. Breeding animals originated from The Jackson Laboratory from lines bred together with the C57BL/6J inbred substrain (The Jackson Laboratory, 000664). Hemizygous Scnn1a-Cre-Tg3 mice (The Jackson Laboratory, 009613; originally described in Madisen et al. [2010] and maintained on the C57BL6/J background) and homozygous floxed GluN1 mice (The Jackson Laboratory, 005246; originally described in Tsien et al. [1996a] and maintained on the C57BL6/J background) were bred and backcrossed to produce layer 4 GluN1 knockout mice (Scnn1a-Cre+/−, GluN1fl/fl) and littermate controls (Scnn1a-Cre−/−, GluN1fl/fl) used in most experiments. For fluorescence-guided whole-cell recordings and histological analyses, mice were additionally crossed to the Ai14 reporter line (The Jackson Laboratory, 007908; originally described in Madisen et al. [2010] and maintained on the C57BL6/J background) to reveal cell types with Cre recombinase activity. Animals were housed in groups of 2–5 same-sex littermates after weaning at postnatal day (P) 21. Animals were maintained on a 12 h light–dark cycle, with food and water available ad libitum. All experiments were performed blind to genotype. All procedures adhered to the guidelines of the National Institutes of Health and were approved by the Committee on Animal Care at MIT.
Ex vivo Whole-Cell Recordings
Whole-cell voltage clamp recordings were used to measure AMPA receptor and NMDA receptor mediated excitatory postsynaptic currents (EPSCs) in L4 principal cells targeted by the Scnn1a-Cre driver, either in putative L4-GluN1 knockout mice (Scnn1a-Cre+/−, GluN1fl/fl) or age-matched controls (Scnn1a-Cre+/−, GluN1+/+ or Scnn1a-Cre+/−, GluN1fl/+). To mediate patch recordings from Cre-positive L4 cells, two strategies were used to fluorescently label neurons expressing Cre recombinase. Strategy 1: We injected an adeno-associated virus (AAV5-EF1α-DIO-eGFP) into the binocular zone of V1 to drive Cre-mediated expression of the enhanced green fluorescence protein (eGFP) reporter (3.1 mm lateral of lambda, 81 nL of virus at each of three depths: 600, 450, and 300 μm from the cortical surface), allowing 3–4 weeks recovery prior to tissue harvest. Strategy 2: We bred a triple transgenic animal using the Scnn1a-Cre, floxed GluN1, and the Cre-dependent tdTomato reporter line, Ai14. All animals used in these experiments were hemizygous for Cre (Scnn1a-Cre+/−) and heterozygous for Ai14 (Ai14-tdTomato+/−), but were considered L4-GluN1 knockout animals if they were homozygous for the floxed GluN1 alleles (GluN1fl/fl) and considered control animals if they expressed a wildtype copy of GluN1 (GluN1+/+ or GluN1fl/+). For all experiments, animals were 4–6 months old at the time of tissue harvest. Coronal slices of V1 were prepared at a thickness of 350 μm in ice-cold dissection buffer containing (in mM): 87 NaCl, 75 sucrose, 2.5 KCl, 1.25 NaH2PO4, 25 NaHCO3, 0.5 CaCl2, 7 MgCl2, 1.3 ascorbic acid, and 10 d-glucose, saturated with 95% O2 and 5% CO2. Slices were recovered for 40 min at 33 °C and for approximately 1 h at room temperature in artificial cerebrospinal fluid (aCSF) containing (in mM): 124 NaCl, 5 KCl, 1.23 NaH2PO4, 26 NaHCO3, 2 CaCl2, 2 MgCl2, and 10 d-glucose, saturated with 95% O2 and 5% CO2. Whole-cell patch clamp recordings were performed in continuous perfusion of carbogenated aCSF at 30 °C using borosilicate pipettes with tip resistances of 3–5 MΩ. Pipettes were filled with an internal solution containing (in mM): 115 cesium methane sulfonate (CsMeSO3), 2.8 NaCl, 0.4 EGTA, 4 ATP-Mg2+, 10 phosphocreatine-Na2, 0.5 GTP-Na+, 5 TEA-Cl−, 5 QX-314 Br− buffered with 20 HEPES (pH 7.25, 285-290 mOsm). EPSCs were evoked by stimulation of the white matter (WM; 150 μs, 0.1 Hz, glass pipette electrode, and World Precision Instruments A365 stimulus isolator) at holding potentials of −70 and +40 mV. The AMPA receptor component was measured from evoked EPSCs at −70 mV in the presence of picrotoxin (100 μM) and glycine (1 μM), and the NMDA receptor component was measured from evoked EPSCs at +40 mV in the presence of DNQX (20 μM). NMDA/AMPA receptor mediated EPSC ratios were calculated on a cell-by-cell basis and the mean NMDA/AMPA ratio was computed for each animal.
Ex vivo Field Recordings
Extracellular field potential recordings were used to probe the relationship between stimulation intensity and evoked response, as well as LTD, in layer 4 of binocular V1. All experiments were performed on tissue from L4-GluN1 knockout animals (Scnn1a-Cre+/−, GluN1fl/fl) and littermate controls (Scnn1a-Cre−/−, GluN1fl/fl), with the experimenter blind to the genotype. Visual cortical slices from P26 to P30 animals were prepared and recovered as described above. Stimulus was delivered via a two-contact cluster microelectrode (Frederick Haer and Company (FHC), CE2C55) placed in the WM, and evoked excitatory postsynaptic field potentials (field EPSPs or fEPSPs) were recorded via a glass pipette with a tip resistance of ~1 MΩ placed in layer 4. Stimulus intensity was selected on a per-slice basis as the intensity that elicited 50–60% of the maximal field EPSP amplitude. LTD was induced using low-frequency stimulation (LFS) of 900 pulses at 1 Hz for 15 min. Stimulus frequency for the 30-min baseline and 60-min post-LFS recordings was 0.03 Hz. Slices with baseline drift greater than 5% were removed based on exclusion criteria established a priori. For each slice, the final 5 min of the baseline and the post-LFS periods was averaged and used to compute mean baseline-normalized field EPSPs for each animal. In addition, binned data were analyzed over time to identify specific 5-min epochs during which the field EPSPs showed (or lacked) changes from baseline.
Surgeries
Mice were prepared for surgery via administration of preoperative analgesics (buprenorphine, 0.1 mg/kg s.c.) and removal of fur above scalp. Induction of anesthesia was achieved via inhalation of isoflurane (3% in oxygen), or via administration of ketamine (50 mg/kg i.p.) and xylazine (10 mg/kg i.p.); animals were thereafter maintained in an anesthetized state with inhalant isoflurane (~1% in oxygen) until the conclusion of surgery (~1 h). For some experiments, 1% lidocaine hydrochloride was injected under the mouse’s scalp for local anesthesia. In all experiments, the scalp was cleaned with povidone–iodine (10% w/v) and ethanol (70% v/v). A midline incision was used to expose the skull, and connective tissue on the skull surface was carefully removed. A steel head post was positioned anterior to bregma and glued in place using cyanoacrylate. Small holes were drilled into the skull bilaterally to expose the cortical surface just above binocular V1, and tapered 300-500 MΩ tungsten microelectrodes (FHC, 30070) were lowered to cortical layer 4. For juvenile and adolescent mice (P21–P55), microelectrodes were implanted 3 mm lateral of lambda and 450 μm deep. For adult mice (≥P56), implant coordinates were 3.1 mm lateral of lambda and 460 μm deep. For each mouse, a silver reference electrode was implanted on the surface of prefrontal cortex. Electrodes were secured using cyanoacrylate and the skull was covered using dental cement. Animals were kept on a heated surface (∼37 °C) throughout the surgical procedure, and afterward transferred to a heated chamber to recover from anesthesia. Nonsteroidal anti-inflammatory drugs were administered upon return to the home cage and for two additional days postoperatively (meloxicam, 1 mg/kg s.c. every 24 h). Signs of infection and discomfort were carefully monitored. All surgical procedures were performed blind to genotype.
Visual Stimulation
Full-field visual stimuli were presented in the binocular visual field of awake, head-fixed mice. For monocular stimulation, an opaque occluder was used to limit vision to one of the two eyes within a recording session. Stimuli were viewed on an LCD monitor in an otherwise dark room. Neither the experimenter nor other mice were present in the room during stimulus presentation, which was controlled using custom software written in MATLAB using the PsychToolbox extension. Stimuli consisted of either sinusoidal-oriented gratings phase reversing at 2 Hz, or a luminance-matched gray screen. Each block of grating stimuli was separated by a 30-s presentation of gray. Sets of stimuli used for each experiment were as follows: Binocular spatial acuity, three blocks of 50 phase reversals at 100% contrast for each of the following pseudo-randomly presented spatial frequencies: 0.05, 0.1, 0.2, 0.4, 0.6, 0.7, and 0.8 cycles per degree (cpd); binocular contrast sensitivity, three blocks of 50 phase reversals at 0.05 cpd for each of the following pseudo-randomly presented contrast levels: 1%, 3%, 6%, 12%, 25%, 50%, and 100%; SRP and orientation-selective habituation (OSH), five blocks of 100 phase reversals at 0.05 cpd and 100% contrast; Adult OD, three blocks of 100 phase reversals at 0.05 cpd and 100% contrast; Juvenile OD, three blocks of 50 phase reversals at 0.05 cpd and 100% contrast; Monocular spatial acuity and contrast sensitivity were the same as the binocular condition, except the number of phase reversals was shortened to 25 phase reversals per block. For animals viewing gratings at multiple time points, novel-oriented grating stimuli were presented during each recording session. Each was at least 30° offset from any previously viewed orientation (except in SRP and OSH experiments, which featured a repeated familiar stimulus). On experimental day 7 of the SRP and OSH experiment, both familiar and novel stimulus orientations were presented in pseudo-randomly interleaved order. Only noncardinal orientations were used, and all orientations presented were the same among littermates.
In vivo Electrophysiology
All in vivo recordings were performed in awake, head-restrained animals during the subject’s light cycle to avoid contaminating circadian rhythmicity during visual stimulation. Mice were habituated to the recording apparatus and head-fixation (as well as monocular occluder, when applicable) while viewing a gray screen for 30-min sessions on two separate days. The local field potential (LFP) in V1 was continuously recorded at 1 kHz from microelectrodes implanted in binocular V1 using the Plexon Recorder-64 system. After amplification and digitization, data were low-pass filtered, and the VEP, defined as the average LFP waveform during the 300 ms following each phase reversal, was extracted and analyzed using custom software written in C++ and MATLAB. VEP waveforms were generated for each animal, time point, and stimulus condition. The magnitude of the VEP was defined as the amplitude from the first negative-going peak to the first positive-going peak of this biphasic VEP waveform. All recordings and analyses were performed blind to genotype.
Behavior
All behavioral data were collected concurrently with in vivo electrophysiological recordings during SRP experiments. During each recording, the animal was positioned with its forepaws resting upon a piezoelectric disk sensor (C.B. Gitty, 50-004-02) during binocular viewing of visual stimuli. A continuous voltage signal proportional to the mechanical pressure on the disk was sampled at 1 kHz and amplified/digitized using the Plexon Recorder-64 system alongside the LFP recordings. The voltage signal was down sampled to 100 Hz and the absolute value of the signal was used to quantify overall movement in post-hoc analyses. The visually induced fidget (vidget) was defined as the overall movement during the 5 s after the onset of a stimulus block (first 10 phase reversals) normalized to the mean of the 2 s period prior to stimulus onset (gray screen). The vidget magnitude for each block was defined as the average normalized values during that 5-s stimulus-driven period, which was subsequently averaged across blocks to generate a value for each animal for a given experimental session. Vidget waveforms and magnitudes are given in arbitrary units. All recordings and analyses were performed blind to genotype.
Eyelid Suture
For MD experiments, mice underwent lid suture of the eye contralateral to the V1 recording electrode approximately 1–2 h following baseline monocular VEP recordings. During this procedure, mice were anesthetized via isoflurane inhalation (1–3% in oxygen) and maintained at ~37 °C. The ipsilateral eye was coated with standard opthalamic ointment. Fur around the contralateral eye was trimmed, and the corneal surface was rinsed with sterile saline. Eyelid margins were trimmed, and the exposed tissue was lightly coated with an ophthalmic ointment containing bacitracin, neomycin, and polymysin. The top and bottom lids were sutured together using 4–5 mattress stitches of sterile polyglactin 910 thread (Ethicon, 6-0 Vicryl). Animals recovered on a warm pad in their home cage. Eyes were re-opened prior to the post-MD recording. Animals were again anesthetized with isoflurane as described and a sterile saline eyedrop was placed on the ipsilateral eye. Sutures were cut from the contralateral eye, eyelids were separated, and corneal surface was rinsed with sterile saline. Animals recovered in their home cage, and post-MD recordings were performed 45 min later. For juvenile OD experiments, MD was initiated at P27 and lasted for 3 days, or at P26 and lasted for 7-8 days. For adult OD experiments, MD was initiated at P71–P78 and lasted for 7–8 days. The duration of MD was consistent across littermates. Any eyelids that opened prior to the end of the deprivation period were excluded from the study. All eyelid sutures were performed blind to genotype.
Histology
Cre Activity Reporter
For validation of Cre recombinase activity in L4 of V1, L4-GluN1 knockout animals (Scnn1a-Cre+/− GluN1fl/fl) were crossed to Ai14 animals homozygous for the Cre-dependent tdTomato allele. Cre-positive offspring were deeply anesthetized using pentobarbital (Fatal Plus, 60 mg/kg i.p.) and perfused with 0.01 M phosphate buffered saline (PBS; Poly Scientific, S2138) followed by paraformaldehyde. The brain was harvested and submerged in 4% paraformaldehyde for 24 h at room temperature (RT). Coronal slices of V1 were made at a thickness of 50 μm using a vibrating microtome and placed in PBS. Slices were blocked/permeabilized with fetal bovine serum (10%) and Triton X-100 (0.2%) in PBS for 1 h at RT. Slices were then incubated with the primary antibody, mouse anti-parvalbumin (Millipore, MAB1572, 1:1000), in a diluted blocking solution overnight at 4 °C. After three washes in PBS, slices were incubated in the secondary antibody, goat anti-mouse conjugated to Alexa Fluor 488 (Invitrogen, A28175, 1:500) and the Hoechst nuclear stain (Thermo Scientific, 33342, 1:10000) in PBS for 1 h at RT. After three additional washes in PBS, slices were mounted onto positively charged microscope slides (Fisher Scientific, 12-550-15) and coverslipped with #1.5 glass (VWR, 48393-241 or 48393-251) and antifade mounting medium (Molecular Probes, P36961). The Scnn1a-Cre reporter protein tdTomato, as well as the Hoechst nuclear stain and Alexa Fluor 488-labeled parvalbumin-positive cells, were visualized using a confocal microscope (Olympus). The nuclear stain was used to delineate cortical cell layers and identify the tdTomato cells in L4. As expected, there was no overlap between the population of tdTomato-expressing cells (presumptive excitatory principal cells) and Alexa Fluor 488-labeled cells (presumptive parvalbumin-positive inhibitory interneurons). For clarity, only data for tdTomato expression are shown in Figure 1A.
Figure 1.
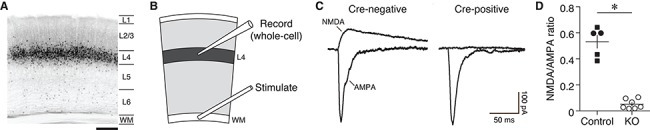
Cre-dependent knockout of NMDA receptors in cortical layer 4. (A) Confocal micrograph of Cre recombinase expression across layers of V1 in the Scnn1a-Cre line as revealed by the Cre-dependent tdTomato reporter. Scale bar, 200 μm. (B) Cartoon of visual cortical slice showing electrode placement for L4 voltage clamp recordings during stimulation of the white matter (WM). (C) Sample traces of evoked NMDA and AMPA receptor currents from V1 principal cells in L4-GluN1 knockout animal (Scnn1a-Cre+/−, GluN1fl/fl) recorded from a fluorescent Cre-positive (left) and a non-fluorescent Cre-negative (right) cell. Scale bars, 50 ms, 100 pA. (D) Mean ratio of NMDA-to-AMPA receptor currents from fluorescently-identified Cre-positive cells in animals possessing at least one wildtype copy of GluN1 (control, 0.5308 ± 0.05091; n = 5 animals, 9 cells) or from animals possessing two floxed copies of the GluN1 allele (KO, 0.05226 ± 0.01394, n = 7 animals, 11 cells). Filled circles, Scnn1a-Cre+/−, GluN1+/+; filled squares, Scnn1a-Cre+/−, GluN1fl/+; open circles, Scnn1a-Cre+/−, GluN1fl/fl. Error bars, SEM. Data points denote mean ratios within individual animals. Knockout animals showed significantly reduced ratios compared with wildtypes (Welch’s two-tailed t-test, t(4.605) = 9.067, P = 0.0004).
Cre Expression Across Development
To assess developmental changes in the laminar distribution of cells expressing Cre, P30–P120 Scnn1a-Cre+/−, Ai14+/− mice were perfused and tissue sectioned as described above for the Cre reporter histology. Fixed slices were mounted to positively charged microscope slides and permitted to dry for at least 24 h, before a hydrophobic barrier (ImmEdge PAP Pen, Vector Laboratories, H-4000) was applied around the edge of each slide. The tissue was counterstained with both fluorescent Nissl and Hoechst nuclear stains to better delineate the layers of V1. First, 0.1% Triton X-100 in PBS was applied for 10 min, followed by two additional 5-min washes in PBS at RT. Deep red fluorescent Nissl (Molecular Probes, N21483, 1:100) and Hoechst (1:10000) in PBS were then co-applied and incubated for 20-min at RT. Slices were washed again in 0.1% Triton X-100 in PBS for 10 min, then twice more in PBS for 5 min before a final 2-h wash in PBS (all performed at RT with gentle shaking). The hydrophobic barrier was removed using xylene. Slides were then coverslipped with #1.5 glass and antifade mounting media.
Images were captured within 1–7 days using 4× and 10× optical objective lenses on a confocal fluorescence microscope (Olympus). Each analyzed image is a maximum intensity projection of a 5 μm-spaced z-stack captured at 10×. Images from three bilateral slices centered over V1 were quantified, and then averaged for each animal using the Fiji distribution of ImageJ (NIH). To assess developmental changes in expression, the x/y coordinates of each cell positive for the Cre-dependent tdTomato reporter were recorded in Cre-positive mice perfused at four ages (P30, P60, P90, and P120). Two experimenters blind to the age of each mouse manually identified tdTomato-positive soma in V1. The number of cells is presented as in Figure S1 a function of cortical depth both in raw distance from the cortical surface along the translaminar axis and normalized to cortical thickness (surface to WM).
VGluT2 Immunofluorescence
To quantify thalamic projections to V1, P30–P115 Cre-positive (Scnn1a-Cre+/−, GluN1fl/fl) and Cre-negative littermates (Scnn1a-Cre−/−, GluN1fl/fl) were deeply anesthetized with pentobarbital (Fatal Plus, 60 mg/kg i.p.) and trans-cardially perfused as described above. Brains were extracted and submerged in 4% paraformaldehyde overnight at 4 °C, followed by 15% then 30% sucrose solutions (w/v in PBS) until the tissue sank. Each brain was placed into specimen molds (Cryomold Intermediate, Tissue-Tek, 4566), submerged in OCT Compound (Tissue-Tek, 4583), and flash-frozen on dry ice prior to storage at −80 °C. On the day of sectioning, each brain was gradually returned to −20 °C and 50 μm coronal slices were collected on a frozen cryotome (Leica, CM3050S). Alternating slices were placed into 24-well plates (Corning) containing either a PBS (for immediate processing) or a cryoprotectant solution (1% polyvinylpyrrolidone-40, 30% ethylene glycol, 30% sucrose in 0.2 M phosphate buffer; for long-term storage at −20 °C).
To enhance VGluT2 labeling, slices at 300 μm increments were transferred from PBS to pH 6.0, 10 mM sodium citrate buffer containing 0.05% Tween-20 (Bio-Rad, 170-6531) for 5-min at RT, then 60 min at 80 °C, and allowed to cool to RT over the subsequent 30 min. Tissue was rinsed in PBS and placed into blocking solution (PBS containing 10% normal goat serum [NGS; Abcam, ab7481], 1% bovine serum albumin [BSA; Sigma, A3912], and 1% Triton X-100 [Sigma T9284]) for 60-min with shaking. Tissue was then incubated in PBS containing 5% NGS, 1% BSA, 0.4% Triton X-100, and guinea pig anti-VGluT2 polyclonal primary antibody (Millipore, AB2251-I, 1:5000) for 48h at 4 °C with gentle shaking. Primary solution was then aspirated, and 3 × 5-min washes applied: first PBS, then 0.1% Triton X-100 in PBS, then PBS. Next, fluorophore-conjugated donkey anti-guinea pig IgG secondary antibody (AlexaFluor 555; Abcam, ab150186, 1:500) in PBS containing 5% NGS, 1% BSA, 0.4% Triton X-100 was applied for 20 h at 4 °C with gentle shaking. The tissue was then counterstained with fluorescent Nissl and Hoechst as described previously, except that procedures were performed in well plates. Thereafter, slices were mounted onto slides and coverslipped with #1.5 glass and antifade mounting media as described previously.
Microscopy was conducted with 1–7 days as described above. The mean intensity of fluorescently labeled VGluT2 terminals in V1 was profiled along an axis perpendicular to the cortical surface and plotted as a function of depth. Hoechst stain was also quantified as a control to assess potential genotypic differences and to normalize the VGluT2 signal. For both VGluT2 and Hoechst, mean intensity profiles were computed from the cortical surface to a depth of 865 μm.
Electrode Tracts
The proper position of electrodes used for in vivo recordings was validated post-mortem. After the final experimental recording, mice were deeply anesthetized via isoflurane inhalation and subsequently decapitated. The dental cement head cap holding the electrodes was quickly removed, and brains were extracted and submerged 4% paraformaldehyde for 72 h at RT. Coronal slices of V1 were made at a thickness of 50–60 μm using a vibrating microtome. Slices were mounted onto positively charged glass slides and allowed to dry for 24 h. Nissl bodies were stained using cresyl violet, and slides were subsequently cover-slipped using #1.5 glass and a toluene-based mounting medium (Fisher Chemical, SP15). Mounted slices were imaged using the transmitted light channel on a confocal microscope Comparison of Nissl staining with a mouse brain atlas (Paxinos et al. 2019) was used to locate binocular V1 and distinct neocortical layers. Animals that did not show an electrode tract localized to layer 4 of binocular V1 were excluded from the study. All analyses were performed blind to genotype.
Statistics
Statistical analyses were performed in GraphPad Prism and SPSS. Unless otherwise noted, all plots throughout the manuscript show mean ± standard error of the mean (SEM) and the n number reported is the number of animals within an experimental condition. Normality was assessed using the Shapiro–Wilk test, and outlier analysis was performed using the ROUT method (Q = 0.2%). For NMDA/AMPA ratios, the statistical difference between the two genotypes was assessed using Welch’s unpaired two-tailed t-test for unequal standard deviations. For WM-L4 input–output measurements, the interaction between genotype and stimulation intensity was analyzed using a two-way repeated measures analysis of variance (ANOVA). For the LTD experiment, the statistical difference between the two genotypes was assessed by comparing the magnitude of fEPSP at 55–60 min after LFS using Student’s unpaired two-tailed t-test for equal standard deviations. Meanwhile, the time course of the fEPSP after LFS was analyzed using a mixed model ANOVA, with Bonferroni’s posthoc tests to determine differences from the pre-LFS baseline. For all ex vivo experiments where there are multiple observations per animal (e.g. multiple cells or slices), the observations were averaged prior to statistical analyses and n was the number of animals (although total number of observations is explicitly stated in figure legends). For in vivo experiments, raw electrophysiological (VEP) and behavioral (vidget) data were analyzed using two-way repeated measures ANOVA, where one factor was genotype and the second factor was either spatial frequency (visual acuity), contrast level (contrast sensitivity), stimulus orientation (SRP), or time (OD, pre- vs. post-MD). In cases of statistically significant interaction between genotype and the second factor, Bonferroni’s posthoc tests were performed to examine statistical significance. Normalized OD data were analyzed using a one-sample t-test (if Shapiro–Wilk Ho not rejected) or a Wilcoxon signed-rank test (if Shapiro–Wilk Ho rejected) with a hypothetical mean or median of 1. Differences in VGluT2 expression between genotypes were analyzed using a two-way ANOVA. At the conclusion of the formal planned analysis, we subdivided data based on sex and found that there was no sex-dependent difference in our analysis of genotype. For all statistical analyses, α was set at a pre-determined value of 0.05.
Results
Scnn1a-Cre-Dependent Deletion of GluN1 Eliminates NMDA Receptors in Cortical Layer 4 Principal Cells
To enable targeted ablation of NMDARs, we used a transgenic mouse in which the Grin1 gene, which encodes the obligatory NMDAR GluN1 subunit, is flanked by loxP sites (Tsien et al. 1996a). We crossed this mouse with the Scnn1a-Cre-Tg3 transgenic line, which selectively and stably drives Cre recombinase activity in L4 principal cells during postnatal life (Madisen et al. 2010) (Figs 1A and S1). Backcrossing for one or more generations yielded a subset of offspring that were homozygous for the floxed Grin1 allele and hemizygous for Cre (Cre+/−, GluN1fl/fl henceforth referred to as L4-GluN1 knockout mice). In order to verify deletion of NMDARs in L4-GluN1 knockouts, we expressed a Cre-dependent fluorescent reporter protein in primary visual cortex (V1) of adult L4-GluN1 knockout mice to enable fluorescence-guided whole-cell voltage clamp recordings from acute slices of V1 (Fig. 1B). We then measured NMDAR-mediated synaptic currents in fluorescent (Cre-positive) and non-fluorescent (Cre-negative) visual cortical neurons. Both NMDAR- and AMPAR-mediated component was apparent in Cre-negative principal cells (Fig. 1C, left). However, only the AMPA-mediated EPSCs were present in Cre-positive cells (Fig. 1C, right), suggesting effective Cre-dependent deletion of NMDARs. To quantify the loss of NMDAR-mediated currents in L4 principal cells, we calculated the NMDA/AMPA EPSC ratio from Cre-positive cells in L4-GluN1 knockouts, and compared these with typical L4 principal cells targeted by the Scnn1a-Cre driver using age-matched Scnn1a-Cre hemizygotes with at least wildtype copy of the Grin1 allele as controls (Cre+/−, GluN1+/+ or Cre+/−, GluN1fl/+). Fluorescent Cre-positive cells from L4-GluN1 knockouts showed significantly reduced NMDA/AMPA ratios compared with those in control animals (control, 0.5308 ± 0.05091; L4-GluN1 knockout, 0.05226 ± 0.01394; P = 0.0004; Fig. 1D). These results confirm Cre-dependent elimination of NMDARs in L4-GluN1 knockout mice and set the stage to examine the necessity of L4 NMDARs in visual cortical function and plasticity.
Mice Lacking L4 NMDARs Show Intact Visual Acuity and Contrast Sensitivity Profiles
Classic studies in kittens have shown that pharmacological blockade of NMDARs in V1 can attenuate cortical responsiveness to visual stimuli (Kleinschmidt et al. 1987; Tsumoto et al. 1987; Fox et al. 1989; Miller et al. 1989; Bear et al. 1990), although the impact of that treatment on L4 and deeper layers is developmentally restricted (Fox et al. 1989). Further, recent work in mouse V1 has revealed that systemic blockade of NMDARs can reduce visual acuity and contrast sensitivity (Saiepour et al. 2018). We therefore examined how selective elimination of NMDARs from thalamo-recipient L4 principal cells would alter cortical responses to visual stimuli. We compared visual response properties between the L4-GluN1 knockouts and littermates that were homozygous for the floxed Grin1 allele but were functionally wildtype due to absence of the Cre transgene (Cre−/−, GluN1fl/fl referred to henceforth as wildtype). To assess differences in visual acuity, we recorded VEPs in L4 of binocular V1 (Figs 2A and S2) in awake, head-fixed mice (P34-P50) during binocular presentation of phase-reversing high-contrast grating stimuli at several different spatial frequencies (Fig. 2B). As expected, VEP magnitudes in wildtype animals were largest at lower spatial frequencies and tapered off at higher spatial frequencies (Fig. 2C, filled circles; Table S1A). L4-GluN1 knockout littermates showed a similar visual acuity profile (Fig. 2C, open circles; Table S1A) that was statistically indistinguishable from wildtypes (P = 0.8640). These data indicate that genetic deletion of L4 NMDARs does not alter visual acuity, consistent with previous findings in mice lacking NMDARs in cortical layers 2–4 (Sawtell et al. 2003).
Figure 2.
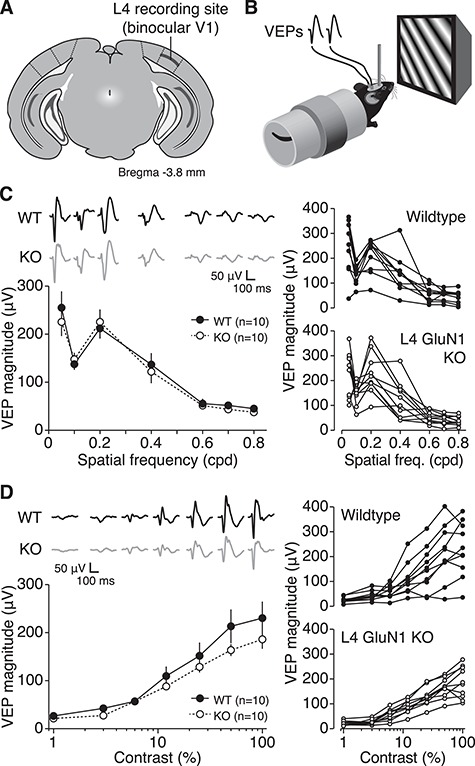
L4 NMDAR knockout mice show normal visual cortical response properties. (A) Cartoon of coronal slice 3.8 mm posterior to Bregma denoting recording location in L4 of binocular V1. (B) Schematic of awake mouse viewing phase-reversing grating stimuli during simultaneous recording of VEPs. (C) Left, mean VEP magnitudes across different spatial frequencies in L4-GluN1 knockout mice (n = 10) and wildtype littermates (n = 10). Error bars, SEM. There was no significant effect of genotype on acuity (two-way repeated measures ANOVA, interaction: F(6, 108) = 0.4204, P = 0.8640). Average VEP waveforms are shown above the plot. Scale bars, 100 ms, 50 μV. Right, spatial acuity VEP profiles for individual animals from each genotype. Age range, P34–P50. (D) Mean VEP magnitudes across different contrasts in L4-GluN1 knockout mice (n = 10) and wildtype littermates (n = 10). Error bars, SEM. There was no significant effect of genotype on contrast sensitivity (two-way repeated measures ANOVA, interaction: F(6, 108) = 1.036, P = 0.4059). Average VEP waveforms are shown above the plot. Scale bars, 100 ms, 50 μV. Right, contrast sensitivity VEP profiles for individual animals from each genotype. Age range, P35–P51.
To assess any differences in contrast sensitivity, we recorded VEPs from L4-GluN1 knockouts and wildtype littermates (P35-P51) while they viewed phase-reversing low-spatial frequency grating stimuli at varying contrast levels. Both genotypes showed reduced response magnitudes with decreasing contrast levels (Fig. 2D; Table S1B). While L4-GluN1 knockout animals appeared to have less variability than wildtype littermates, there was no significant interaction between genotype and contrast (P = 0.4059). These observations are reminiscent of findings in cats, ferrets, and monkeys, showing that selective disruption of NMDAR activity has only a marginal impact on V1 responses (Fox et al. 1989; Roberts et al. 1998; Daw et al. 1999; Self et al. 2012). In addition, ex vivo field recordings revealed no evidence of reduced synaptic strength in L4-GluN1 KO mice compared with littermate controls (P = 0.8458; Fig. S3) and overall thalamocortical input to V1 as assessed by VGluT2 immunohistochemistry was comparable in both genotypes (P = 0.7865; Fig. S4). Overall, our data indicate that mice lacking L4 NMDARs retain normal visual cortical response properties and thalamocortical innervation profiles.
L4 NMDARs are not Required for Stimulus-Selective Response Potentiation or Habituation to Familiar Visual Stimuli
NMDARs are required in multiple forms of experience-dependent visual cortical plasticity. Stimulus-selective response potentiation (SRP) is a long-lasting form of visual plasticity wherein repeated viewing of a stimulus over days drives a steadily increasing response in V1 (Frenkel et al. 2006), which is most pronounced in L4 (Cooke et al. 2015). Previous work has demonstrated that this cortical response enhancement can occur in an input-specific manner, with repeated exposure to familiar stimulus through one eye driving potentiation to that stimulus only when viewed through the exposed eye (Frenkel et al. 2006; Cooke et al. 2015). This suggests that SRP may occur at thalamocortical synapses carrying eye-specific information prior to binocular integration. In support of this hypothesis, SRP occludes thalamocortical long-term potentiation (LTP) and vice versa (Cooke and Bear 2010). Moreover, virally-mediated elimination of activity-dependent AMPA receptor insertion in V1 was sufficient to block SRP (Frenkel et al. 2006). Together, these data point toward L4, the cortical layer receiving the densest thalamocortical input, as the site of synaptic modification underlying SRP. Given that SRP induction and expression require NMDARs in V1 (Frenkel et al. 2006; Cooke et al. 2015), we hypothesized that genetic deletion of L4 NMDARs might impair SRP.
To test this hypothesis, we conducted VEP recordings from binocular V1 in awake head-fixed mice during viewing sessions of the same oriented grating stimulus for six consecutive days (Fig. 3A,B). Consistent with previous findings, wildtype mice showed a potentiating response to the familiar visual stimulus over days, as reflected in the increasing VEP magnitudes (Fig. 3C, filled circles; Table S2). Surprisingly, however, L4-GluN1 knockout animals also showed comparable response enhancement (Fig. 3C, open circles; Table S2) that was no different than wildtype littermates (P = 0.9456). This result indicates that L4 NMDARs are not required for familiarity-driven visual potentiation.
Figure 3.
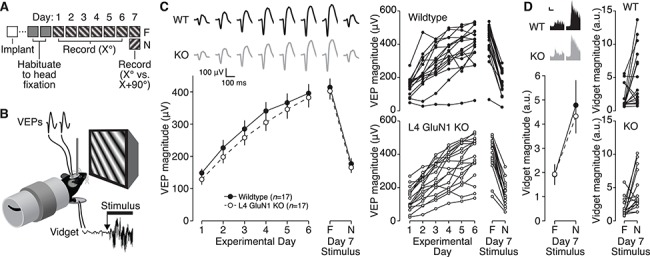
Stimulus-selective response potentiation is normal in absence of L4 NMDARs. (A) Experimental timeline for surgery, habituation, and V1 recordings during presentation of a familiar (F) or novel (N) oriented stimulus. (B) Schematic of awake mouse viewing phase-reversing grating stimuli during simultaneous recording of VEPs and visually induced fidgets (vidgets). (C) Left, mean VEP magnitudes on experimental days 1–6 during presentation of the same oriented visual stimulus, and on experimental day 7 during presentation of the familiar and novel stimuli, for L4-GluN1 knockout mice (n = 17) and wildtype littermates (n = 17). Both groups showed robust response potentiation, but there was no effect of genotype on the observed plasticity (two-way repeated measures ANOVA, interaction: F(5, 160) = 0.2372, P = 0.9456). In addition, both groups show potentiated VEPs for the familiar compared to the novel stimulus, but there was no effect of genotype on response specificity (two-way repeated measures ANOVA, interaction: F(1, 32) = 2.191 × 10⁻⁵, P = 0.9963). Error bars, SEM. Average VEP waveforms are shown above plot. Scale bars, 100 ms, 50 μV. Age range, P41–P150. Right, VEP magnitudes over time for individual animals used to generate averages at left. (D) Left, mean vidget magnitudes on experimental day 7 during presentation of the familiar or novel stimuli for L4-GluN1 knockout mice and wildtype littermates. Both groups show reduced vidget magnitude for the familiar compared to the novel stimulus, but there was no effect of genotype on these response profiles (two-way repeated measures ANOVA: interaction: F(1, 32) = 0.1286, P = 0.7222). Error bars, SEM. Average vidget waveforms are shown above plot. Scale bar, 2 s, 1 a.u. Right, vidget magnitudes for individual animals were used to generate averages at left. Data shown in this panel were collected concurrently with electrophysiology shown in (C).
Although L4-GluN1 knockout animals exhibited normal potentiation to a familiar visual stimulus, it is possible that this potentiation is not stimulus-selective. We tested this possibility on the final experimental day in the same animals, measuring the V1 response to the familiar oriented grating stimulus compared with a novel oriented grating stimulus (Fig. 3A; Table S2). Wildtype and L4-GluN1 knockouts both showed elevated responses to the familiar visual stimulus compared with the novel visual stimulus (Fig. 3C; Table S2). However, there was no effect of genotype on the stimulus-selectivity of the response (P = 0.9963). These results confirm that the response potentiation observed in L4-GluN1 knockouts is indeed stimulus-selective and indicate that NMDARs on L4 principal cells are not required for SRP.
The response enhancement characteristic of SRP typically occurs concomitant with behaviorally manifest long-term learning, known as orientation-selective habituation (OSH) (Cooke et al. 2015). OSH requires NMDARs in V1 and is characterized by a gradual decline in behavioral response as an animal becomes familiar with an oriented visual stimulus (Cooke et al. 2015). The behavioral response can be measured in a head-fixed animal concurrently with VEP recordings using a piezoelectric device placed beneath the forepaws to measure the visuomotor response at the transition between a neutral gray screen and a visual stimulus (Fig. 3B). Presentation of a visual stimulus drives a visually induced fidget-like behavioral response (vidget), and the magnitude of this vidget declines with stimulus familiarity (Cooke et al. 2015). OSH shares many mechanistic features with SRP, notably including the requirement for NMDARs in V1 (Cooke et al. 2015). We tested whether OSH was impaired in L4-GluN1 knockout mice by recording the magnitude of vidgets on the final experimental day concurrently with previously described VEP recordings. Like wildtype animals, the magnitude of the vidget in L4-GluN1 knockout animals was elevated for the novel stimulus relative to the familiar stimulus (Fig. 3D) and there was no difference in OSH attributable to genotype (P = 0.7222). These findings reveal that like SRP, OSH does not require NMDARs in L4 principal cells.
L4 NMDARs are not Required for Adult Ocular Dominance Plasticity in V1
We next examined how OD might be impacted by genetic deletion of NMDARs from L4 principal cells. In mice, thalamocortical inputs to binocular V1 serving the contralateral eye are 2–3 times as abundant as inputs carrying information from the ipsilateral eye (Coleman et al. 2009). This OD profile is also reflected in the physiological responses to monocular presentation of visual stimuli, where V1 responses to stimulation of the contralateral eye are approximately double those of the ipsilateral eye (Drager 1975; Gordon and Stryker 1996). The relative magnitudes of contralateral and ipsilateral responses in L4-GluN1 knockout animals exhibited normal baseline OD profiles in both adults and juveniles (Figs 4C, 5C, 6C; Table S3).
Figure 4.
Adult ocular dominance plasticity is normal in the absence of L4 NMDARs. (A) Experimental timeline for surgery, habituation, and V1 recordings during monocular presentation of oriented stimuli either before or after a 7–8-day period of eyelid closure in adult mice. (B, C) Mean VEP magnitudes before or after 7–8 days of MD for wildtype (n = 9) or knockout (n = 11) adult animals. Individual animal VEP magnitudes (circles) and average VEP waveforms (top) are included. Scale bars, 100 ms, 50 μV. There was no interaction between genotype and time in the magnitude of visual responses (two-way repeated measures ANOVAs, contralateral: F(1, 18) = 0.2022, P = 0.6584; ipsilateral F(1, 18) = 1.915, P = 0.1833). (D) Post-MD VEP magnitudes normalized to the pre-MD baseline values. This plot uses the same data as shown in (B, C), and normalization is performed on an animal-by-animal basis. Solid black lines denote mean and SEM. Dotted black line denotes the hypothetical median, signifying no change between pre- and post-MD magnitude. There was no change in deprived-eye VEP magnitude, but both genotypes showed evidence of open-eye potentiation (Wilcoxon signed-rank test, contralateral wildtype, P = 0.4961; contralateral knockout, P = 0.7646; ipsilateral wildtype, *P = 0.0391; ipsilateral knockout, *P = 0.0010). (E) Deprived (contralateral) versus non-deprived (ipsilateral) eye post-MD VEP magnitude using same data as (D). Individual animal values are shown here for both genotypes, and mean values are shown in Figure S5.
Figure 5.
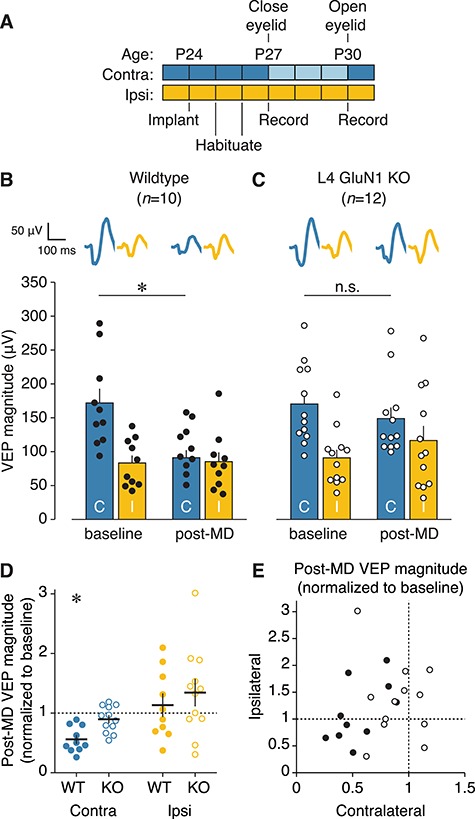
Deletion of NMDARs in L4 impairs juvenile ocular dominance plasticity. (A) Experimental timeline for surgery, habituation, and V1 recordings during monocular presentation of oriented stimuli either before or after a 3-day period of eyelid closure in juvenile mice. (B, C) Mean VEP magnitudes before or after 3 days of MD for wildtype (n = 10) or knockout (n = 12) juvenile animals. Individual animal VEP magnitudes (circles) and average VEP waveforms (top) are included. Scale bars, 100 ms, 50 μV. There was a significant interaction between genotype and time for contralateral eye responses (two-way repeated measures ANOVA, F(1,20) = 6.920, P = 0.0160). Wildtypes showed a significant depression of deprived-eye responses (baseline, 172.5 ± 21.20 μV; post-MD, 91.52 ± 11.30 μV; Bonferroni-corrected t-test, *P = 0.0002), while L4-GluN1 knockout animals did not (baseline, 171.0 ± 17.23 μV; post-MD, 149.4 ± 16.54 μV; Bonferroni-corrected t-test, P = 0.3426, denoted by n.s.). There was no effect of genotype on the response to MD for the ipsilateral eye (two-way repeated measures ANOVA, interaction: F(1,20) = 1.066, P = 0.3143). (D) Post-MD VEP magnitudes normalized to the pre-MD baseline values. This plot uses the same data as shown in (B, C), and normalization is performed on an animal-by-animal basis. Solid black lines denote mean and SEM. Dotted black line denotes the hypothetical mean, signifying no change between pre- and post-MD magnitude. Wildtype but not knockout animals showed significant depression of deprived-eye responses following MD, and neither genotype showed significantly altered open-eye responses (one-sample t-test, contralateral wildtype, *P = 0.0001; contralateral knockout, P = 0.1412; ipsilateral wildtype, P = 0.4774; ipsilateral knockout, P = 0.1285). (E) Deprived (contralateral) versus non-deprived (ipsilateral) eye post-MD VEP magnitude using same data as (D). Individual animal values are shown here for both genotypes, and mean values are shown in Figure S5.
Figure 6.
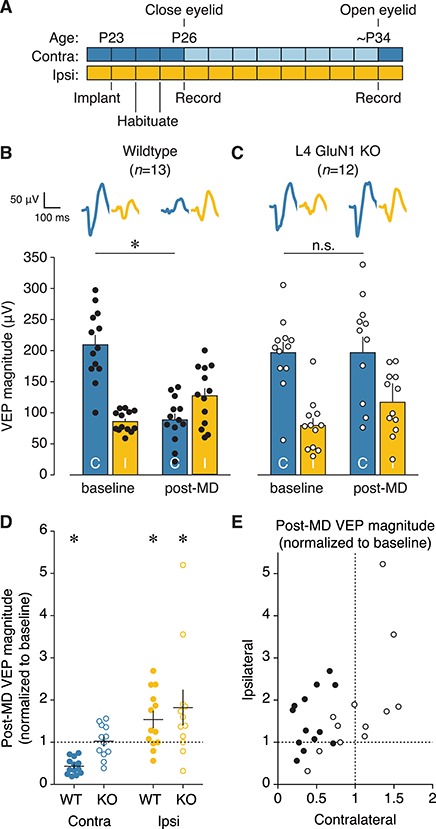
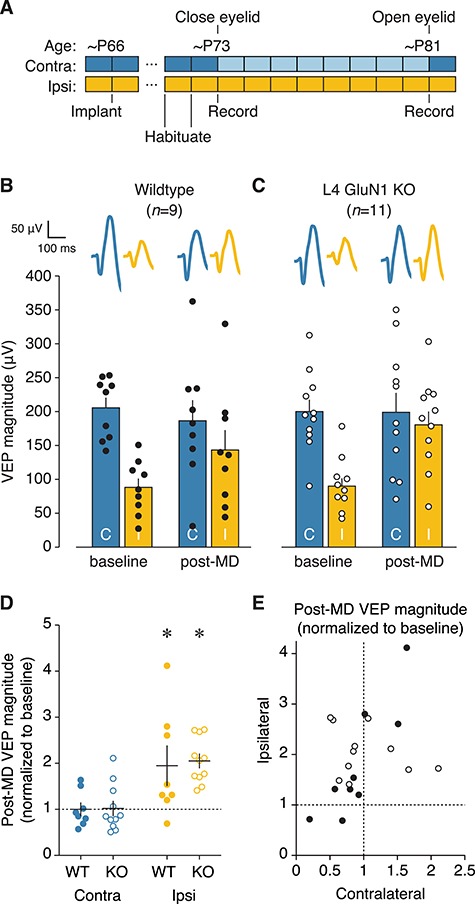
Deprived-eye depression, but not open-eye potentiation, is impaired by deletion of NMDARs in L4. (A) Experimental timeline for surgery, habituation, and V1 recordings during monocular presentation of oriented stimuli either before or after a 7–8-day period of eyelid closure in juvenile mice. (B, C) Mean VEP magnitudes before or after 7-8 days of MD for wildtype (n = 13) or knockout (n = 12) juvenile animals. Individual animal VEP magnitudes (circles) and average VEP waveforms (top) are included. Scale bars, 100 ms, 50 μV. There was a significant interaction between genotype and time for contralateral eye responses (two-way repeated measures ANOVA, F(1, 23) = 21.22, P = 0.0001). Wildtypes showed a significant depression of deprived-eye responses (baseline, 209.575 ± 15.666 μV; post-MD, 88.699 ± 10.083 μV; Bonferroni-corrected t-test, *P < 0.0001), while L4-GluN1 knockout animals did not (baseline, 196.871 ± 17.240 μV; post-MD, 196.858 ± 25.567 μV; Bonferroni-corrected t-test, P > 0.9999, denoted by n.s.). There was no effect of genotype on response to MD for the ipsilateral eye (two-way repeated measures ANOVA, interaction: F(1, 23) = 0.02338, P = 0.8798). (D) Post-MD VEP magnitudes normalized to the pre-MD baseline values. This plot uses the same data as shown in (B, C), and normalization is performed on an animal-by-animal basis. Solid black lines denote mean and SEM. Dotted black line denotes the hypothetical median signifying no change between pre- and post-MD magnitude. Wildtype but not knockout animals showed significant depression of deprived-eye responses following MD, and both genotypes showed significantly increased open-eye responses (Wilcoxon signed rank test, contralateral wildtype, *P = 0.0002; contralateral knockout, P = 0.9097, denoted by n.s.; ipsilateral wildtype, *P = 0.0266; ipsilateral knockout, *P = 0.0210). (E) Deprived (contralateral) versus non-deprived (ipsilateral) eye post-MD VEP magnitude using same data as (D). Individual animal values are shown here for both genotypes, and mean values are shown in Figure S5.
In adult mice, MD of the contralateral eye drives a shift in the OD profile via potentiation of open (ipsilateral) eye responses. Potentiation of open-eye responses driven by MD in adult mice has been demonstrated using a variety of measurement techniques and stimulation paradigms (Sawtell et al. 2003; Pham et al. 2004; Tagawa et al. 2005; Hofer et al. 2006; Sato and Stryker 2008). The accumulated evidence demonstrates that open-eye potentiation requires a sustained period of deprivation, with 7+ days producing reliable potentiation. Previous work has shown that MD-driven visual potentiation in adult mice requires NMDAR activity (Sato and Stryker 2008), and specifically NMDARs in L2–4 excitatory cells (Sawtell et al. 2003). In the present study, we asked whether NMDARs in L4 principal cells were necessary for adult OD plasticity.
We recorded VEPs from binocular V1 of adult L4-GluN1 knockout mice and wildtype littermates before and after 7–8 days of MD of the contralateral eye (Fig. 4A). Stimuli were presented separately to the contralateral and ipsilateral eyes to isolate eye-specific responses. Consistent with previous observations, wildtype mice, on average, showed no change in V1 responses elicited through stimulation of the deprived contralateral eye (P = 0.4961; Table S3A), but showed potentiation of open ipsilateral eye responses (P = 0.0391; Fig. 4B,D; Table S3B). L4-GluN1 knockout mice followed the same profile of eye-specific plasticity (Fig. 4C,D; Table S3), with no change in deprived-eye responses (P = 0.7646) but robust open-eye potentiation (P = 0.0010) irrespective of changes in deprived-eye responses (Fig. 4E). However, there was no difference in eye-specific responses that depended on genotype (contralateral, P = 0.6584; ipsilateral, P = 0.1833). These data indicate that L4 NMDARs are not required for adult OD plasticity.
Loss of L4 NMDARs Impairs the Early but not the Late Phase of Juvenile Ocular Dominance Plasticity
MD during an early life sensitive period is perhaps the most widely used paradigm for studying experience-dependent plasticity. Early life MD induces a shift in ocular dominance characterized by a rapid depression in responsiveness to visual stimulation of the deprived eye, followed by potentiation of open-eye responses (Gordon and Stryker 1996; Frenkel and Bear 2004). The deprivation-driven depression that characterizes the early phase of juvenile OD plasticity is reflected in the rapid drop in V1 activity in excitatory cells (Gandhi et al. 2008; Iurilli et al. 2012), and corresponds with structural and functional plasticity at excitatory thalamocortical synapses (Antonini and Stryker 1993; Coleman et al. 2010; Khibnik et al. 2010). The requirement for NMDAR activation in juvenile OD plasticity has been documented across several species (Kleinschmidt et al. 1987; Roberts et al. 1998; Heynen et al. 2003; Sato and Stryker 2008). Based on the importance of thalamocortical plasticity and NMDARs in juvenile OD plasticity, we hypothesized that L4 NMDARs would be necessary for MD-driven deprived-eye depression.
To test this hypothesis, we monocularly deprived the contralateral eye of juvenile mice for 3 days from P27 to P30 (Fig. 5A). This corresponds with the height of the early life sensitive period during which brief MD reliably drives depression of deprived-eye responses without impacting open-eye responses (Gordon and Stryker 1996; Frenkel and Bear 2004). We measured monocular VEPs through each eye before and after MD to assess changes in visual responsiveness. Consistent with previous work, 3 days of MD drove a reliable depression of deprived-eye responses in wildtype mice as reflected by the striking reduction in VEP magnitude (Fig. 5B,D; Table S3A). In contrast, L4-GluN1 knockout mice showed only a modest change in visual responsiveness following MD (Fig. 5C,D; Table S3A), and there was a significant effect of genotype on response to MD (P = 0.0160). While MD dramatically reduced contralateral eye responses in wildtype animals (P = 0.0002), they did not significantly alter responses in L4-GluN1 knockouts (P = 0.3426). Meanwhile, open-eye responses showed little change, and there was no effect of genotype on open-eye responses to MD (P = 0.3143), nor was there any obvious relationship between the changes in responsiveness in the deprived versus open eyes (Fig. 5E). Based on these data, we conclude that NMDARs on L4 principal cells are necessary for depression of deprived-eye responses following early life MD.
Our results thus far reveal a requirement for L4 NMDARs in juvenile, but not adult, OD plasticity, suggesting a developmental shift in the locus of experience-dependent modification. Alternatively, the disparity could result from involvement of L4 NMDARs in plasticity mediated by depression, but not potentiation. To distinguish between these possibilities, we evaluated open-eye potentiation in juvenile animals, which can occur when the period of MD is extended to approximately one week (Frenkel and Bear 2004; Mrsic-Flogel et al. 2007; Kaneko et al. 2008; Spolidoro et al. 2012). Like adult OD plasticity, open-eye potentiation in juvenile animals is NMDAR-dependent (Cho et al. 2009), though importantly, adult and juvenile open-eye potentiation are mechanistically distinct (Pham et al. 2004; Ranson et al. 2012, 2013).
To determine whether L4 NMDARs are required for juvenile open-eye potentiation, we performed 7–8 days of MD in juvenile mice (Fig. 6A). In agreement with previous studies, this manipulation led to both depression of deprived-eye responses (P = 0.0002) and potentiation of open-eye responses (P = 0.0266) in wildtype animals (Fig. 6B,D; Table S3). Meanwhile, there was little change in deprived-eye responses in the L4-GluN1 knockout animals (P = 0.9097; Fig. 6C,D; Table S3A), similar to our observations following brief deprivation (Fig. 5C,D). Notably, knockout animals exhibited robust potentiation of open-eye responses (P = 0.0210; Fig. 6C,D; Table S3B) despite the impairment in deprived-eye depression. In fact, L4-GluN1 knockout animals appeared to exhibit a generalized potentiation, with increased deprived-eye responses corresponding to increased open-eye responses (Fig. 6E). Overall, there was a significant interaction between genotype and the response to MD for the deprived contralateral eye (P = 0.0001), but not for the open ipsilateral eye (P = 0.8798). Thus, juvenile OD plasticity exhibits two distinct phases that are differentially dependent on layer 4 NMDA receptors. Broadly, our OD experiments reveal a requirement for L4 NMDARs in the depression of deprived-eye responses, but not the potentiation of open-eye responses at any age (Fig. S5).
Elimination of L4 NMDARs Spares Mice From Visual Impairments that Typically Follow Juvenile Monocular Deprivation
While OD plasticity is a straightforward readout of the effects of MD, it does not fully demonstrate the broad extent of the deficit in visual cortical function that arises from MD. Early life MD not only drives a classic depression of deprived-eye responses, but also degrades visual acuity though the deprived eye (Dews and Wiesel 1970; von Noorden 1973; Giffin and Mitchell 1978; Prusky et al. 2000; Prusky and Douglas 2003). Our observation that knockout mice show impaired deprived-eye depression suggests that loss of L4 NMDARs might also eliminate decrements in acuity that typically follow early MD. However, recent work in mice has revealed that the development and plasticity of OD and visual acuity are distinct (Kang et al. 2013; Stephany et al. 2014, 2018; Salinas et al. 2017). Therefore, it is possible that acuity in L4-GluN1 knockouts could still shift dramatically after MD even though deprived-eye responses only show marginal changes (Figs. 5C,D and 6C,D; Table S3A). To test this possibility, we measured monocular VEPs across of range of spatial frequencies in juvenile animals that had previously been monocularly deprived for 7–8 days (Fig. 6A). Compared with wildtype littermates, L4-GluN1 knockout animals exhibited an enhanced spatial acuity profile through the deprived contralateral eye (P = 0.0378; Fig. 7A; Table S3A). Meanwhile, acuity through the open ipsilateral eye was comparable between genotypes (P = 0.7317; Fig. 7B; Table S3B). These results suggest that the absence of L4 NMDARs spares the visual system of decrements in visual acuity. In addition, we tested monocular responses to varying contrasts in these animals and found that, like acuity, contrast sensitivity was enhanced in L4-GluN1 knockouts for the deprived eye (P < 0.0001; Fig. 7C; Table S3A), but not the open eye (P = 0.6704; Fig. 7D; Table S3B). Notably, post-MD contralateral responses in L4-GluN1 knockouts (Fig. 7A,C) were comparable with the baseline (nondeprived) binocular acuity profile (Fig. 2C,D). Because binocular responses are dominated by contributions from the contralateral eye, this suggests that there was little, if any, MD-driven shift in the visual acuity or contrast sensitivity. Taken together our data suggest that the typical degradation of visual functions observed following early MD is spared in animals lacking L4 NMDARs.
Figure 7.
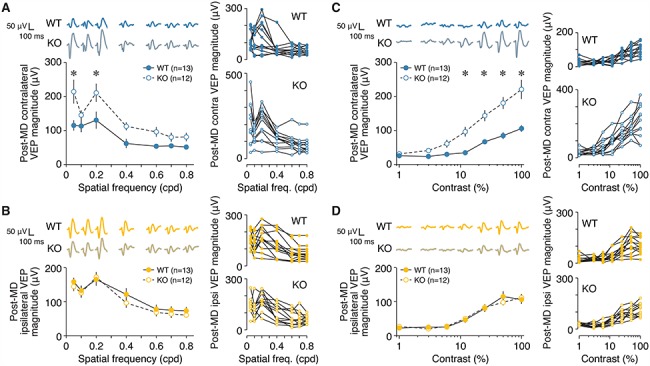
Deficits in visual function driven by MD are spared in animals lacking L4 NMDA receptors. (A) Left, mean contralateral VEP magnitudes across different spatial frequencies in L4-GluN1 knockout mice (n = 12) and wildtype littermates (n = 13) following 7–8 days of contralateral eye MD. Error bars, SEM. There was a significant interaction between genotype and spatial frequency (two-way repeated measures ANOVA, interaction: F(6, 138) = 2.302, P = 0.0378). Wildtypes showed significantly reduced deprived (contralateral) eye responses compared with L4-GluN1 knockout animals at 0.05 and 0.2 cpd (Bonferroni-corrected t-tests for wildtype vs. knockout: 0.05 cpd, *P = 0.0006; 0.1 cpd, P > 0.9999; 0.2 cpd, *P = 0.0092; 0.4 cpd, P = 0.2952; 0.6 cpd, P = 0.6172; 0.7 cpd, P > 0.9999; 0.8 cpd, P > 0.9999). Average VEP waveforms are shown above the plot. Scale bars, 100 ms, 50 μV. Right, spatial acuity VEP profiles for individual animals from each genotype. (B) Same format and animals as (A), but instead measured during stimulation of the open ipsilateral eye following 7–8 days of contralateral eye MD. There was no significant interaction between genotype and spatial frequency (two-way repeated measures ANOVA, interaction: F(6, 138) = 0.5978, P = 0.7317). (C) Same format and animals as (A), but for a range of different contrasts. There was a significant interaction between genotype contrast (two-way repeated measures ANOVA, interaction: F(6, 138) = 9.118, P < 0.0001). Wildtypes showed significantly reduced deprived (contralateral) eye responses compared with L4-GluN1 knockout animals at contrast levels of 12% or higher (Bonferroni-corrected t-tests for wildtype vs. knockout: 1%, P > 0.9999; 3%, P > 0.9999; 6%, P = 0.4444; 12%, *P = 0.0020; 25%, *P < 0.0001; 50%, *P < 0.0001; 100%, *P < 0.0001). (D) Same format and animals as (C), but instead measured during stimulation of the open ipsilateral eye following 7–8 days of contralateral eye MD. There was no significant interaction between genotype and spatial frequency (two-way repeated measures ANOVA, interaction: F(6, 138) = 0.6746, P = 0.6704). All data in this figure were collected from same animals used in Figure 6 after opening the deprived eye at P33 or P34.
L4 NMDARs are Required for Long-Term Depression
A primary mechanism thought to underlie depression of deprived-eye responses following MD is homosynaptic LTD of excitatory thalamocortical synapses (Heynen et al. 2003; Yoon et al. 2009). Our observations that L4-GluN1 knockouts show impaired MD-driven response depression, but not stimulus-selective or MD-driven response potentiation, suggest that L4 NMDARs may be specifically required for LTD in V1. We therefore hypothesized that L4-GluN1 knockout mice would also exhibit impaired LTD of the L4 field potential ex vivo. In support of this hypothesis, previous work has revealed that pharmacological blockade of postsynaptic NMDARs blocks depression of synaptic currents onto L4 individual neurons (Crozier et al. 2007).
To measure L4 field potentials ex vivo, we generated acute V1 slices from L4-GluN1 knockouts and wildtype littermates, and recorded fEPSPs in L4 during stimulation of the WM (Fig. 8A). After 30 min of baseline recording, slices were administered LFS (900 pulses at 1 Hz) and fEPSP recording resumed for 60 min thereafter. As expected, in wildtype animals, LFS elicited an immediate and lasting reduction in fEPSP magnitude compared with baseline, indicative of LTD (Figs 8B and S6). In L4-GluN1 knockouts, LFS initially reduced fEPSPs; however, the effect was transient, with fEPSPs returning to baseline levels just 5 min after LFS ceased (Figs 8B and S6). Overall, wildtypes exhibited a sustained drop in the electrically-evoked responses (55–60 min post-LFS: 78.86 ± 4.985%), which was absent in L4-GluN1 knockout littermates (55–60 min post-LFS: 97.95 ± 5.035%) and significantly different than wildtypes (Fig. 8C; P = 0.0274). These data show that LTD in L4 of V1 requires NMDARs on L4 principal cells. Based on available data, this likely reflects a mechanistic impairment that underlies the observed deficit in deprived-eye depression.
Figure 8.
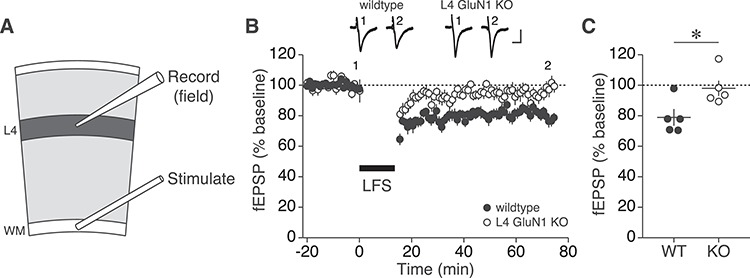
L4 NMDARs are required for long-term depression in V1. (A) Cartoon of visual cortical slice with positions of field recording electrode in L4 and stimulation electrode in the white matter (WM). (B) Time course of mean L4 fEPSP magnitudes normalized to baseline for wildtype (n = 5) and L4-GluN1 knockout (n = 5) juvenile animals before and following LFS (900 stimuli at 1 Hz). Error bars, SEM. Example waveforms at select time points before and after LFS are shown above plot for each genotype. Scale bars, 10 ms, 50 μV. (C) Baseline-normalized fEPSP magnitudes during final 5 min of time course shown in (B). LTD was observed in wildtypes (78.86 ± 4.985%), but not in knockouts (97.95 ± 5.035%), and the two genotypes differed significantly (Student’s two-tailed t-test, *P = 0.0274).
Discussion
In this study, we used mice to test the hypothesis that NMDARs on L4 principal neurons are critical for plasticity triggered by sensory experience, sensory deprivation, or a combination of those factors. We have revealed that the hypothesis is only correct with respect to the effects of deprivation in juvenile animals.
We knocked out the mandatory GluN1 subunit of the NMDAR selectively in L4 principal cells using an intersectional, Cre recombinase-dependent genetic knockdown strategy in mice. After confirming that this intervention eliminated NMDAR-mediated currents in L4 neurons (Fig. 1) without impairing responses to visually- or electrically-evoked input in L4 of V1 (Figs. 2 and S3), we assessed the impact of this loss of L4 NMDAR function on several well-studied forms of NMDAR-dependent plasticity. First, we made the surprising observation that SRP and its behavioral correlate, OSH, remained completely intact in L4-GluN1 KO mice (Fig. 3). A second surprising observation was that open-eye potentiation resulting from extended MD was unaffected by loss of L4 NMDARs in both adult (Fig. 4) and juvenile (critical period) mice (Fig. 6). Finally, in stark contrast to these observations, the early phase of juvenile OD plasticity, characterized by depression of the visual cortical response elicited through a previously deprived eye (Gordon and Stryker 1996; Frenkel and Bear 2004), was significantly impaired in the absence of functional L4 NMDARs (Figs 5 and 6). Decrements in visual acuity and contrast sensitivity that typically follow extended MD also failed to occur without L4 NMDARs (Fig. 7), as did LTD elicited by LFS in V1 slices (Fig. 8). Impairments of these various forms of response depression are consistent with the prevailing view of the pathogenesis of amblyopia, but the persistence of three distinct forms of potentiation measurable within layer 4 was unexpected and challenges our understanding of the locus of experience- and NMDAR-dependent modifications.
Plasticity Underlying Stimulus-Selective Response Potentiation and Orientation-Selective Habituation Occurs Outside of Layer 4
Understanding how the neocortex supports long-term memory is a major goal of neuroscience (Lashley 1931; Fuster 1995). Long-term habituation, requiring the recognition of familiar stimuli and allowing novelty detection, is a fundamental learning and memory process that serves as a gateway to higher order cognition (Rankin 2008; Ramaswami 2014). We and others have endeavored to understand the circuit and molecular basis of OSH and SRP in V1 (Frenkel et al. 2006; McCurry et al. 2010; Gu et al. 2013; Aton et al. 2014; Cooke et al. 2015; Kaplan et al. 2016; Durkin et al. 2017; Kaneko et al. 2017; Clawson et al. 2018) because these tractable phenomena will likely provide deep insight not only into cortical processes of long-term habituation, but also into learning and memory in general.
We previously demonstrated that SRP and OSH are eye-specific (Frenkel et al. 2006; Cooke et al. 2015), implying that the supporting plasticity occurs within the visual pathway prior to binocular integration. Rapid SRP-like effects have been reported in the thalamus of anesthetized mice (Durkin et al. 2017), although direct evidence localizing long-lasting SRP to V1 in awake animals is abundant. For instance, local blockade or genetic knockdown of NMDARs restricted to V1 drastically impairs both SRP and OSH (Cooke et al. 2015). Furthermore, tetanic electrical stimulation of the dorsal lateral geniculate nucleus (dLGN), the primary visual thalamic relay nucleus, induces LTP within L4 of V1 that mimics and occludes SRP. SRP also occludes this LTP, indicating a shared mechanism (Cooke and Bear 2010). These and other lines of evidence converge to suggest that SRP utilizes the mechanisms of LTP at thalamocortical synapses in L4. The finding presented here, demonstrating that a selective knockdown of functional NMDARs in L4 principal cells of V1 does not affect either SRP or OSH (Fig. 3), appears to contradict this working hypothesis. How, then, can we account for these observations?
One possibility is that SRP results from modifications on other cell types in layer 4. Since L4 parvalbumin-positive (PV+) inhibitory neurons receive dense thalamocortical input (Cruikshank et al. 2007; Ji et al. 2016), a simple explanation could be that L4 PV+ neurons are the site of NMDAR-dependent plasticity that supports SRP. Indeed, fast-spiking (putatively PV+) neurons show elevated spiking responses to familiar orientations (Aton et al. 2014), and ablating GluN1 from PV+ neurons in V1 attenuates both SRP and OSH (Kaplan et al. 2016). However, ex vivo recordings of thalamocortical currents onto L4 fast-spiking neurons in V1 have revealed an absence of NMDARs at these synapses (Kloc and Maffei 2014), making the direct thalamic input onto PV+ neurons an unlikely site for NMDAR-dependent synaptic modification. Furthermore, pharmacological isolation of thalamocortical synapses in L4 prevents expression of already established SRP (Cooke and Bear 2014). These observations, together with the results of our present study, suggest that SRP is mediated by cell types outside of L4.
Beyond L4, there are a number of candidate thalamo-recipient cell types that might support SRP. Neurons in L2/3 express NMDAR-dependent, SRP-like plasticity (Kaneko et al. 2017), and show stronger orientation tuning of thalamocortical inputs compared with L4 (Kondo and Ohki 2016). This makes thalamocortical input to superficial layers of V1 an intriguing candidate for mediating orientation-selective plasticity like SRP and OSH. Other compelling candidates are cells in the deeper layers of cortex, where parallel thalamocortical input is well-documented (Frost and Caviness 1980; Bruno and Sakmann 2006; Zarrinpar and Callaway 2006). In particular, L6 corticothalamic (CT) neurons receive presynaptic input from the thalamus (Crandall et al. 2017) and are highly tuned for stimulus orientation (Velez-Fort et al. 2014), making them a strong contender for the alternative cell type involved in SRP and OSH. This hypothesis is well-supported by recent work demonstrating that inactivation of L6 CT neurons can prevent SRP from developing in V1 (Durkin et al. 2017). Interestingly, L6 CT neurons can exert profound influence on L4, a primary site of SRP expression, via PV+ neurons (West et al. 2006; Bortone et al. 2014; Kim et al. 2014). This complements our previous observation that PV+ neurons play a critical role in the expression of SRP and OSH (Kaplan et al. 2016). Through this interpretation, the observation that tetanic electrical stimulation of the dLGN produces an LTP-like effect in L4 that occludes SRP (Cooke and Bear 2010) could be explained by modification of this same parallel thalamocortical disinhibitory circuit. The results of our present study emphasize the necessity for exploring L2/3 and L6 as potential loci for SRP and OSH.
Plasticity Underlying Open-Eye Potentiation Occurs Outside of L4
Our study also demonstrated that open-eye potentiation after MD is intact in adult mice (Fig. 4) lacking NMDARs on L4 principal cells. Like SRP, adult OD plasticity manifests as a potentiated cortical response that is both input-specific and NMDAR-dependent. Despite these similarities, adult OD plasticity and SRP differ in stimulus selectivity and do not occlude one another (Frenkel et al. 2006), indicating a different mechanism or locus. Also, in contrast to SRP, expression of OD plasticity in adult mice is unaffected by manipulations of PV+ inhibitory neurons (Kaplan et al. 2016) and, rather, has been explicitly shown to require NMDARs in principal neurons of V1 (Sawtell et al. 2003). Specifically, adult mice in which GluN1 was ablated from principal neurons in layers 2–4, but spared in deep cortical layers, showed negligible open-eye potentiation after MD (Sawtell et al. 2003). Thus, if loss of GluN1 in L4 principal neurons does not prevent adult OD plasticity (Fig. 4), but loss in principal neurons of L2–4 does (Sawtell et al. 2003), then NMDAR function in L2/L3 must be critical for open-eye potentiation in adult mice. This conclusion is consistent with several prior observations. For instance, NMDA receptor levels are diminished in deep layers across development while being maintained at normal levels in L2/3 (Fox et al. 1989). In addition, in ex vivo slices, Hebbian synaptic potentiation, as modeled by LTP, is not apparent at thalamocortical synapses in L4 after closure of the sensitive period, but persists at L2/3 synapses (Daw et al. 1992; Crair and Malenka 1995; Kirkwood et al. 1995; Daw et al. 2004; Jiang et al. 2007).
Our finding that open-eye potentiation persists in juvenile, sensitive period mice in the absence of NMDA receptors in L4 principal neurons is perhaps more surprising. In juvenile animals, open-eye potentiation is widely regarded as a homeostatic process (Mrsic-Flogel et al. 2007; Kaneko et al. 2008; Toyoizumi et al. 2014) that is mechanistically different from adult OD plasticity (Ranson et al. 2012, 2013). Here, we have observed that homeostatic open-eye potentiation occurs whether deprived-eye depression has already occurred or not. This has several implications. First, it indicates that open-eye potentiation is not dependent on the prior occurrence of deprived-eye depression in juvenile mice. This suggests that the likely driver of MD-mediated homeostasis is the reduction in neural activity arising from deprivation, rather than reduced drive onto neurons resulting from Hebbian synaptic weakening. Another potential implication is that the open-eye potentiation in juvenile animals could arise from synaptic modifications in a population of neurons separate from those undergoing deprived eye depression. Indeed, MD-driven juvenile potentiation has been widely observed in L2/3 (Mrsic-Flogel et al. 2007; Kaneko et al. 2008; Ranson et al. 2012; Spolidoro et al. 2012; Lambo and Turrigiano 2013). However, in vivo whole-cell recordings demonstrating deprived-eye depression and open-eye potentiation co-expressed within individual principal cells in L4 following MD (Iurilli et al. 2013) indicate that juvenile MD-driven potentiation cannot be exclusively attributed to L2/3 or to cells that do not express depression, at least in wildtype animals. Thus, the intact open-eye potentiation we observe in juvenile animals is one of the more difficult observations to reconcile without broadening the scope of alternative hypotheses.
Developmental Compensation and NMDAR-Independent Plasticity
The persistence of three different types of experience-dependent potentiation in our L4-GluN1 knockout animals suggests that the requisite synaptic modification occurs at a different postsynaptic cell type. However, because our genetic strategy led to deletion of NMDARs from birth, an alternative possibility is that developmental compensation may have shifted the locus of NMDAR dependent-plasticity in the mutant mice. For instance, the absence of NMDARs in L4 principal neurons could lead to a compensatory shift in the site of plasticity to another thalamo-recipient cell type. Although we did not see any laminar differences in thalamocortical innervation as assessed by VGluT2 staining in knockout animals (Fig. S2), this does not preclude the possibility of more subtle circuit changes.
Another intriguing possibility is that restriction on NMDAR-dependent plasticity in L4 principal cells might drive a compensatory shift toward NMDAR-independent forms of plasticity. It is well-documented that visual cortical neurons can undergo NMDAR-independent LTP that relies on activation of metabotropic glutamate receptors (mGluRs), particularly in deep cortical layers (Wang and Daw 2003) or under specific pharmacological or visual rearing conditions (Huemmeke et al. 2002; Li et al. 2017). It is possible that mutants lacking NMDAR-dependent LTP in L4 principal cells could shift the mechanisms underlying experience-dependent potentiation to favor mGluR-dependent LTP. Indeed, the idea that the mGluR and NMDAR systems interact during V1 development is supported by observations that mice with impaired mGluR signaling during early postnatal life show impairments in multiple forms of NMDAR-dependent plasticity, including SRP and OD plasticity (Dolen et al. 2007; Sidorov et al. 2015). Arguing against compensation as a basis for resilient plasticity in the absence of L4 NMDARs, however, is our finding that LTD and deprived-eye depression after MD are still impaired in the mutant mice.
L4-NMDAR-Dependent Plasticity and Pathophysiology
The one finding from the current study that met with our expectations was the impairment in deprived-eye depression after MD in juvenile mice lacking L4 NMDARs on excitatory L4 neurons (Figs 5 and 6). It has long been known that deprived-eye depression following MD is prevented by blockade of NMDAR function across multiple species (Kleinschmidt et al. 1987; Bear et al. 1990; Roberts et al. 1998; Sato and Stryker 2008), and that sensitive periods for deprived-eye depression after MD coincide with the availability of LTD at L4 thalamocortical synapses under standard conditions (Dudek and Friedlander 1996; Jiang et al. 2007; Yang et al. 2011). Multiple lines of evidence indicate that deprived-eye depression after MD reflects weakening of thalamocortical synapses in L4 (Heynen et al. 2003; Crozier et al. 2007; Yoon et al. 2009; Khibnik et al. 2010; Yang et al. 2011; Iurilli et al. 2012), and our observation that WM-to-L4 LTD is eliminated in our L4-GluN1 knockouts (Fig. 8) is consistent with these observations.
Some previous studies have demonstrated that pharmacological blockade of NMDARs can reduce evoked responses in V1 (Tsumoto et al. 1987; Miller et al. 1989; Self et al. 2012; Saiepour et al. 2018), including in layer 4 (Fox et al. 1989). This raises the concern that the loss of deprived-eye depression in L4-GluN1 knockout mice may be the result of a reduction in synaptic activation of the cortex, rather than a specific loss of the key molecular mechanisms of Hebbian plasticity. In our L4-GluN1 knockout mice, however, we observed no significant difference from wildtype littermates in the magnitude of electrically-evoked responses ex vivo (Fig. S3) or baseline visually-evoked responses in vivo (Figs 2–6). We also note that broader genetic deletion of NMDARs across L2–4 renders no significant decrement of visually-evoked responses (Sawtell et al. 2003). Further, neither Cre-dependent deletion of GluN1 in V1 pyramidal cells nor global NMDAergic blockade diminishes AMPAergic synaptic transmission or overall activity levels in mouse V1 (Rodriguez et al. 2019). We therefore conclude that the absence of deprived-eye depression in L4-GluN1 knockout mice is unlikely to be the result of a reduced cortical activation, and most likely due to the observed loss of NMDAR-dependent LTD (Fig. 8).
The OD shift following early life MD is accompanied by eye-specific decrements in visual function, mimicking the human visual disability, amblyopia (Dews and Wiesel 1970; von Noorden 1973; Giffin and Mitchell 1978; Murphy and Mitchell 1991; Prusky et al. 2000; Prusky and Douglas 2003; Gingras et al. 2005). We observed that acuity and contrast sensitivity are spared in L4-GluN1 knockout mice following 7–8 days MD (Fig. 7), a duration of deprivation that is sufficient to visually impair wildtype animals through adulthood (Fong et al. 2016). We therefore conclude that functional NMDARs on L4 principal cells are critical in the pathogenesis of deprivation amblyopia in mice. While this outcome may be expected given the absence of deprived-eye depression in our knockout animals, our data provide an important mechanistic link converging on L4 NMDARs.
In summary, the findings described here reveal a selective requirement for NMDARs expressed at L4 thalamocortical synapses in deprivation-dependent plasticity, but not in three other forms of experience-dependent cortical plasticity. These observations provide unique insight into how the brain is modified to meet environmental demands and demonstrate a strategy to dissect subcircuit function within the cerebral cortex.
Funding
This work was supported by the National Eye Institute at the National Institutes of Health (R01-EY023037-05 to M.F.B. and NEI K99-EY029326-01 to M-f.F.), the Picower Institute Innovation Fund (PIIF to M.F.B.), and the Picower Postdoctoral Fellowship from the JPB Foundation (A.T., M-f.F., and P.S.B.F.). S.F.C. is currently supported by research funding from the Wellcome Trust and the Biotechnology and Biological Sciences Research Council.
Notes
We thank Ying (Alyssa) Li, Maia Lee, Madiha Shafquat, Elena Esch, Filia Van Dessel, Julia Deere, Lisandro Martin, Jocelyn Yao, and Feng-Ju (Eddie) Weng for assistance with pilot experiments, data collection, experimental blinding, and histological analyses. We thank Sachiko Murase and Aygul Balcioglu for technical advice. We thank Arnold Heynen, Katherine Marshall, Amanda Coronado, Kiki Chu, Erin Hickey, Victoria Donavan, Nina Palisano, and Jessica Buckey for technical and administrative support. Correspondence can be directed to Samuel Cooke (samuel.cooke@kcl.ac.uk) and Mark Bear (mbear@mit.edu).
Supplementary Material
References
- Antonini A, Stryker MP. 1993. Rapid remodeling of axonal arbors in the visual cortex. Science. 260:1819–1821. [DOI] [PubMed] [Google Scholar]
- Aton SJ, Suresh A, Broussard C, Frank MG. 2014. Sleep promotes cortical response potentiation following visual experience. Sleep. 37:1163–1170. [DOI] [PMC free article] [PubMed] [Google Scholar]
- Bear MF, Kleinschmidt A, Gu QA, Singer W. 1990. Disruption of experience-dependent synaptic modifications in striate cortex by infusion of an NMDA receptor antagonist. J Neurosci. 10:909–925. [DOI] [PMC free article] [PubMed] [Google Scholar]
- Blakemore C, Garey LJ, Vital-Durand F. 1978. The physiological effects of monocular deprivation and their reversal in the monkey's visual cortex. J Physiol. 283:223–262. [DOI] [PMC free article] [PubMed] [Google Scholar]
- Bliss TV, Collingridge GL. 1993. A synaptic model of memory: long-term potentiation in the hippocampus. Nature. 361:31–39. [DOI] [PubMed] [Google Scholar]
- Bortone DS, Olsen SR, Scanziani M. 2014. Translaminar inhibitory cells recruited by layer 6 corticothalamic neurons suppress visual cortex. Neuron. 82:474–485. [DOI] [PMC free article] [PubMed] [Google Scholar]
- Bruno RM, Sakmann B. 2006. Cortex is driven by weak but synchronously active thalamocortical synapses. Science. 312:1622–1627. [DOI] [PubMed] [Google Scholar]
- Buonomano DV, Merzenich MM. 1998. Cortical plasticity: from synapses to maps. Annu Rev Neurosci. 21:149–186. [DOI] [PubMed] [Google Scholar]
- Cho KK, Khibnik L, Philpot BD, Bear MF. 2009. The ratio of NR2A/B NMDA receptor subunits determines the qualities of ocular dominance plasticity in visual cortex. Proc Natl Acad Sci U S A. 106:5377–5382. [DOI] [PMC free article] [PubMed] [Google Scholar]
- Clawson BC, Durkin J, Suresh AK, Pickup EJ, Broussard CG, Aton SJ. 2018. Sleep promotes, and sleep loss inhibits, selective changes in firing rate, response properties and functional connectivity of primary visual cortex neurons. Front Syst Neurosci. 12:40. [DOI] [PMC free article] [PubMed] [Google Scholar]
- Coleman JE, Law K, Bear MF. 2009. Anatomical origins of ocular dominance in mouse primary visual cortex. Neuroscience. 161:561–571. [DOI] [PMC free article] [PubMed] [Google Scholar]
- Coleman JE, Nahmani M, Gavornik JP, Haslinger R, Heynen AJ, Erisir A, Bear MF. 2010. Rapid structural remodeling of thalamocortical synapses parallels experience-dependent functional plasticity in mouse primary visual cortex. J Neurosci. 30:9670–9682. [DOI] [PMC free article] [PubMed] [Google Scholar]
- Cooke SF, Bear MF. 2010. Visual experience induces long-term potentiation in the primary visual cortex. J Neurosci. 30:16304–16313. [DOI] [PMC free article] [PubMed] [Google Scholar]
- Cooke SF, Bear MF. 2014. How the mechanisms of long-term synaptic potentiation and depression serve experience-dependent plasticity in primary visual cortex. Philos Trans R Soc Lond B, Biol Sci. 369:20130284. [DOI] [PMC free article] [PubMed] [Google Scholar]
- Cooke SF, Komorowski RW, Kaplan ES, Gavornik JP, Bear MF. 2015. Visual recognition memory, manifested as long-term habituation, requires synaptic plasticity in V1. Nat Neurosci. 18:262–271. [DOI] [PMC free article] [PubMed] [Google Scholar]
- Crair MC, Malenka RC. 1995. A critical period for long-term potentiation at thalamocortical synapses. Nature. 375:325–328. [DOI] [PubMed] [Google Scholar]
- Crandall SR, Patrick SL, Cruikshank SJ, Connors BW. 2017. Infrabarrels are layer 6 circuit modules in the barrel cortex that link long-range inputs and outputs. Cell Rep. 21:3065–3078. [DOI] [PMC free article] [PubMed] [Google Scholar]
- Crozier RA, Wang Y, Liu CH, Bear MF. 2007. Deprivation-induced synaptic depression by distinct mechanisms in different layers of mouse visual cortex. Proc Natl Acad Sci U S A. 104:1383–1388. [DOI] [PMC free article] [PubMed] [Google Scholar]
- Cruikshank SJ, Lewis TJ, Connors BW. 2007. Synaptic basis for intense thalamocortical activation of feedforward inhibitory cells in neocortex. Nat Neurosci. 10:462–468. [DOI] [PubMed] [Google Scholar]
- Daw N, Rao Y, Wang XF, Fischer Q, Yang Y. 2004. LTP and LTD vary with layer in rodent visual cortex. Vision Res. 44:3377–3380. [DOI] [PubMed] [Google Scholar]
- Daw NW, Fox K, Sato H, Czepita D. 1992. Critical period for monocular deprivation in the cat visual cortex. J Neurophysiol. 67:197–202. [DOI] [PubMed] [Google Scholar]
- Daw NW, Gordon B, Fox KD, Flavin HJ, Kirsch JD, Beaver CJ, Ji Q, Reid SN, Czepita D. 1999. Injection of MK-801 affects ocular dominance shifts more than visual activity. J Neurophysiol. 81:204–215. [DOI] [PubMed] [Google Scholar]
- Dews PB, Wiesel TN. 1970. Consequences of monocular deprivation on visual behaviour in kittens. J Physiol. 206:437–455. [DOI] [PMC free article] [PubMed] [Google Scholar]
- Diamond ME, Armstrong-James M, Ebner FF. 1993. Experience-dependent plasticity in adult rat barrel cortex. Proc Natl Acad Sci U S A. 90:2082–2086. [DOI] [PMC free article] [PubMed] [Google Scholar]
- Dolen G, Osterweil E, Rao BS, Smith GB, Auerbach BD, Chattarji S, Bear MF. 2007. Correction of fragile X syndrome in mice. Neuron. 56:955–962. [DOI] [PMC free article] [PubMed] [Google Scholar]
- Douglas RJ, Martin KA. 2004. Neuronal circuits of the neocortex. Annu Rev Neurosci. 27:419–451. [DOI] [PubMed] [Google Scholar]
- Drager UC. 1975. Receptive fields of single cells and topography in mouse visual cortex. J Comp Neurol. 160:269–290. [DOI] [PubMed] [Google Scholar]
- Drager UC. 1978. Observations on monocular deprivation in mice. J Neurophysiol. 41:28–42. [DOI] [PubMed] [Google Scholar]
- Dudek SM, Bear MF. 1992. Homosynaptic long-term depression in area CA1 of hippocampus and effects of N-methyl-D-aspartate receptor blockade. Proc Natl Acad Sci U S A. 89:4363–4367. [DOI] [PMC free article] [PubMed] [Google Scholar]
- Dudek SM, Friedlander MJ. 1996. Developmental down-regulation of LTD in cortical layer IV and its independence of modulation by inhibition. Neuron. 16:1097–1106. [DOI] [PubMed] [Google Scholar]
- Durkin J, Suresh AK, Colbath J, Broussard C, Wu J, Zochowski M, Aton SJ. 2017. Cortically coordinated NREM thalamocortical oscillations play an essential, instructive role in visual system plasticity. Proc Natl Acad Sci U S A. 114:10485–10490. [DOI] [PMC free article] [PubMed] [Google Scholar]
- Engineer ND, Riley JR, Seale JD, Vrana WA, Shetake JA, Sudanagunta SP, Borland MS, Kilgard MP. 2011. Reversing pathological neural activity using targeted plasticity. Nature. 470:101–104. [DOI] [PMC free article] [PubMed] [Google Scholar]
- Feldman DE. 2009. Synaptic mechanisms for plasticity in neocortex. Annu Rev Neurosci. 32:33–55. [DOI] [PMC free article] [PubMed] [Google Scholar]
- Flor H, Elbert T, Knecht S, Wienbruch C, Pantev C, Birbaumer N, Larbig W, Taub E. 1995. Phantom-limb pain as a perceptual correlate of cortical reorganization following arm amputation. Nature. 375:482–484. [DOI] [PubMed] [Google Scholar]
- Fong MF, Mitchell DE, Duffy KR, Bear MF. 2016. Rapid recovery from the effects of early monocular deprivation is enabled by temporary inactivation of the retinas. Proc Natl Acad Sci U S A. 113:14139–14144. [DOI] [PMC free article] [PubMed] [Google Scholar]
- Fox K, Sato H, Daw N. 1989. The location and function of NMDA receptors in cat and kitten visual cortex. J Neurosci. 9:2443–2454. [DOI] [PMC free article] [PubMed] [Google Scholar]
- Frenkel MY, Bear MF. 2004. How monocular deprivation shifts ocular dominance in visual cortex of young mice. Neuron. 44:917–923. [DOI] [PubMed] [Google Scholar]
- Frenkel MY, Sawtell NB, Diogo AC, Yoon B, Neve RL, Bear MF. 2006. Instructive effect of visual experience in mouse visual cortex. Neuron. 51:339–349. [DOI] [PubMed] [Google Scholar]
- Frost DO, Caviness VS Jr. 1980. Radial organization of thalamic projections to the neocortex in the mouse. J Comp Neurol. 194:369–393. [DOI] [PubMed] [Google Scholar]
- Fuster JM. 1995. Memory in the cerebral cortex. Cambridge (MA): MIT Press. [Google Scholar]
- Gandhi SP, Yanagawa Y, Stryker MP. 2008. Delayed plasticity of inhibitory neurons in developing visual cortex. Proc Natl Acad Sci U S A. 105:16797–16802. [DOI] [PMC free article] [PubMed] [Google Scholar]
- Giffin F, Mitchell DE. 1978. The rate of recovery of vision after early monocular deprivation in kittens. J Physiol. 274:511–537. [DOI] [PMC free article] [PubMed] [Google Scholar]
- Gingras G, Mitchell DE, Hess RF. 2005. The spatial localization deficit in visually deprived kittens. Vision Res. 45:975–989. [DOI] [PubMed] [Google Scholar]
- Goldstone RL. 1998. Perceptual learning. Ann Rev Psychol. 49:585–612. [DOI] [PubMed] [Google Scholar]
- Gordon JA, Stryker MP. 1996. Experience-dependent plasticity of binocular responses in the primary visual cortex of the mouse. J Neurosci. 16:3274–3286. [DOI] [PMC free article] [PubMed] [Google Scholar]
- Gu Y, Huang S, Chang MC, Worley P, Kirkwood A, Quinlan EM. 2013. Obligatory role for the immediate early gene NARP in critical period plasticity. Neuron. 79:335–346. [DOI] [PMC free article] [PubMed] [Google Scholar]
- Hebb DO. 1949. The organization of behavior. New York: Wiley. [Google Scholar]
- Heynen AJ, Yoon BJ, Liu CH, Chung HJ, Huganir RL, Bear MF. 2003. Molecular mechanism for loss of visual cortical responsiveness following brief monocular deprivation. Nat Neurosci. 6:854–862. [DOI] [PubMed] [Google Scholar]
- Hofer SB, Mrsic-Flogel TD, Bonhoeffer T, Hubener M. 2006. Prior experience enhances plasticity in adult visual cortex. Nat Neurosci. 9:127–132. [DOI] [PubMed] [Google Scholar]
- Huemmeke M, Eysel UT, Mittmann T. 2002. Metabotropic glutamate receptors mediate expression of LTP in slices of rat visual cortex. Eur J Neurosci. 15:1641–1645. [DOI] [PubMed] [Google Scholar]
- Iurilli G, Benfenati F, Medini P. 2012. Loss of visually driven synaptic responses in layer 4 regular-spiking neurons of rat visual cortex in absence of competing inputs. Cereb Cortex. 22:2171–2181. [DOI] [PubMed] [Google Scholar]
- Iurilli G, Olcese U, Medini P. 2013. Preserved excitatory-inhibitory balance of cortical synaptic inputs following deprived eye stimulation after a saturating period of monocular deprivation in rats. PLoS One. 8:e82044. [DOI] [PMC free article] [PubMed] [Google Scholar]
- Ji XY, Zingg B, Mesik L, Xiao Z, Zhang LI, Tao HW. 2016. Thalamocortical innervation pattern in mouse auditory and visual cortex: laminar and cell-type specificity. Cereb Cortex. 26:2612–2625. [DOI] [PMC free article] [PubMed] [Google Scholar]
- Jiang B, Trevino M, Kirkwood A. 2007. Sequential development of long-term potentiation and depression in different layers of the mouse visual cortex. J Neurosci. 27:9648–9652. [DOI] [PMC free article] [PubMed] [Google Scholar]
- Kaneko M, Fu Y, Stryker MP. 2017. Locomotion induces stimulus-specific response enhancement in adult visual cortex. J Neurosci. 37:3532–3543. [DOI] [PMC free article] [PubMed] [Google Scholar]
- Kaneko M, Stellwagen D, Malenka RC, Stryker MP. 2008. Tumor necrosis factor-alpha mediates one component of competitive, experience-dependent plasticity in developing visual cortex. Neuron. 58:673–680. [DOI] [PMC free article] [PubMed] [Google Scholar]
- Kang E, Durand S, LeBlanc JJ, Hensch TK, Chen C, Fagiolini M. 2013. Visual acuity development and plasticity in the absence of sensory experience. J Neurosci. 33:17789–17796. [DOI] [PMC free article] [PubMed] [Google Scholar]
- Kaplan ES, Cooke SF, Komorowski RW, Chubykin AA, Thomazeau A, Khibnik LA, Gavornik JP, Bear MF. 2016. Contrasting roles for parvalbumin-expressing inhibitory neurons in two forms of adult visual cortical plasticity. eLife. 5: e11450. [DOI] [PMC free article] [PubMed] [Google Scholar]
- Khibnik LA, Cho KK, Bear MF. 2010. Relative contribution of feedforward excitatory connections to expression of ocular dominance plasticity in layer 4 of visual cortex. Neuron. 66:493–500. [DOI] [PMC free article] [PubMed] [Google Scholar]
- Kim J, Matney CJ, Blankenship A, Hestrin S, Brown SP. 2014. Layer 6 corticothalamic neurons activate a cortical output layer, layer 5a. J Neurosci. 34:9656–9664. [DOI] [PMC free article] [PubMed] [Google Scholar]
- Kirkwood A, Bear MF. 1995. Elementary forms of synaptic plasticity in the visual cortex. Biol Res. 28:73–80. [PubMed] [Google Scholar]
- Kirkwood A, Lee HK, Bear MF. 1995. Co-regulation of long-term potentiation and experience-dependent synaptic plasticity in visual cortex by age and experience. Nature. 375:328–331. [DOI] [PubMed] [Google Scholar]
- Kleinschmidt A, Bear MF, Singer W. 1987. Blockade of "NMDA" receptors disrupts experience-dependent plasticity of kitten striate cortex. Science. 238:355–358. [DOI] [PubMed] [Google Scholar]
- Kloc M, Maffei A. 2014. Target-specific properties of thalamocortical synapses onto layer 4 of mouse primary visual cortex. J Neurosci. 34:15455–15465. [DOI] [PMC free article] [PubMed] [Google Scholar]
- Kondo S, Ohki K. 2016. Laminar differences in the orientation selectivity of geniculate afferents in mouse primary visual cortex. Nat Neurosci. 19:316–319. [DOI] [PubMed] [Google Scholar]
- Lambo ME, Turrigiano GG. 2013. Synaptic and intrinsic homeostatic mechanisms cooperate to increase L2/3 pyramidal neuron excitability during a late phase of critical period plasticity. J Neurosci. 33:8810–8819. [DOI] [PMC free article] [PubMed] [Google Scholar]
- Lashley KS. 1931. Mass action in cerebral function. Science. 73:245–254. [DOI] [PubMed] [Google Scholar]
- Letzkus JJ, Wolff SB, Meyer EM, Tovote P, Courtin J, Herry C, Luthi A. 2011. A disinhibitory microcircuit for associative fear learning in the auditory cortex. Nature. 480:331–335. [DOI] [PubMed] [Google Scholar]
- Li S, Wang L, Tie X, Sohya K, Lin X, Kirkwood A, Jiang B. 2017. Brief novel visual experience fundamentally changes synaptic plasticity in the mouse visual cortex. J Neurosci. 37:9353–9360. [DOI] [PMC free article] [PubMed] [Google Scholar]
- Madisen L, Zwingman TA, Sunkin SM, Oh SW, Zariwala HA, Gu H, Ng LL, Palmiter RD, Hawrylycz MJ, Jones AR et al. 2010. A robust and high-throughput Cre reporting and characterization system for the whole mouse brain. Nat Neurosci. 13:133–140. [DOI] [PMC free article] [PubMed] [Google Scholar]
- McCurry CL, Shepherd JD, Tropea D, Wang KH, Bear MF, Sur M. 2010. Loss of arc renders the visual cortex impervious to the effects of sensory experience or deprivation. Nat Neurosci. 13:450–457. [DOI] [PMC free article] [PubMed] [Google Scholar]
- McHugh TJ, Jones MW, Quinn JJ, Balthasar N, Coppari R, Elmquist JK, Lowell BB, Fanselow MS, Wilson MA, Tonegawa S. 2007. Dentate gyrus NMDA receptors mediate rapid pattern separation in the hippocampal network. Science. 317:94–99. [DOI] [PubMed] [Google Scholar]
- McHugh TJ, Tonegawa S. 2009. CA3 NMDA receptors are required for the rapid formation of a salient contextual representation. Hippocampus. 19:1153–1158. [DOI] [PMC free article] [PubMed] [Google Scholar]
- Miller KD, Chapman B, Stryker MP. 1989. Visual responses in adult cat visual cortex depend on N-methyl-D-aspartate receptors. Proc Natl Acad Sci U S A. 86:5183–5187. [DOI] [PMC free article] [PubMed] [Google Scholar]
- Mioche L, Singer W. 1989. Chronic recordings from single sites of kitten striate cortex during experience-dependent modifications of receptive-field properties. J Neurophysiol. 62:185–197. [DOI] [PubMed] [Google Scholar]
- Mitchell DE. 1991. The long-term effectiveness of different regimens of occlusion on recovery from early monocular deprivation in kittens. Philos Trans Roy Soc Lond B, Biol Sci. 333:51–79. [DOI] [PubMed] [Google Scholar]
- Mitzdorf U. 1985. Current source-density method and application in cat cerebral cortex: investigation of evoked potentials and EEG phenomena. Physiol Rev. 65:37–100. [DOI] [PubMed] [Google Scholar]
- Mrsic-Flogel TD, Hofer SB, Ohki K, Reid RC, Bonhoeffer T, Hubener M. 2007. Homeostatic regulation of eye-specific responses in visual cortex during ocular dominance plasticity. Neuron. 54:961–972. [DOI] [PubMed] [Google Scholar]
- Muhlnickel W, Elbert T, Taub E, Flor H. 1998. Reorganization of auditory cortex in tinnitus. Proc Natl Acad Sci U S A. 95:10340–10343. [DOI] [PMC free article] [PubMed] [Google Scholar]
- Murphy KM, Mitchell DE. 1991. Vernier acuity of normal and visually deprived cats. Vision Res. 31:253–266. [DOI] [PubMed] [Google Scholar]
- Nowak L, Bregestovski P, Ascher P, Herbet A, Prochiantz A. 1984. Magnesium gates glutamate-activated channels in mouse central neurones. Nature. 307:462–465. [DOI] [PubMed] [Google Scholar]
- Pham TA, Graham SJ, Suzuki S, Barco A, Kandel ER, Gordon B, Lickey ME. 2004. A semi-persistent adult ocular dominance plasticity in visual cortex is stabilized by activated CREB. Learn Mem. 11:738–747. [DOI] [PMC free article] [PubMed] [Google Scholar]
- Porciatti V, Pizzorusso T, Maffei L. 1999. The visual physiology of the wild type mouse determined with pattern VEPs. Vision Res. 39:3071–3081. [DOI] [PubMed] [Google Scholar]
- Prusky GT, Douglas RM. 2003. Developmental plasticity of mouse visual acuity. Eur J Neurosci. 17:167–173. [DOI] [PubMed] [Google Scholar]
- Prusky GT, West PW, Douglas RM. 2000. Experience-dependent plasticity of visual acuity in rats. Eur J Neurosci. 12:3781–3786. [DOI] [PubMed] [Google Scholar]
- Ramachandran VS. 2005. Plasticity and functional recovery in neurology. Clin Med (Lond). 5:368–373. [DOI] [PMC free article] [PubMed] [Google Scholar]
- Ramaswami M. 2014. Network plasticity in adaptive filtering and behavioral habituation. Neuron. 82:1216–1229. [DOI] [PubMed] [Google Scholar]
- Rankin C. 2008. Habituation: the foundation of learning and attention, international workshop on habituation, Vancouver, August 15-18, 2007. J Neurogenet. 22:15–16. [DOI] [PubMed] [Google Scholar]
- Ranson A, Cheetham CE, Fox K, Sengpiel F. 2012. Homeostatic plasticity mechanisms are required for juvenile, but not adult, ocular dominance plasticity. Proc Natl Acad Sci U S A. 109:1311–1316. [DOI] [PMC free article] [PubMed] [Google Scholar]
- Ranson A, Sengpiel F, Fox K. 2013. The role of GluA1 in ocular dominance plasticity in the mouse visual cortex. J Neurosci. 33:15220–15225. [DOI] [PMC free article] [PubMed] [Google Scholar]
- Roberts EB, Meredith MA, Ramoa AS. 1998. Suppression of NMDA receptor function using antisense DNA block ocular dominance plasticity while preserving visual responses. J Neurophysiol. 80:1021–1032. [DOI] [PubMed] [Google Scholar]
- Rodriguez G, Mesik L, Gao M, Parkins S, Saha R, Lee HK. 2019. Disruption of NMDA receptor function prevents normal experience-dependent homeostatic synaptic plasticity in mouse primary visual cortex. J Neurosci. 39(39): 7664–7673. [DOI] [PMC free article] [PubMed] [Google Scholar]
- Saiepour MH, Min R, Kamphuis W, Heimel JA, Levelt CN. 2018. Beta-catenin in the adult visual cortex regulates NMDA-receptor function and visual responses. Cereb Cortex. 28:1183–1194. [DOI] [PubMed] [Google Scholar]
- Salinas KJ, Figueroa Velez DX, Zeitoun JH, Kim H, Gandhi SP. 2017. Contralateral bias of high spatial frequency tuning and cardinal direction selectivity in mouse visual cortex. J Neurosci. 37:10125–10138. [DOI] [PMC free article] [PubMed] [Google Scholar]
- Sato M, Stryker MP. 2008. Distinctive features of adult ocular dominance plasticity. J Neurosci. 28:10278–10286. [DOI] [PMC free article] [PubMed] [Google Scholar]
- Sawtell NB, Frenkel MY, Philpot BD, Nakazawa K, Tonegawa S, Bear MF. 2003. NMDA receptor-dependent ocular dominance plasticity in adult visual cortex. Neuron. 38:977–985. [DOI] [PubMed] [Google Scholar]
- Self MW, Kooijmans RN, Super H, Lamme VA, Roelfsema PR. 2012. Different glutamate receptors convey feedforward and recurrent processing in macaque V1. Proc Natl Acad Sci U S A. 109:11031–11036. [DOI] [PMC free article] [PubMed] [Google Scholar]
- Sidorov MS, Kaplan ES, Osterweil EK, Lindemann L, Bear MF. 2015. Metabotropic glutamate receptor signaling is required for NMDA receptor-dependent ocular dominance plasticity and LTD in visual cortex. Proc Natl Acad Sci U S A. 112:12852–12857. [DOI] [PMC free article] [PubMed] [Google Scholar]
- Spolidoro M, Putignano E, Munafo C, Maffei L, Pizzorusso T. 2012. Inhibition of matrix metalloproteinases prevents the potentiation of nondeprived-eye responses after monocular deprivation in juvenile rats. Cereb Cortex. 22:725–734. [DOI] [PubMed] [Google Scholar]
- Stephany CE, Chan LL, Parivash SN, Dorton HM, Piechowicz M, Qiu S, McGee AW. 2014. Plasticity of binocularity and visual acuity are differentially limited by nogo receptor. J Neurosci. 34:11631–11640. [DOI] [PMC free article] [PubMed] [Google Scholar]
- Stephany CE, Ma X, Dorton HM, Wu J, Solomon AM, Frantz MG, Qiu S, McGee AW. 2018. Distinct circuits for recovery of eye dominance and acuity in murine amblyopia. Curr Biol. 28(1914–1923):e1915. [DOI] [PMC free article] [PubMed] [Google Scholar]
- Tagawa Y, Kanold PO, Majdan M, Shatz CJ. 2005. Multiple periods of functional ocular dominance plasticity in mouse visual cortex. Nat Neurosci. 8:380–388. [DOI] [PubMed] [Google Scholar]
- Toyoizumi T, Kaneko M, Stryker MP, Miller KD. 2014. Modeling the dynamic interaction of Hebbian and homeostatic plasticity. Neuron. 84:497–510. [DOI] [PMC free article] [PubMed] [Google Scholar]
- Tsien JZ, Chen DF, Gerber D, Tom C, Mercer EH, Anderson DJ, Mayford M, Kandel ER, Tonegawa S. 1996a. Subregion- and cell type-restricted gene knockout in mouse brain. Cell. 87:1317–1326. [DOI] [PubMed] [Google Scholar]
- Tsien JZ, Huerta PT, Tonegawa S. 1996b. The essential role of hippocampal CA1 NMDA receptor-dependent synaptic plasticity in spatial memory. Cell. 87:1327–1338. [DOI] [PubMed] [Google Scholar]
- Tsumoto T, Hagihara K, Sato H, Hata Y. 1987. NMDA receptors in the visual cortex of young kittens are more effective than those of adult cats. Nature. 327:513–514. [DOI] [PubMed] [Google Scholar]
- Velez-Fort M, Rousseau CV, Niedworok CJ, Wickersham IR, Rancz EA, Brown APY, Strom M, Margrie TW. 2014. The stimulus selectivity and connectivity of layer six principal cells reveals cortical microcircuits underlying visual processing. Neuron. 84:238. [DOI] [PMC free article] [PubMed] [Google Scholar]
- von Noorden GK. 1973. Histological studies of the visual system in monkeys with experimental amblyopia. Invest Ophthalmol. 12:727–738. [PubMed] [Google Scholar]
- Wang XF, Daw NW. 2003. Long term potentiation varies with layer in rat visual cortex. Brain Res. 989:26–34. [DOI] [PubMed] [Google Scholar]
- Webber AL, Wood J. 2005. Amblyopia: prevalence, natural history, functional effects and treatment. Clin Exp Optom. 88:365–375. [DOI] [PubMed] [Google Scholar]
- West DC, Mercer A, Kirchhecker S, Morris OT, Thomson AM. 2006. Layer 6 cortico-thalamic pyramidal cells preferentially innervate interneurons and generate facilitating EPSPs. Cereb Cortex. 16:200–211. [DOI] [PubMed] [Google Scholar]
- Wiesel TN, Hubel DH. 1963. Single-cell responses in striate cortex of kittens deprived of vision in one eye. J Neurophysiol. 26:1003–1017. [DOI] [PubMed] [Google Scholar]
- Xerri C, Merzenich MM, Jenkins W, Santucci S. 1999. Representational plasticity in cortical area 3b paralleling tactual-motor skill acquisition in adult monkeys. Cereb Cortex. 9:264–276. [DOI] [PubMed] [Google Scholar]
- Yang K, Xiong W, Yang G, Kojic L, Wang YT, Cynader M. 2011. The regulatory role of long-term depression in juvenile and adult mouse ocular dominance plasticity. Sci Rep. 1:203. [DOI] [PMC free article] [PubMed] [Google Scholar]
- Yoon BJ, Smith GB, Heynen AJ, Neve RL, Bear MF. 2009. Essential role for a long-term depression mechanism in ocular dominance plasticity. Proc Natl Acad Sci U S A. 106:9860–9865. [DOI] [PMC free article] [PubMed] [Google Scholar]
- Zarrinpar A, Callaway EM. 2006. Local connections to specific types of layer 6 neurons in the rat visual cortex. J Neurophysiol. 95:1751–1761. [DOI] [PubMed] [Google Scholar]
- Paxinos G, Franklin KBJ. 2019. The mouse brain in stereotaxic coordinates. 4th ed. Amsterdam/Boston, Academic Press, 2013. [Google Scholar]
Associated Data
This section collects any data citations, data availability statements, or supplementary materials included in this article.