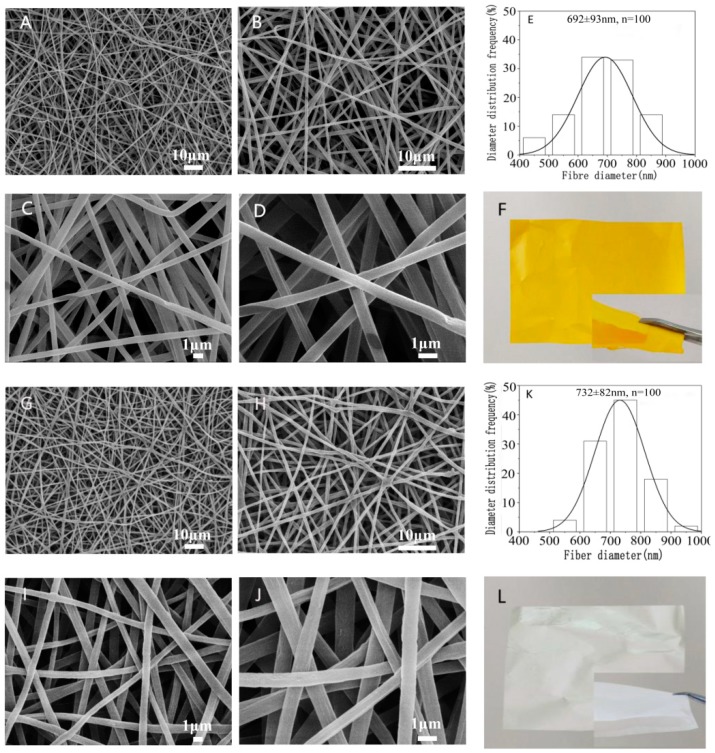
Figure 2.
Morphology and diameter distribution of nanofiber membranes with/without emodin. Representative SEM images of emodin-loaded nanofibers (A–D observed at 1000×, 2000×, 5000×, and 10,000×, respectively); control nanofibers without emodin (G–J observed at 1000×, 2000×, 5000×, and 10,000×, respectively); diameter distribution histogram of emodin-loaded nanofibers (E) and control nanofibers without emodin (K); photographs of emodin-loaded nanofibers (F) and control nanofibers without emodin (L).

