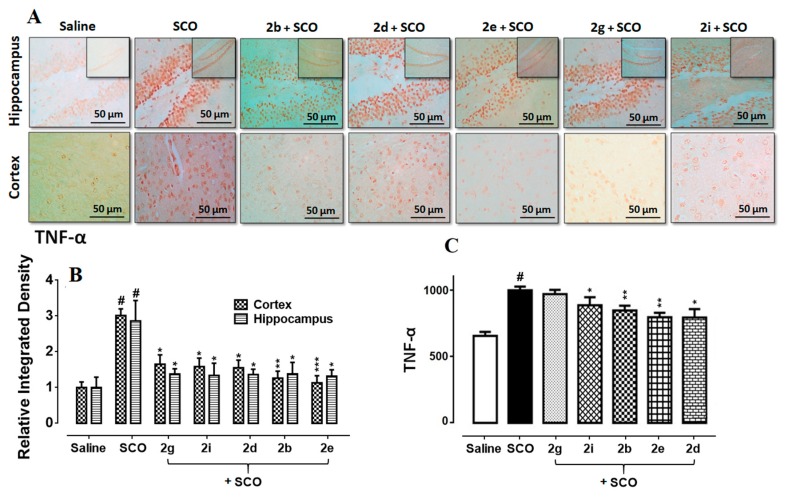
Figure 7.
(A,B) Immunohistochemistry results for TNF-α in the cortex and hippocampus (dentate gyrus, dg). Bar 50 µm, magnification 40× (n = 5). Histograms show a comparatively higher expression of TNF-α in the scopolamine group. ***, ** and * show p < 0.001, p < 0.01 and p < 0.05, respectively, and illustrate significant variation relative to scopolamine, while ### p < 0.001 shows significant variation relative to saline control group. Results are expressed as mean±SEM. (C) The protein expression of TNF-α quantified through ELISA. The data is presented as mean ± SEM. # p < 0.05 relative to saline control group, while * p < 0.05 and ** p < 0.01 relative to scopolamine (n = 5).

