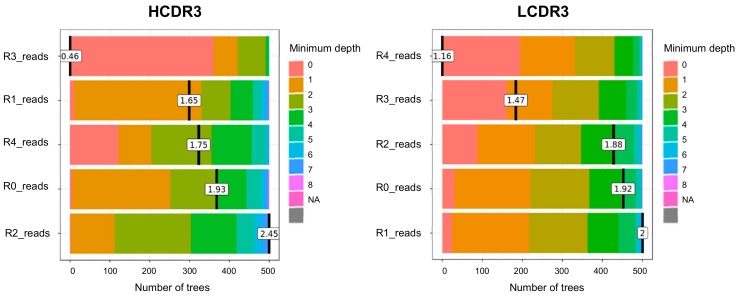
Figure 2.
Distribution of the minimum depth of predictor variables (clonal abundance at round 0–4 of bio-panning) from individual decision trees in the RF prediction model for CDR3 clonotypes. Minimum depth value is colored according to its depth and mean value is calculated and displayed at points.

