

Summary
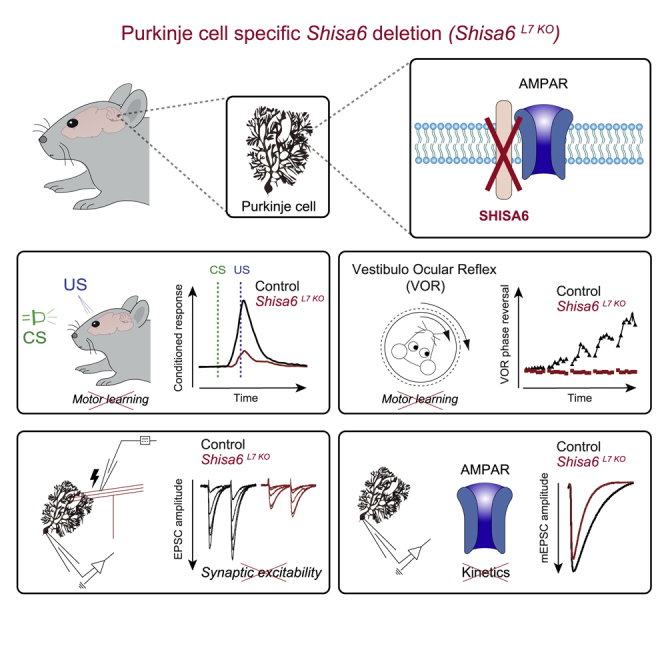
The majority of excitatory postsynaptic currents in the brain are gated through AMPA-type glutamate receptors, the kinetics and trafficking of which can be modulated by auxiliary proteins. It remains to be elucidated whether and how auxiliary proteins can modulate synaptic function to contribute to procedural memory formation. In this study, we report that the AMPA-type glutamate receptor (AMPAR) auxiliary protein SHISA6 (CKAMP52) is expressed in cerebellar Purkinje cells, where it co-localizes with GluA2-containing AMPARs. The absence of SHISA6 in Purkinje cells results in severe impairments in the adaptation of the vestibulo-ocular reflex and eyeblink conditioning. The physiological abnormalities include decreased presence of AMPARs in synaptosomes, impaired excitatory transmission, increased deactivation of AMPA receptors, and reduced induction of long-term potentiation at Purkinje cell synapses. Our data indicate that Purkinje cells require SHISA6-dependent modification of AMPAR function in order to facilitate cerebellar, procedural memory formation.
Keywords: auxiliary subunit, procedural memory, AMPAR kinetics, synapse, long-term depression, cerebellum
Graphical Abstract
Highlights
-
•
SHISA6 is prominently expressed in Purkinje cells in close association with AMPARs
-
•
SHISA6 absence in Purkinje cells results in impaired procedural memory formation
-
•
Purkinje cell synaptic baseline excitatory transmission is facilitated by SHISA6
-
•
Purkinje cell AMPAR kinetics are modulated by SHISA6
Peter et al. show that the SHISA6 protein modulates the synaptic function of Purkinje cells in mice. In the absence of SHISA6, memory formation during classical eyeblink conditioning and eye movement adaptations is severely impaired as a result of a major synaptic excitability phenotype in Purkinje cells.
Introduction
The α-amino-3-hydroxy-5-methyl-4-isoxazolepropionic acid glutamate receptors (AMPARs) are one of the main drivers of excitatory postsynaptic currents (EPSCs). Different families of auxiliary proteins have been shown to modulate trafficking, membrane mobility, and gating properties of AMPARs, each of which may shape cell- and/or brain-region-specific types of synaptic transmission and plasticity crucial for behavior (Greger et al., 2017). Previous work has shown that auxiliary subunit members from the SHISA family of proteins are differentially expressed in the brain and can affect the mobility (SHISA6) and gating properties of AMPARs (SHISA6, SHISA7, and SHISA9), such as receptor deactivation and desensitization (Pei and Grishin, 2012, Huettner, 2017, Greger et al., 2017, Klaassen et al., 2016, Farrow et al., 2015, von Engelhardt et al., 2010, Schmitz et al., 2017, Chen et al., 2018). However, despite evidence for brain-circuit-specific expression of SHISA members, the focus has so far been on global knockout (KO) mouse models, which hampers the investigation and interpretation of brain-region-specific physiological and behavioral relevance.
In the current study, we investigated cellular and systems functions of the SHISA6 family member in the cerebellum, a brain area known to be crucial for the formation of procedural memories that can be studied in well-defined behavioral paradigms, such as the adaptation of the vestibulo-ocular reflex (VOR) and Pavlovian eyeblink conditioning (Gao et al., 2012). Cell-specific promoters allow genetic manipulations, which have provided important insights into the cellular mechanisms of motor learning in the cerebellum. For example, experiments using the granule-cell-specific GABAA-receptor subunit α6 promoter (Galliano et al., 2013) or the Purkinje-cell (PC)-specific L7 promoter (Schonewille et al., 2010, Gutierrez-Castellanos et al., 2017) have confirmed that baseline parallel fiber (PF) to PC synaptic physiology is essential for cerebellum-dependent motor learning. To date, these studies have elucidated that AMPAR-dependent long-term potentiation (LTP) and depression (LTD) of postsynaptic currents (PSCs) can play differential roles in different forms of memory formation (Schonewille et al., 2010, Peter et al., 2016, Gutierrez-Castellanos et al., 2017, Takamiya et al., 2008, Suvrathan and Raymond, 2018, Suvrathan et al., 2016). Even though it is becoming evident that the synaptic modification of PF to PC AMPAR number and conductance are important mechanisms for the facilitation of procedural memories in the cerebellum, it is unclear whether these AMPAR modifications require members of the SHISA family of transmembrane auxiliary proteins.
We find that deletion of the Shisa6 gene in a PC-specific KO model results in severely impaired motor learning, in that both VOR adaptation and eyeblink conditioning are affected. We show that SHISA6 is prominently expressed by PCs where it interacts with AMPARs and PDZ-containing proteins in the synapse. The absence of SHISA6 results in the downregulation of AMPAR subunit levels while not affecting synapse number. The PC-specific ablation of SHISA6 drastically affects the function of the PF to PC synapse, in that they have increased deactivation of AMPAR-mediated EPSCs, highly reduced PF to PC excitatory transmission, and impaired LTP. Moreover, PCs that lack SHISA6 show significantly reduced simple spike (SiSp) firing. Taken together, our data highlight a critical role for the SHISA6 protein in the facilitation of AMPAR-mediated PSCs in PCs, which is essential for the formation of procedural memories in the cerebellar cortex.
Results
Shisa6L7 KO Mice Show Impaired Motor Learning
In order to assess procedural learning phenotypes in a cerebellum-specific PC Shisa6 KO (Shisa6L7 KO) mouse model, we screened different learning behaviors that are typically controlled by either zebrin-positive (i.e., VOR adaptation) or zebrin-negative zones (i.e., eyeblink conditioning) in the cerebellum (De Zeeuw and Ten Brinke, 2015). The impact of SHISA6 on cerebellum-dependent eye movement adaptation was assessed by subjecting the Shisa6L7 KO and control mice to visuo-vestibular mismatch training (Figures 1A–1C). Mice were subjected to six training sessions with mismatched out-of-phase visual and vestibular stimulation, with the goal of increasing the gain of the VOR in the dark (Figure 1A). Whereas control mice were able to increase their VOR gain, mice that lacked SHISA6 were not, resulting in a statistical difference (Figure 1A, left; p = 0.031). To examine this further, a more sensitive training protocol was applied (Figure 1C), which includes a 5-day training paradigm that aims to decrease the gain and then to reverse the phase (i.e., direction) of the VOR. During such training, the visual stimulus rotates in phase with the vestibular stimulus on all days. On the first day, both stimuli rotate at a 5° amplitude, effectively causing a decrease of VOR gain, while on the next four training days, the visual stimulus amplitude increases first to 7.5° (day 2) and subsequently to 10° (days 3–5) while the vestibular stimulus remains the same; this approach allows for a gradual reversal of VOR phase. Analysis of the first day showed that Shisa6L7 KO mice have impaired VOR gain-decrease learning (Figure 1C, left; p = 0.024), a sign of severe motor learning impairment (Schonewille et al., 2010, Hansel et al., 2006). Indeed, whereas control mice demonstrated the ability to reverse the phase of their VOR, Shisa6L7 KO mice did not (Figure 1C, right; p < 0.001). In addition to the VOR gain decrease and phase reversal phenotypes, an optokinetic reflex (OKR) gain-increase phenotype was revealed when the OKR gain measurement was repeated following the VOR phase reversal training paradigm (Figure 1B, right; p < 0.001) (shaded baseline is data from Figure S1C, left).
Figure 1.

Mice Lacking SHISA6 in PCs Show Impaired Motor Learning
(A) Out-of-phase visual and vestibular stimulation aimed at increasing the VOR gain. VOR gain increase was impaired in Shisa6L7 KO mice.
(B) Re-recording of OKR gain (compare to transparent inset of baseline OKR gain data, Figure S1C) following the VOR phase reversal training (see C) shows severe impairments for OKR gain increase in Shisa6L7 KO mice.
(C) The ability of mice to reverse the direction of their VOR was tested by training the mice and testing them in the dark. The Shisa6L7 KO mice showed severe impairments in VOR phase reversal adaptation, evidenced by a lack of VOR gain and phase changes over days, whereas control mice showed a reduction in VOR gain and an increase in phase (control, 7 mice; Shisa6L7 KO, 6 mice).
(D) Experimental setup for the eyeblink conditioning where an LED light was used as the conditioned stimulus (CS) and a corneal air puff as the unconditioned stimulus (US). Post-training testing was done using only the CS. Right panels: the eyelid responses for all individual trials.
(E) The average CR amplitude (threshold: eyelid movement at least 10% of a full blink) for eyelid movements in the 500 ms centered on the US was significantly lower in the Shisa6L7 KO mice compared to the controls (control, 16 mice; Shisa6L7 KO, 16 mice).
(F) The percentage of CR responses over sessions. The Shisa6L7 KO mice showed significantly fewer responses than the controls over time, indicative of impaired learning (control, 16 mice; Shisa6L7 KO, 16 mice).
Data are represented as mean ± SEM; ∗p < 0.05, ∗∗p < 0.01.
We next subjected the mice to a Pavlovian eyeblink conditioning paradigm using a light pulse as a conditioning stimulus (CS) and a corneal air puff as an unconditioned stimulus (US) (ten Brinke et al., 2015: Figure 1D). Shisa6L7 KO mice had both a significantly lower conditioned response (CR) amplitude and a significantly lower percentage of successful CRs (Figure 1E; CR amplitude, p = 0.006; Figure 1F; CR percentage, p = 0.004). Together, the compensatory eye movement and eyeblink conditioning paradigms indicate that SHISA6 expression in PCs is essential for cerebellum-dependent motor learning.
Considering the severe impact on motor learning, we assessed additional cerebellum-dependent motor behaviors in the Shisa6L7 KO mice. Baseline motor performance, as tested on a rotarod, revealed that Shisa6L7 KO mice fall earlier from the rotating wheel (Figure S1A, left; days 1–4, 40 rpm, p = 0.044; day 5, 80 rpm, p = 0.008). This was not due to altered grip force because this parameter was unaffected in a grip test (Figure S1A, right; p = 0.28). The balance beam assay, used to evaluate gross movement coordination on a small diameter rod, revealed no significant impairment in the Shisa6L7 KO (Figure S1B, left; 6-mm rod, p = 0.34; 12-mm rod, p = 0.22). However, when we evaluated the walking patterns on the pressure-sensitive rungs of the ErasmusLadder, we observed a significantly increased number of missteps in the Shisa6L7 KO (Figure S1B, right; p = 0.004), indicating impaired motor coordination (Vinueza Veloz et al., 2015).
Next, we analyzed baseline compensatory eye movements, commonly used to assess the cerebellar contribution to motor performance (Gonshor and Jones, 1976, Galliano et al., 2013). Examination of the OKR indicated that both its amplitude (Figure S1C, left; p = 0.008) and phase (Figure S1C, right; p = 0.033) with respect to those of the stimulus were reduced in Shisa6L7 KO mice. When testing the VOR, driven by head motion only, we found that the gain was increased in Shisa6L7 KO mice (Figure S1D, left panel; p = 0.008), as was the phase lead (Figure S1D, right panel; p = 0.036). Using the visually guided VOR (VVOR) paradigm, in which the OKR and VOR work together, we found no differences in gain (Figure S1E, left panel; p = 0.51) or phase (Figure S1E, right panel; p = 0.71). These data not only suggest that the increase in VOR gain allowed the Shisa6L7 KO mice to compensate for their impairments in optokinetic control under normal conditions in which the light is present, but they also highlight that the learning deficits that occurred during the visuo-vestibular mismatch training described above cannot be linked to an inability to detect and track the visual stimulus when combined with a vestibular input.
SHISA6 Interacts with AMPA Receptors at the PC Synapse
mRNA expression levels visualized by in situ hybridization indicate that of the SHISA6, SHISA7, and SHISA9 family members—which are all prominently expressed in the brain—only SHISA6 is expressed in the cerebellum (Lein et al., 2007). Using immunohistochemistry, we demonstrated that the SHISA6 protein is expressed in PCs of control mice and is absent in PCs of Shisa6L7 KO mice (Figure 2). Given the association and co-localization of SHISA6 with GluA2 in the hippocampus (Klaassen et al., 2016), we next investigated to what extent this apposition also occurs in the cerebellum. Using 3D structural illumination microscopy (3D-SIM), we found that SHISA6 also co-localizes with GluA2 subunits in the molecular layer (ML) of the cerebellum (Figure 2C). These data were in line with the outcome of the protein interaction profile of SHISA6. When we immunoprecipitated cerebellar SHISA6 protein complexes from the n-Dodecyl-beta-D-Maltoside-extracted crude synaptic membrane fraction and subjected these to mass spectrometric (MS) analysis (Figure 2D; Table S1), we observed that AMPAR subunits GluA1-3 (Gria1-3) were highly enriched in cerebellar SHISA6 complexes.
Figure 2.

SHISA6 Is Expressed in PCs and Interacts with AMPARs
(A) Representative widefield images of control with SHISA6 expression and Shisa6L7 KO mice without SHISA6 expression in PCs.
(B) Additional higher-magnification confocal images showing the absence of SHISA6 signal in the ML of the Shisa6L7 KO mice confirming to PC specificity of SHISA6 expression.
(C) SIM imaging in control mice shows colocalization of SHISA6 (red) and GluA2 (green) in the ML.
(D) Native SHISA6 complexes were immunoprecipitated (IP) from the cerebellum of Shisa6 WT and Shisa6null mice (n-Dodecyl-beta-Maltoside [DDM]-extracted crude synaptic membranes; 3 IPs per genotype) and subjected to MS analysis. Significantly enriched proteins are represented by closed-circle symbols and labeled by gene name (Student’s t test with permutation-based FDR analysis; S0 = 0.5, FDR = 0.01).
Additional information, including protein identification and quantification, statistical analysis, data distribution, and the full list of proteins is provided in Table S1.
Absence of SHISA6 Decreases the AMPAR Level in Cerebellar Synaptosomes
Because SHISA6 associates with synaptic AMPARs, we next investigated how the absence of SHISA6 affected synaptic protein levels. To this end, we first extracted all proteins from the crude synaptic membrane fraction of eight wild-type (WT) and Shisa6null mice and subjected these to sequential window acquisition of all theoretical fragment ion spectra (SWATH) MS analysis (Figures 3A and S2A; Table S2). The resulting proteome encompassed 3142 protein groups with highly reproducible quantification (Figure S3C: WT: coefficient of variation (CV) = 0.071; Shisa6null: CV = 0.064). The relative intensity of AMPAR subunits revealed a significant downregulation of both synaptic GluA3 (Gria3) (p < 0.001) and GluA2 (Gria2) (p < 0.001), whereas GluA1 (Gria1) levels did not change significantly (q = 0.196; cut-off false discovery rate [FDR] value of 0.05). These findings were confirmed using immunoblotting for GluA2 and GluA3 in synapse-enriched postsynaptic density (PSD) and synapse surface fractions of the cerebellum in Shisa6L7 KO mice (Figure S2D, GluA2, P2: p = 0.042; GluA2, PSD: p = 0.034; GluA3, P2: 0.039; GluA3, PSD: 0.12; Figure S2E, total GluA2: p = 0.038; surface GluA2: p = 0.039). It should be noted, though, that because the synaptosomes are extracted from the whole cerebellum, the relative reduction of the AMPAR subunits reported here is most likely an underestimation of the reduction in PCs. Considering the reduction of AMPA subunits, we next investigated the impact on synapse number and synaptic morphology in PCs using electron microscopy (Figure 3B). The number of PSDs was unaffected in Shisa6L7 KO (Figure 3B, top; p = 0.65). Similarly, the length of the PSD was not affected (Figure 3B, bottom; p = 0.51). In addition, we did not observe changes in the protein composition of the PSD, as indicated by the unmodified expression of PSD marker proteins (e.g., Shank1, PSD95 (Dlg4), Homer3, and CamK2B) (Figure S2B). In short, the absence of SHISA6 does not affect the composition, length, or number of PSDs in PCs, but the removal of Shisa6 does reduce the number of GluA2- and GluA3-containing AMPA receptors.
Figure 3.

SHISA6 Absence Alters Synaptic Glutamate Receptor Levels without Affecting PSD Length or Count
(A) Comparison of the cerebellar synaptic proteome of WT and Shisa6null mice, as acquired by label free SWATH-MS measurement. Proteins with a significant difference between the mice are represented by circle symbols and labeled by gene name (Student’s t test with permutation-based FDR correction, FDR ≤ 0.05); filled circles indicate proteins with a difference greater than 10%. AMPAR subunits GluA2 (Gria2) and GluA3 (Gria3) are significantly downregulated upon Shisa6 deletion. See Figure S2A for a more detailed overview of the proteins at the center of the volcano plot and Table S2 for a full list of proteins. Right panels: detailed comparison of GluA regulation after setting the mean WT intensity to 1.
(B) Examples of EM pictures including PF to PC synapses and their PSDs. Top middle: cumulative frequency plot (histogram inset) of all sampled EM pictures indicating no population difference in PSD count (control, 640 images/5 mice; Shisa6L7 KO, 640 images/5 mice). Top right: average PSD count per animal did not differ between the groups. Bottom middle: cumulative frequency plot (histogram inset) of all sampled PSDs indicating no population difference in PSD length (control, 2629 PSDs/5 mice; Shisa6L7 KO, 2629 PSDs/5 mice). Bottom right: average PSD length per animal did not differ between the groups.
Data are represented as individual replicates and by the mean ± SEM; ∗p < 0.05, ∗∗p < 0.01.
Altered AMPAR Kinetics and Reduced Frequency and Amplitude of mEPSCs in the Absence of SHISA6 in PCs
Considering the reduced number of GluA2- and GluA3-containing AMPARs, we aimed to uncover the functional role of SHISA6 at the PC synapse. First, we stimulated afferent PFs to evaluate PF to PC synaptic functionality using whole-cell recordings of PCs. The excitatory postsynaptic response at the PF to PC synapse was highly reduced in Shisa6L7 KO (Figure 4A, left; p < 0.001). In contrast, PF paired-pulse facilitation was normal (Figure 4A, right; p = 0.86).
Figure 4.

PC-Specific Absence of SHISA6 Leads to Reduced PF to PC Excitatory Synaptic Input
(A) Sample traces of evoked EPSCs generated by stimulating afferent PFs with increasing stimulation strengths. Evoked EPSCs were consistently of lower amplitude in the Shisa6L7 KO, whereas the PPF ratio was unaffected (control, 21–25 cells/6 animals; Shisa6L7 KO, 25–27 cells/7 animals).
(B) Whole-cell patch clamp recording configuration of mEPSCs including raw traces. Top panels: mEPSC rise times and mEPSC decay times are significantly faster in the Shisa6L7 KO in comparison to controls (control, 30 cells/4 animals; ShisaL7 KO, 31 cells/4 animals). Lower panels: mEPSCs in Shisa6L7 KO PCs occur at a significantly lower frequency, but with comparable median amplitude (control, 30 cells/4 animals; KO, 31 cells/4 animals).
(C) With the addition of FSK, we increase the GluA3-containing AMPAR conductance. Top panels: both the rise and decay time are significantly different between control and Shisa6L7 KO PCs, replicating the mEPSC trials without FSK. Lower panels: the mEPSC frequency is still largely reduced in the absence of SHISA6, but now a median amplitude difference is also revealed in the presence of FSK (control, 14 cells/3 animals; KO, 13 cells/3 animals).
Data are represented as mean ± SEM; ∗p < 0.05, ∗∗p < 0.01. See also Figure S3 for CF and sIPSC data.
Previously, Klaassen et al. (2016) reported that EPSCs of CA1 pyramidal cells of Shisa6null mice do not faithfully follow high-frequency stimulations. We also checked this in PCs and found that EPSCs generated with high-frequency stimulations were not more attenuated in the absence of SHISA6 than under control conditions (Figure S3E; stimulation strength as covariate; effect genotype: p = 0.29). Therefore, unlike in the hippocampus, the absence of SHISA6 in PCs does not result in attenuated EPSCs as a result of high-frequency afferent fiber stimulation.
To get a better understanding of the single synapse response, we recorded miniature EPSCs (mEPSCs) in PCs of Shisa6L7 KO (Figure 4B). The mEPSCs in Shisa6L7 KO PCs had a decreased rise time (Figure 4B, top left; p < 0.001) and a decreased decay time compared to the controls (Figure 4B, top right; p < 0.001), indicating that SHISA6 has a role in the deactivation of AMPARs. The frequency distribution of mEPSCs in PCs of Shisa6L7 KO mice indicated a large reduction in the total number of events (Figure 4B, bottom left), which was found to be significantly different (Figure 4B, bottom left; p < 0.001). However, the median amplitude of mEPSCs was not different in Shisa6L7 KO mice (Figure 4B, bottom right; p = 0.41). Even though we did not find direct evidence for reduced mEPSC amplitudes, we considered the possibility that lower mEPSC amplitudes could disappear in the noise floor of our recordings. We therefore utilized forskolin (FSK), which has been shown to increase the conductance of GluA3-containing AMPARs (Gutierrez-Castellanos et al., 2017). The rationale for this experiment was that if very low mEPSC amplitudes disappear in the noise floor, we would be able to reveal this population by increasing AMPAR conductance. First, we confirmed the measurements of our previous mEPSC experiments (Figure 4B) on the decreased rise time (Figure 4C, top left; p = 0.002) and decay time (Figure 4C, top right; p < 0.001). The frequency distribution of mEPSCs with FSK also confirmed our previous finding, in that it was strongly reduced in the mutant (Figure 4C, bottom left; p < 0.001). However, with the addition of FSK, we now observed a lower median amplitude of mEPSCs in Shisa6L7 KO mice (Figure 4C, bottom right; p < 0.001).
In addition to PF to PC EPSC characteristics, we assessed whether SHISA6 plays a role in climbing fiber (CF) synaptic transmission. To this end, we performed both VGluT1 and VGluT2 staining in SIM to disentangle the presence of SHISA6 at CF synapses (Figure S3A). Based on these results, it appears that SHISA6 is also present postsynaptic to CF inputs (VGluT2). It should be noted, though, that this type of analysis is difficult to interpret because of the very large number of PF to PC (VGluT1) synapses present. We therefore also investigated the CF to PC synapse at the cell physiological level by recording EPSC responses. Here, we found no difference in amplitudes (Figure S3B, right panel, p = 0.24), rise time (Figure S3C, left panel, p = 0.71), paired pulse depression (PPD) (Figure S3D, left panel, p = 0.49), and CF elimination in P10–P12 mice (Figure S3F, right panel, p = 0.57). However, the CF to PC EPSCs showed a decay phenotype (Figure S3C, right panel, p < 0.001) similar to the PF to PC EPSCs, indicating that SHISA6 has a similar function at this synapse for AMPAR deactivation kinetics. Together, these results indicate that SHISA6 can have different functional profiles depending on not only the type of neuron, but also the synapse.
We also explored the possibility of impaired postsynaptic inhibitory responses in the PCs (Figure S3E). We found that spontaneous inhibitory PSCs (sIPSCs) did not differ in their rise time (Figure S3F, left panel, p = 0.50), decay time (Figure S3F, right panel, p = 0.23), frequency (Figure S3G, left panel, p = 0.32), or amplitude (Figure S3G, right panel, p = 0.63). From these results, we conclude that SHISA6 is specifically involved in the facilitation of functional PF to PC excitation and AMPAR deactivation at the PF to PC and CF to PC synapse.
Impaired LTP, But Not LTD, in PCs Lacking SHISA6
Given that auxiliary proteins of AMPARs have been associated with postsynaptic AMPAR current potentiation (MacLean et al., 2014, Greger et al., 2017), we hypothesized that PC synaptic plasticity might be affected in the Shisa6L7 KO. Using high-frequency stimulation (Figure 5A), we found that LTP can be induced in PCs of control mice (Figure 5A, p = 0.027), but not Shisa6L7 KO (Figure 5A, p = 0.54), resulting in a significant difference between groups (Figure 5A, p = 0.029). The paired pulse facilitation (PPF), a measure of presynaptic release probability, did not differ significantly between control mice and Shisa6L7 KO mice (Figure 5A, p = 0.23).
Figure 5.

SHISA6 Is Important for PF to PC Induced LTP, But Not LTD
(A) Recording configuration for PF-PC stimulation and PC voltage clamp in LTP experiments including sample traces. LTP at the PF-PC synapse was induced in control animals after a 5-min induction protocol, whereas LTP was absent in the Shisa6L7 KO (control, 7 cells/4 mice; Shisa6L7 KO, 9 cells/5 mice). No difference in PPF was observed.
(B) LTP configuration for induction of LTP with FSK. LTP at the PF-PC synapse was similarly induced in both groups after FSK application (control, 7 cells/4 mice; Shisa6L7 KO, 9 cells/5 mice). Both groups have a significant but small effect in PPF and no PPF difference between the groups.
(C) Recording configuration for PF-PC LTD including sample traces. PFs are stimulated in the distal ML, whereas the CF is stimulated close to the soma. LTD was successfully induced in both control and Shisa6L7 KO animals after a 5-min induction of conjunctive CF and PF stimulation (control, 7 cells/5 mice; Shisa6L7 KO, 7 cells/5 mice). No difference in PPF was observed. For both LTP and LTD, the pre-induction data are based on the mean of the last 5 min of the baseline recording. Post-induction data are the mean of minutes 20–25 of the post-induction recording.
Data are represented as mean ± SEM; ∗p < 0.05, ∗∗p < 0.01.
Considering the lower synaptic GluA3 expression in Shisa6L7 KO and the importance of modification of GluA3-containing AMPAR conductance for PF to PC LTP (Gutierrez-Castellanos et al., 2017, Renner et al., 2017), we tested the hypothesis that the inability to induce LTP in the Shisa6L7 KO was caused by the inability of GluA3-containing AMPARs to switch to higher conductance states (Figure 5B). For this purpose, we applied FSK, which induces increased GluA3-conductance-mediated LTP. We did not observe any significant difference between the groups (p = 0.73), both presenting with a prominent potentiation (controls, p = 0.033; Shisa6L7 KO mice, p < 0.001) (Figure 5B). PPF was also not different between the groups (Figure 5B, p = 0.61). These results reveal that increasing the conductance of GluA3-containing AMPARs still induces LTP, but afferent PF stimulation does not, indicating that the explanation for the phenotype probably lies upstream of this FSK-induced cyclic AMP (cAMP)-dependent form of LTP.
We also evaluated LTD using the classical 1-Hz protocol of CF activation together with PF stimulation. LTD could be induced in PCs of both control (p = 0.025) and Shisa6L7 KO mice (p = 0.008), with no significant difference between the groups (p = 0.51; Figure 5C). In addition, the PPF was not different between the groups (Figure 5C, p = 0.27). Together, these data indicate that the absence of SHISA6 results in an impairment of PF to PC LTP, but not of PF to PC LTD.
Reduced Spike Output and Enhanced Regularity of PC Firing in the Absence of SHISA6
The highly reduced excitatory synaptic transmission and motor coordination impairments induced by PC-specific ablation of SHISA6 are quite prominent. We therefore aimed to further characterize PC physiology by analyzing SiSp and complex spike (CoSp) firing frequencies as well as firing regularity (CV2) of PCs in vivo. To align our results with VOR adaptation and eyeblink conditioning while taking the characteristics of the relevant cerebellar zones into consideration (Zhou et al., 2015, ten Brinke et al., 2015), we recorded PC activity from both anterior (lobules I–III) and posterior (lobule X) lobules in awake mice (Figure 6A). The SiSp firing rate of PCs was significantly lower in Shisa6L7 KO mice in both the anterior (Figure 6B, left; p = 0.009) and posterior lobules (Figure 6D, left; p = 0.003). In addition, there was an increase in the regularity of SiSp firing in PCs of the anterior lobe (i.e., a significant decrease in the coefficient of variation for adjacent intervals, CV2; p < 0.001; Figure 6B, right), whereas the regularity of SiSp firing in the posterior lobe was not significantly affected (Figure 6D, right; p = 0.14). The CoSp firing rate and regularity were both unaffected in the anterior (CoSp rate: Figure 6C, left, p = 0.40; CoSp regularity: Figure 6C, right, p = 0.10) as well as the posterior lobes (CoSp rate: Figure 6E, left, p = 0.16; CoSp regularity: Figure 6E, right, p = 0.16).
Figure 6.

Shisa6L7 KO Mice Show Reduced SiSp Frequencies and Increased SiSp Regularity In Vivo
(A) Top: recording configuration for in vivo spiking. Bottom traces: raw recordings for anterior (lobules I–III) and posterior (lobule X) in vivo recordings. Note the complex spikes (indicated with asterisk) and subsequent SiSp pause.
(B) Left panel: SiSp frequency in lobules I–III was significantly lower in the Shisa6L7 KO. Moreover, a significant difference in the CV2 (right panel) was found between the two groups, indicating that the SS regularity was increased in the Shisa6L7 KO.
(C) There was no difference in the anteriorly recorded CoSp frequency or regularity (control, 16 cells/3 mice; Shisa6L7 KO, 20 cells/3 mice).
(D) SiSp frequency was lowered in the Shisa6L7 KO mice, whereas spike regularity was unaffected (control, 13 cells/3 mice; Shisa6L7 KO, 15 cells/3 mice).
(E) There was no difference in the posteriorly recorded CoSp frequency or regularity.
Data are represented as mean ± SEM; ∗p < 0.05, ∗∗p < 0.01.
To exclude the possibility that the loss of SHISA6 impairs firing rates in vivo through effects on mechanisms responsible for the intrinsic generation of SiSps, we injected currents of varying strengths into the PC soma ex vivo (Figure S4A). We found no change in the number of spikes generated in the Shisa6L7 KO (Figure S4A; p = 0.79). Blocking all afferent input and measuring the pacemaker activity of PCs with cell-attached recordings ex vivo revealed no differences in firing frequency or CV2 in the anterior lobe (frequency, p = 0.29; CV2, p = 0.60; Figure S4B) or the posterior lobe (frequency, p = 0.64; CV2, p = 0.33; Figure S4C). We conclude that there are no major intrinsic impairments in the ability of PCs to generate SiSps or CoSps in Shisa6L7 KO mice, suggesting that SHISA6 has a dedicated role in the proper integration of PF to PC synaptic excitatory inputs, which are required to modulate the frequency and regularity of SiSp firing of PCs in awake behaving animals.
Discussion
In the current study, we provide evidence for the functional role of the AMPAR auxiliary protein SHISA6 in a brain area relevant for procedural memory formation. The ablation of SHISA6 in PCs of the cerebellum results in severely dysfunctional motor learning. We observe the co-localization of the SHISA6 protein with AMPARs in PCs and report an interaction with AMPARs containing subunits GluA1–3. In the absence of SHISA6, AMPAR subunits GluA2 and GluA3 are downregulated, while mice with a PC-specific deletion of SHISA6 show strongly reduced PF to PC basal excitatory postsynaptic transmission, impaired LTP, and reduced SiSp activity in vivo. Together, our findings suggest a crucial role for SHISA6 in PC-dependent motor learning by facilitating PF to PC AMPAR postsynaptic transmission.
Several auxiliary subunits have thus far been shown to affect AMPAR conductance, kinetics, and localization (Greger et al., 2017). The first mouse line to spur interest in auxiliary subunits was the severely ataxic stargazin mouse mutant, in which a lack of the transmembrane AMPAR regulatory protein TARPγ-2 (i.e., stargazin) resulted in the absence of excitatory transmission at the mossy fiber to granule cell synapse (Hashimoto et al., 1999, Chen et al., 2000). TARPγ-2, as well as other family members, has been shown to control both trafficking and kinetic profiles of AMPARs (Tomita et al., 2005, Yamazaki et al., 2015, Greger et al., 2017). For the more recently identified Shisa family of auxiliary AMPAR proteins, both member-specific as well as partially overlapping modulatory effects on AMPAR properties have been reported. For instance, in the hippocampus, the first identified member of the Shisa family, SHISA9 (CKAMP44), was shown to cause fast and strong desensitization of AMPAR currents (von Engelhardt et al., 2010, Chen et al., 2018), whereas SHISA6 and SHISA7 were reported to decrease the rates of deactivation and desensitization of AMPARs (Klaassen et al., 2016, Schmitz et al., 2017). Relatively little is known about the role of Shisa family members in specific brain circuits and how the different members affect behavior.
Here, we set out to explore a PC-specific KO of Shisa6 in the cerebellum and dissect the physiology behind the severely impaired motor learning tasks that are known to depend on the function of the PC synapse. We confirm a strong expression of SHISA6 in PCs and report the interaction between SHISA6 and AMPAR subunits GluA1–3. Interestingly, we find that levels of GluA2 and GluA3 are decreased in cerebellar synaptosomes in the absence of SHISA6. In addition, we find PF to PC evoked EPSC amplitudes to be largely reduced upon afferent PF stimulation. This result raises two potential explanations: the total number of synapses is reduced, and/or the individual synapse is functionally dampened due to the reduced number of AMPARs. We performed quantitative electron microscopy (EM) analyses and showed no difference in the number and/or PSD size in the absence of SHISA6, indicating that decreased PF to PC synaptic input results from the reduced number of AMPARs. In our exploration of synaptic dysfunction, we examined mEPSCs and confirm the previously reported hippocampal AMPAR phenotypes (affected rise and decay time) and furthermore reveal that the frequency of mEPSCs is largely reduced, while, to our surprise, the amplitude of mEPSCs is, at least initially, not significantly different. As the EM data of ML PSDs did not indicate a reduced number of PF to PC synapses, we argue that it is very likely to be the noise floor of mEPSC recordings that prevented us from observing lower mEPSC amplitudes in the absence of SHISA6 in the PC. We therefore further explored the possibility of enhancing AMPAR conductance amplitude by using FSK, which was recently shown to specifically enhance the conductance of postsynaptic GluA3-containing AMPARs (Gutierrez-Castellanos et al., 2017, Renner et al., 2017). Indeed, under the FSK condition, we were able to reveal a significant reduction in mEPSC amplitude, while the frequency of detected mEPSCs also increased, highlighting that applying FSK facilitates the detection of additional synapses that are otherwise nondetectable.
Dynamic changes in the number and sensitivity of AMPARs are thought to be part of the central mechanism that facilitates different types of learning (Nabavi et al., 2014, Makino and Malinow, 2011, Gutierrez-Castellanos et al., 2017). While assessing the role of SHISA6 in long-term synaptic plasticity, we found that the induction of LTP in PCs of Shisa6L7 KO mice was impaired, whereas LTD could still be induced. However, by applying FSK, postsynaptic LTP could still be induced and be modulated by increasing the GluA3-containing AMPAR conductance (Renner et al., 2017, Gutierrez-Castellanos et al., 2017). These experiments raise the possibility that the normal PF-dependent LTP induction is hampered by lower levels of the GluA2/3 AMPAR in the absence of SHISA6, which is not compensated for by a GluA3 conductance increase, normally occurring at the PF to PC during LTP induction. Alternatively, as PF to PC synapses are typically activated by sensory-learning-mediated bursts of granule cell activity (van Beugen et al., 2013), which in turn can drive Ca2+ T-type channel-dependent LTP (Ly et al., 2013), it is possible that impaired LTP induction in Shisa6L7 KO is partly a result of faster AMPAR deactivation and thus insufficient postsynaptic depolarization for Ca2+-dependent LTP induction. However, it should be noted that our attempts to induce LTP using high-frequency PF stimulations at quasi-physiological temperatures (34° ± 1°C) was not effective in the control. Therefore, it remains to be elucidated whether the observed impairment in LTP in the absence of SHISA6 at room temperature (21° ± 1°C) can be extrapolated to in vivo relevance for procedural motor learning. Because the CF to PC physiological experiments did not show any major impairments, except for the AMPAR deactivation times, we hypothesize that in principle, the CFs of Shisa6L7 KO mice should be able to guide LTD induction tuned to the procedural demands in a sufficient matter.
Additional experiments in vivo using single-unit recordings of PCs reveal that the firing frequency and the irregularity of SiSps were lower in the absence of SHISA6. We thus hypothesize that the largely reduced synaptic excitatory input at the PF to PC synapse is contributing to the change in SiSp firing frequency and increased regularity. However, changes in the inhibitory input from ML interneurons may also affect the regularity of SiSps (Wulff et al., 2009, Peter et al., 2016). Still, given the absence of changes in frequency or amplitude of sIPSCs of PCs, we propose that the reduced excitatory synaptic input is the main reason for a more regular SiSp output. Several studies have investigated the importance of modulated SiSp firing by means of synaptic input and its crucial roles in motor learning (Hoebeek et al., 2005, Wulff et al., 2009, Peter et al., 2016, Walter et al., 2006, Nguyen-Vu et al., 2013, Jirenhed et al., 2007). We hypothesize that the main pathway by which the absence of SHISA6 in PCs contributes to the behavioral phenotypes reported in this study is by highly reduced PF to PC excitatory transmission and, as a result, much reduced PF afferent information processing, leading to impaired spatiotemporal coding of sensorimotor information (De Zeeuw et al., 2011). It is of interest to note that the PF to PC synaptic reduction in AMPARs, as detected here, was not found in the Shisa6null mouse line in the hippocampus (Klaassen et al., 2016), indicating specific roles of SHISA6 depending on the cell and/or synapse types studied. Together, the results presented here provide insight into SHISA auxiliary AMPAR subunit modulation of synaptic currents and highlight the importance of baseline synaptic PF to PC transmission for both procedural motor learning and coordination.
STAR★Methods
Key Resources Table
| REAGENT or RESOURCE | SOURCE | IDENTIFIER |
|---|---|---|
| Antibodies | ||
| IHC/IB: anti-Shisa6 | Klaassen et al., 2016 | PMID: 26931375 |
| IHC/IB: anti-GluA2 | Neuromab | Cat# 75-002; RRID: AB_2232661 |
| IHC: DAPI | Invitrogen | Cat# D3571; RRID: AB_2307445 |
| anti-BACTN | Sigma-Aldrich | Cat# A5441; RRID: AB_476744 |
| IB: anti-GluA3 | Alomone Labs | Cat# AGC-010; RRID: AB_2039883 |
| IB: anti-PSD95 | Neuromab | Cat# 75-028; RRID: AB_2292909 |
| IB: anti-Synaptophysin | SySy | Cat# 101 004; RRID: AB_1210382 |
| IHC: anti-VGlut1 | Millipore | Cat# AB5905; RRID: AB_2301751 |
| IHC: anti-VGlut2 | Millipore | Cat# MAB5504; RRID: AB_2187552 |
| Chemicals, Peptides, and Recombinant Proteins | ||
| Tetrodotoxin Citrate | Tocris | 1069 |
| Picrotoxin | Sigma | P1675 |
| NBQX | Tocris | 1044 |
| D-AP5 | Tocris | 0106 |
| Forskolin | Sigma | F3917 |
| Experimental Models: Organisms/Strains | ||
| Mouse: Shisa6L7 KO | This paper | N/A |
| Mouse: Shisa6null | Klaassen et al., 2016 | PMID: 26931375 |
| Oligonucleotides | ||
| Genotyping primer: Rz742 5′-CCGGAGAAGGACA AGACCAACTTCAC-3′ |
Integrated DNA technologies | N/A |
| Genotyping primer: Rz804 5′-GATGGCCTGAAC ATTACAGAAGCATGAACTC-3′ |
Integrated DNA technologies | N/A |
| Genotyping primer: Rz803 5′-CTGACCGGTCCG TCTCGCCTTTC-3′ |
Integrated DNA technologies | N/A |
| Software and Algorithms | ||
| HEKA Patchmaster | HEKA | https://www.heka.com/downloads/downloads_main.html#down_patchmaster |
| Prism 7.0 | Graphpad Software | https://www.graphpad.com/scientific-software/prism/ |
| Adobe illustrator CS6 | Adobe | https://www.adobe.com/products/illustrator.html |
| pClamp 10 | Molecular Devices | https://www.moleculardevices.com/products/axon-patch-clamp-system/acquisition-and-analysis-software/pclamp-software-suite |
| SPSS | IBM | https://www.ibm.com/products/spss-statistics |
| Python 3.7 | Python Software Foundation | https://www.python.org/ |
| R 3.6 | R Core Team | https://www.r-project.org/ |
| R package: nparLD | Noguchi et al., 2012 | https://cran.r-project.org/web/packages/nparLD/index.html |
| R package: lme4 | Bates et al., 2015 | https://cran.r-project.org/web/packages/lme4/index.html |
| R package: lmerTest | Kuznetsova et al., 2017 | https://cran.r-project.org/web/packages/lmerTest/index.html |
| R package: limma | Smyth, 2005 | https://bioconductor.org/packages/release/bioc/html/limma.html |
| Perseus 1.6.2.1 | Geyer et al., 2016 | https://maxquant.net/perseus/ |
| Image Studio Lite 5.2.5 | Li-Cor | https://www.licor.com/bio/image-studio-lite/ |
| Spectronaut 11.0.15038.23 | Bruderer et al., 2015 | https://biognosys.com/shop/spectronaut |
| MaxQuant 1.6.1.0 | Cox and Mann, 2008 | https://maxquant.net/maxquant/ |
Resource Availability
Lead Contact
Further information and requests for resources and reagents should be directed to the lead contact, Chris I. De Zeeuw (c.dezeeuw@erasmusmc.nl).
Materials Availability
Requests related to the Shisa6 mouse line should be directed to the lead contact.
Data and Code Availability
The data that support the findings of this study are available from the corresponding author(s) upon reasonable request.
Experimental Models and Subject Details
Experiments and analyses were performed with the experimenters blinded to the genotype. Both male and female mice were used for all experiments and all mice were allocated to an experimental group by genotype. Male and female mice were pooled, because of the limited availability of experimental mice in this study. All mice were individually housed from postnatal day (P)21 with food and water available ad libitum and in 12:12 h light/dark cycles. All experiments were approved by local (DEC) and national ethical committees. Adult mice aged 4 to 24 weeks old were used for the behavioral assays, in vivo physiology and immunoprecipitation and SWATH protocol. Mice used were Shisa6L7 KO and their littermate controls all bred on a mixed C57BL6/Nhsd and C57BL6/J background. The Shisa6L7 KO model was generated by crossing Purkinje specific L7(Pcp2)-Cre mice (Barski et al., 2000) with Shisa6tm1a2(Caliper)CNCR-VUA (Klaassen et al., 2016). Genotyping was performed on P7–10 using primers Rz742, Rz804 and Rz803. Using a previously described PCR method (Klaassen et al., 2016), we found that the Shisa6L7 KO littermates contained a relatively large number of germline deletions always affecting one allele. For the immunoprecipitation and SWATH protocols we used Shisa6null mice and their WT litter mates. In the current manuscript, all mice denoted as control are Shisa6L7 HET (i.e., heterozygous whole-body deletion), whereas the Shisa6L7 KO is a full KO for PCs and has heterozygous whole-body deletion. All experiments were conducted in line with the European guidelines for care and use of laboratory animals (Council Directive 86/6009/EEC). The individual experimental protocols were approved by the Animal Experiment Committee (EDC) of the ErasmusMC.
Method Details
Immunoprecipitation and mass spectrometry
Immunoprecipitation (IP) using anti-Shisa6 antibody (Chen et al., 2014) was performed on the n-Dodecyl-beta-Maltoside (DDM) extracted crude synaptic membrane fraction, prepared from the cerebellar tissue of WT and Shisa6null mice, as described previously for the hippocampus (Klaassen et al., 2016). Eluted proteins were fractionated by SDS-PAGE, subjected to in-gel tryptic digestion, and analyzed on a TripleTOF 5600+ mass spectrometer (Sciex, Framingham, MA, USA) operating in information-dependent acquisition (IDA) mode, as described previously (Klaassen et al., 2016).
TripleTOF 5600+ data was imported into MaxQuant (version 1.6.1.0) (Cox and Mann, 2008) and searched against the Uniprot mouse reference proteome (April 2018 release; including canonical and additional sequences). Methionine oxidation and N-terminal acetylation were selected as variable modifications, and proprionamide set as fixed cysteine modification. For both peptide and protein identification the false discovery rate was set to 0.01. Match between runs was enabled with a match time window of 0.7 min and alignment time window of 20 min. MaxLFQ normalization was enabled with a LFQ minimal ratio count of 1. Remaining parameters were left to default, with protein group identification requiring a minimum of 1 razor + unique peptide. The filtering and statistical analysis of the Maxquant results was performed in Perseus (version 1.6.2.1) (Geyer et al., 2016). in the following order: (1) Importing the Maxquant proteinGroups.txt file into Perseus; (2) Removal of “Reverse,” “Potential contaminant,” and “Only identified by site” protein groups; (3) Log2 transformation of all LFQ intensity values; 4) Removal of protein groups in which any WT value was derived “By matching,” (5) Removal of protein groups with less than three valid Log2 LFQ intensity values in the WT group; (6) Imputation of missing values (7.7% of the KO population) from a normal distribution (width 0.3, down shift 1.8, whole matrix) (7) Performing a Student’s t test (S0 = 0.5) followed by permutation-based FDR analysis on the Log2 LFQ intensity values (FDR = 0.01, 2500 permutations).
Immunoblot analysis
Protein samples were dissolved in Laemmli sample-buffer, heated to 96°C for 5 minutes, and loaded onto a 4%-15% Criterion TGX Stain-Free gel (Bio-Rad, Temse, Belgium) along with Precision Plus protein standard (Bio-Rad, Temse, Belgium). The gel-separated proteins were imaged with the Gel-Doc EZ system (Bio-Rad, Temse, Belgium), transferred O/N onto PVDF membrane (Bio-Rad; Temse, Belgium) and probed with various antibodies (see ‘Antibodies’ section). Scans were acquired with the Odyssey Fc system (Li-Cor, Lincoln, NE, USA), and adjusted and quantified using Image Studio Lite 5.2.5 software (Li-Cor, Lincoln, NE, USA).
Sample preparation for SWATH MS analysis
Crude synaptic membranes were prepared from the cerebellum of WT and Shisa6null mice as described previously (Klaassen et al., 2016), with the addition of PhosSTOP phosphatase inhibitors (Roche, Basel, Switzerland) to the homogenization buffer. Proteins were extracted and digested according to the filter-aided sample preparation (FASP) protocol (Wiśniewski et al., 2009) with some adaptations. Proteins were extracted and reduced by incubation with SDS-lysis buffer (final concentration of 1 μg protein/μl, 2% SDS, 100 mM Tris-HCl (pH 8.5) and 2.5 mM Tris(2-carboxyethyl)phosphine-HCl (TCEP)) for 1 hour at 56°C with 1100 RPM mixing. Next, proteins were alkylated by addition of methyl methanethiosulfonate (MMTS; final concentration of 5 mM) for 10 minutes at RT. The protein lysate was diluted to 0.5% SDS with Urea buffer (8 M Urea, 100 mM Tris-HCL (pH 8.5)), centrifuged at 20,000x g for 2 minutes at 20°C, and 100 μl was loaded onto a Microcon Ultracel PL-30 filter (Merck Millipore, Darmstadt, Germany). The filters were centrifuged at 12,000x g for 10 minutes at 20°C and subsequently washed five times with 100 μl Urea buffer and four times with 100 μl 50 mM NH4HCO3 (identical centrifugation settings). After washing, Trypsin/LysC Mix (Promega, Leiden, the Netherlands) was added to the filters at an enzym to protein ratio of 1 to 25, and incubated O/N at 37°C within a humidified chamber. Digested peptides were collected from the filter by elution with 50 mM NH4HCO3 and acidified to a final concentration of 0.5% trifluoroacetic acid (TFA). Finally, the eluted peptides were desalted using an Oasis HLB 96-well μelution plate (Waters, Milford, MA, USA) following the manufacturer’s guidelines and using 0.1% TFA and 80% acetonitril + 0.1% TFA as binding and elution buffers, respectively.
In order to prepare an experiment-specific spectral library, an additional four FASP preparations were performed on lysate pooled equally from all WT mice. Two samples were purified directly by Oasis HLB desalting, with the remaining two samples pooled and fractionated using the high pH reversed-phase peptide fractionation kit (Pierce, Thermo Scientific, Waltham, MA, USA) according to the manufacturer’s instructions.
Micro-LC and MS of spectral library fractions
Peptides were analyzed by micro LC MS/MS using an Ultimate 3000 LC system (Dionex, Thermo Scientific, Waltham, MA, USA) coupled to the TripleTOF 5600+ mass spectrometer. Dried peptide samples were redissolved in 5% acetonitril + 0.1% formic acid (FA), supplemented with iRT calibration peptides (Biognosys, Zurich, Switzerland) and loaded onto a 5 mm PepMap100 C18 precolumn (300 μm i.d., 5 μm particle size (Dionex, Thermo Scientific, Waltham, MA, USA). Separation was achieved on a 150 mm ChromXP C18 column (300 μm i.d., 3 μm particle size (Sciex)) using a linear aqueous-organic gradient of 5%–18% acetonitrile (+0.1% FA) in 88 minutes, 25% at 98 minutes, 40% at 108 minutes and 90% at 110 minutes, using a flow rate of 5 μL/minute. Eluting peptides were electro-sprayed directly into the TripleTOF MS operated in IDA mode. One full scan consisted of a single full profile MS scan (150 ms, m/z 350 to 1250 and charge state +2 to +5), followed by MS/MS analysis of the top 25 most intense precursor ions (150ms, m/z 200 to 1800, charge state +2 to +5, high sensitivity mode and precursor ion count/s > 150). Dynamic exclusion was set to 16 s. Ions were fragmented using rolling collision energy with an energy spread of 5eV.
Micro-LC and SWATH MS
The LC setup and settings were identical to those described for the IDA MS of spectral library fractions. SWATH measurement consisted of a full precursor ion scan (150 ms, m/z 350−1250) followed by sequential precursor isolation windows of 8 Da across the mass range of m/z 450-770 with 1 Da overlap (80 ms). Total cycle time was around 3.2 s, providing 8-9 data points across a typical peptide. The collision energy for each window was determined by the appropriate collision energy for a 2+ ion, centered upon the window with a spread of 15 eV.
Analysis of spectral library IDA MS results
The spectral library files were imported into MaxQuant (version 1.6.1.0) (Cox and Mann, 2008) and searched against the Uniprot mouse reference proteome (April 2018 release; including canonical and additional sequences) supplemented with the Biognosys iRT FASTA database. Methionine oxidation and N-terminal acetylation were selected as variable modifications, and MMTS modification of cysteine set as fixed modification. For both peptide and protein identification the false discovery rate was set to 0.01. Remaining parameters were left to default. The spectral library was made from the MaxQuant msms.txt file using Spectronaut (version 11.0.15038.23) (Bruderer et al., 2015). Imported peptides were filtered for a Q-value threshold of < 0.01 with all other settings left to default.
SWATH processing and statistical analysis
The peptide abundances were extracted from the raw SWATH data by Spectronaut (version 11.0.15038.23), using default BGS factory settings. Next, Spectronaut performed across-run normalization based on total peak areas. Peptide abundances were exported from Spectronaut as a report and further processed using the R language for statistical computation (R Core Development Team, 2013). Each unique precursor was considered a peptide (e.g., the same peptide sequence observed with distinct modifications or charge was considered a distinct peptide). The Spectronaut fragment group Q-values were used to select for high confidence peptides, with the following filter settings: Peptides must have a Q-value smaller than, or equal to, 10−4 in at least seven out of eight replicas within at least one group. Protein abundances were calculated at the gene level by summation of the normalized peak area of their respective peptides. Peptides that matched to multiple genes in the spectral library were compiled into separate groups with unique sets of genes. Next, the protein abundance matrix was Loess normalized using the normalizeCyclicLoess function from the limma R package (Smyth, 2005), which was set to ‘fast’ and iterations were set to 10. Finally, the normalized protein abundances were imported into Perseus (version 1.6.2.1) for statistical analysis. All data was Log2 transformed and differential expression between the groups was assessed by Student’s t test (S0 = 0) followed by permutation-based FDR analysis (FDR = 0.05, 2500 permutations).
Isolation of postsynaptic density fraction
Crude synaptic membranes (P2) were prepared from the cerebellum of adult control and Shisa6L7 KO mice as described previously (Klaassen et al., 2016). The P2 fraction was diluted in extraction buffer (0.15 μg protein/μl, 1% Triton X-100, 75 mM KCl, 25 mM HEPES (pH 7.4), supplemented with EDTA-free Complete protease inhibitor (Roche, Basel, Switzerland)) and incubated at 4°C for 30 minutes with 10 RPM end-over-end mixing. The Triton X-100 insoluble fraction was precipitated by centrifugation at 20,000x g for 30 minutes at 4°C. Subsequently, the pellet was resuspended in extraction buffer and once more incubated and centrifuged as decribed above, yielding the final Triton X-100 insoluble PSD pellet. The P2 and PSD fractions were dissolved in 2x Laemmli sample-buffer, incubated at 56°C for 30 minutes in a thermomixer at 1200 RPM and heated to 96°C for 5 minutes prior to immunoblot analysis.
Biotinylation of synaptic surface proteins
Crude synaptic membranes (P2) were prepared from the cerebellum of adult control and Shisa6L7 KO mice as described previously (Klaassen et al., 2016). P2 samples of 200 μg were resuspended in 1 mL of homogenization buffer (0.32 M sucrose, 10 mM HEPES (pH 7.4), and EDTA-free Complete protease inhibitor (Roche, Basel, Switzerland)) supplemented with 0.25 mg/ml EZ-Link Sulfo-NHS-SS-Biotin (Pierce, Thermo Scientific, Waltham, MA, USA) and incubated at 4°C for 30 minutes with 10 RPM end-over-end mixing. Control samples received identical treatment in the absence of biotin. Non-reacted biotin reagent was deactivated by the addition of 50 mM glycine (final concentration). To remove free biotin, the P2 samples were centrifuged at 18,000x g for 30 minutes at 4°C and the pellet washed with homogenization buffer supplemented with 50mM glycine. Proteins were extracted in 2% SDS, 50mM Tris-HCl (pH 8.0), 150 mM NaCl and EDTA-free Complete protease inhibitor (Roche, Basel, Switzerland)) for 30 minutes at RT with 1200 RPM mixing, followed by 5 minute incubation at 96°C. Protein extracts were cleared of unsoluble debris by centrifugation at 20,000x g for 5 minutes at RT and diluted 40-fold with Triton X-100 buffer (1% Triton X-100, 50mM Tris-HCl (pH 8.0), 150 mM NaCl and EDTA-free Complete protease inhibitor (Roche, Basel, Switzerland)). Biotinylated proteins were isolated from the diluted protein extract by incubation with NeutrAvidin Agarose Resin (Pierce, Thermo Scientific, Waltham, MA, USA) for two hours at RT and 10 RPM end-over-end mixing, followed by four washes with Triton X-100 buffer and elution with 2x Laemmli sample buffer.
Electron microscopy
Adult mice were transcardially perfused with fixative 4% PFA (EM grade) 1% Glutaaraldehyde (EM grade) in 0.12 M sodiumcacodylate (NaCac). The brains were removed and put in 4% PFA at 4°C overnight. The following day 100 μm sagittal slices were cut using a Vibratome (VT1000S, Leica, the Netherlands). The slices were then washed, in order: 3 times 10 min in 0.1 M NaCac, 2 hours 4°C in 2% Osmium Tetroxide + 0.1 M NaCac + 1.5% K3Fe(CN)6, then 3 times 10 min in 0.1 M NaCac. Finally, 3 times 10 min MilliQ wash. The slices were then bathed in ISO 3696 Type 1 ultrapure water (MilliQ) overnight. The next day, slices were washed again, and dehydrated in order: 10 min MilliQ, 10 min 50% EtOH, 60 min 1% Uranyl Acetate/50% EtOH, 10 min 70% EtOH, 5 min 80% EtOH, 5 min 90% EtOH, 5 min 96% EtOH, 5 min 100% EtOH, 2 times 8 min Dimethoxypropane (DMP), 2 hours DMP: Durcupan 1 (Fluka) (1:1), 2 hours DMP: Durcupan 1 (1:3). The following day this was continued: 2 hours D1 (50°C), 2 hours Durcupan 2 (Fluka) (50°C) and then polymerized 3 nights at 60°C. Ultrathin sections (60 nm) were cut using an ultramicrotome (Ultracut UCT, Leica) and contrasted with 6% uranyl acetate in MilliQ and lead citrate staining, sections from controls and Shisa6L7 KO mice were examined using an electron microscope (Philips CM100). For ultrastructural PSD analysis, spine synapses have been selected from proximal and distal molecular layer from lobule 3 and lobule 10. PSDs were manually counted and their length was quantified using Fiji software.
Immunohistochemistry
Mouse brains were snap-frozen after removal without perfusion. Tissue was sectioned at 10 μm using a cryostat at −20°C and a knife temperature of −14°C. Sections were air-dried on superfrost glass and stored at −80°C. For staining, sections were defrosted at room temperature (RT) for 60 min and subsequently washed with −20°C Clarks liquid (75 mL EtOH + 25 mL HAc) for 10 min followed by 3 times 10 min of PBS wash. Sections were incubated for 120 min in blocking solution (PBS + 0.3% Triton X-100 + 4% NGS) at RT and washed 3 times in PBS for 10 min. Following a 60-min incubation in 5% BSA (in PBS) at RT and subsequent PBS washing, sections were incubated in SA5193 antibody (1:1000, dissolved in 2% bovine-serum albumin) and anti-GluA2 antibody (1:200) overnight at 4 °C. The sections were then washed for 3 times 10 min in PBS followed by 120 min of fluorescent antibody staining (1:200, Streptavidin-Cy3) in 2% BSA at RT. After the fluorescent antibody staining, a wash of 3 times 10 min of PBS was followed by 2 times 10 min wash with PB. The sections were then put in DAPI (200 μL in 50 mL 0.1 M PB) for 10 min. This was concluded by 2 times 10 min PB wash. Following PBS washing, the sections were thionin-stained and permount-covered using standard protocols. Images were taken using an upright confocal microscope (LSM 700, Zeiss, Oberkochen, Germany).
3D-SIM imaging and analysis
3D-SIM images were acquired using a Zeiss Elyra ps.1 microscope, fitted with bp 420-480, bp 495 – 575, bp 570 – 650 and lp 655 emission filters. Five rotations and five shifts of the illumination pattern were used to acquire raw images. A 3D volume was imaged using a z stack with an interval of 110 nm. Raw images were reconstructed into high resolution images using the Zeiss ZEN software on the default settings (segmentation of zeroth, first and second order were set on 100,100 and 83 respectively, where 100 is maximum filtering, the generalized Wiener filter with a regularization of 10−6 was used to filter noise, images were baseline cut to remove negative values).
Images were analyzed using ImageJ in the FIJI framework (Schindelin et al., 2012). The number of distinct synapses in which co-localization was observed were determined using the maxima of individual Shisa6 and GluA2 spots in a single field of view at the center of the 3D imaged volume. If Shisa6 spots were at a distance closer than 120 nm, they were defined as co-localizing.
Ex vivo electrophysiology
Following decapitation of the mouse under isoflurane anesthesia, the cerebellum was removed, and moved into an ice-cold ‘slicing medium’. The slicing medium contained (in mM) 240 sucrose, 2.5 KCL, 1.25 Na2HPO4, 2 MgSO4, 1 CaCl2, 26 NaHCO3 and 10 D-Glucose and was carbogenated continuously (95% O2 and 5% CO2). Sagittal slices, 250 μm thick, of the cerebellar vermis were cut using a vibratome (VT1200S, Leica) and put in carbogenated artificial cerebrospinal fluid (ACSF) containing (in mM): 124 NaCl, 2.5 KCL, 1.25 Na2HPO4, 2 MgSO4, 2 CaCl2, 26 NaHCO3 and 15 D-Glucose. Slices were incubated for at least 1 hour at 34 ± 1°C before the start of the experiment. Slice physiology was done at 34 ± 1°C unless otherwise specified in the methods section. Recordings were done in the presence of 100 μM picrotoxin. For mEPSC recordings 1 μm TTX was added. Whole-cell patch clamp recordings and cell-attached recordings were performed with EPC9 and EPC10-USB amplifiers (HEKA Electronics, Lambrecht, Germany) using Pulse and Patchmaster software (HEKA Electronics). Recordings were excluded if the series (Rs) or input resistances (Ri) changed by > 15% during the experiment, which was determined using a hyperpolarizing voltage step relative to the −65 mV holding potential. Analysis of the sIPSC and mEPSC rise times, decay times (τ), frequencies and amplitudes were done using custom-made Python scripts, based on the deconvolution-based method for EPSC detection (Pernía-Andrade et al., 2012). Analysis of the AP threshold (defined by a slope of > 20 mV/ms), AHP amplitude, decay time (τ), spike count, and seal tests in intrinsic excitability experiments was performed exclusively on the first AP elicited by a depolarizing current injection. All current clamp recordings were analyzed using Clampfit (Molecular Devices). Spontaneous spiking rates in cell-attached experiments were analyzed using Clampfit, after filtering the data with a 1.5 kHz low-pass filter and calculating the derivative of the original signal.
For whole-cell recordings PCs were visualized using upright microscopes (Axioskop 2 FS and Axio Examiner.D1, Carl Zeiss Microscopy GmbH, Jena, Germany) equipped with a 40x objective. Recording electrodes (3–5 MΩ, 1.65 mm outside diameter (OD) and 1.11 mm interior diameter (ID), World Precision Instruments, Sarasota, FL, USA) were prepared using a P-97 micropipette puller (Sutter Instruments, Novato, CA, USA), and filled with an intracellular solution containing (mM): 120 K-Gluconate, 9 KCL, 10 KOH, 4 NaCl, 10 HEPES, 28.5 Sucrose, 4 Na2ATP, 0.4 Na3GTP (pH 7.25 – 7.35 with an osmolarity of 295 ± 5). Note that we adjusted the osmolarity using sucrose. sIPSCs were recorded in the presence of NBQX disodium salt hydrate and APV (Sigma-Aldrich, Missouri, United States), using an intracellular solution containing (mM): 150 CsCl, 1.5 MgCl2, 0.5 EGTA, 4 Na2ATP, 0.4 Na3GTP, 10 HEPES, 5 QX-314 (pH 7.25 – 7.35 with an osmolarity of 295 ± 5). mEPSCs were recorded at −75 mV using an intracellular solution containing (in mM): 130 CsMeSO4, 4 MgCl2∗6H2O, 0.2 EGTA, 10 HEPES, 4 Na2ATP, 0.4 Na3GTP, 10 phosphocreatine-disodium, 1 QX-314 (pH 7.25-7.35, osmolarity 295 ± 5). The forskolin mEPSCs were recorded with the addition of 50 μM FSK dissolved in DMSO to the ACSF. The same internal solution was used for the CF elimination experiments. Cslow and Rseries compensation were used for both sIPSC and mEPSC recordings, in order to improve the accuracy of measurements of the event kinetics. For extracellular stimulation of PFs, patch electrodes were filled with ACSF and positioned in the upper third of the molecular layer lateral to the soma of the patched PC. For afferent PF stimulation protocols intensities were varied between 3 – 15 μA, with 3 μA increments for the experiments involving evaluation of stimulation strength to PC EPSC amplitude. For paired-pulse facilitation measurements during PF–PC transmission, we used various inter-stimulus intervals (50 – 200 ms).
For CF stimulation, patch electrodes filled with ACSF were positioned near the patched PC soma in the surrounding granule layer. We selected those recordings in which CF stimuli elicited clear all-or-none responses and lacked the co-activation of PC axons (identifiable by antidromic APs) for further analysis. For CF elimination (P10-P12 mice), experimental tissue was prepared in a similar way. We systematically scanned the granule cell layer to elicit CF responses and recorded PC responses at −20 mV holding potential to prevent voltage escape during the CF-evoked EPSCs.
The synaptic plasticity protocols for inducing LTP and long-term depression (LTD) were applied to lobules 5/6. In short, for synaptic plasticity all recordings were done in voltage-clamp, except for the tetanus, which consisted of 8 pulses of PF-stimulation at 100 Hz for 5 min (21 ± 1°C, LTP) or single-pulsed PF + CF stimulation (5 ms interval) at 1 Hz for 5 min (34 ± 1°C, LTD). We evaluated the synaptic plasticity by the change in PF-EPSC (baseline at 0.05 Hz) relative to the mean value calculated during the last 5 min pre-tetanus. For the FSK-dependent LTP induction we added FSK dissolved in DMSO to the ACSF up to a concentration of 50 μM FSK.
Cell-attached (CA) recordings were made using similar patch pipettes as in the previously described experiments, and using ACSF as an internal solution. Recordings were made in voltage clamp mode in lobules I-III and lobule X of the vermal cerebellum to allow a comparison between anterior and posterior activity, respectively. Spontaneous spiking rates were recorded in the presence of PTX, NBQX and APV, in order to eliminate synaptic input. Intrinsic excitability was measured using sequential current injections in current clamp mode. Cells were held at a holding current equivalent to a −65 mV holding potential, and injected with 500 ms long current pulses ranging from −100 pA to +1000 pA, relative to the holding current, in 100 pA increments (5 s inter-sweep interval).
In vivo electrophysiology
In vivo recordings were performed as recently described (Zhou et al., 2015). In short, an immobilizing pedestal was fixed on the skull (see for details the section on “compensatory eye movements” below) and a craniotomy (Ø 1 mm) was performed on the occipital bone under general anesthesia with an isoflurane/O2 mixture (5% induction, 1.5 – 2.0% maintenance). The craniotomy was protected by a recording chamber made with Charisma (Heraeus Kulzer, Germany) and closed with bone wax. After 3 days of recovery mice were head-fixed to a head bar and the body was restrained in a custom-made tube for electrophysiological recordings. PCs were recorded from vermal lobules I–III (pitch angle: −40°) and X (pitch angle: −65°) using borosilicate glass pipettes (OD 1.5 mm, ID 0.86 mm, Sutter Instruments, USA) mounted on a digital 3-axis drive (SM-5, Luigs & Neumann, Germany). PCs were identified by the presence of simple and complex spikes, and determined to be from a single unit by confirming that each complex spike was followed by a CF pause. All in vivo recordings were recorded amplified, filtered and digitized (Axon Multiclamp 700B, CED Power1401) and were analyzed offline using Spiketrain (Neurasmus BV, Rotterdam, the Netherlands, www.neurasmus.com), running under MATLAB (Mathworks, MA, USA). For each cell the firing rate, CV and mean CV2 were determined for simple and complex spikes, as well as the CF pause. The CV is calculated by dividing the s.d. by the mean of the interspike intervals, whereas CV2 is calculated as 2 x |ISIn+1−ISIn|/(ISIn+1+ISIn). Both are measures for the regularity of the firing, with CV reflecting that of the entire recording and mean CV2 that of adjacent intervals, making the latter a measure of regularity on small timescales. The CF pause is determined as the duration between a complex spike and the first following simple spike.
Compensatory eye movements
Mice between 6 and 12 weeks of age were prepared for head-restrained recordings of compensatory eye movements. These types of recordings have been described in detail previously (Schonewille et al., 2010). In order to head restrain the mice during the eye movement task a small pedestal was attached using Optibond primer and adhesive (Kerr, Bioggio, Switzerland) under isoflurane anesthesia (induction with 4% and maintained at 1.5% concentration). After a recovery period of two to three days the mouse head was restrained by fixation with screws on the pedestal at the experimental setup. A round screen with a random dotted pattern (the drum) surrounded the mouse during the experiment. The optokinetic reflex (OKR), vestibulo-ocular reflex (VOR) and the light guided vestibulo-ocular reflex (VVOR) were induced using a sinusoidal rotation of the drum (OKR) in light, rotation of the table in the dark (VOR) or the rotation of the table and drum (VVOR) in the light. The motor behavior was assessed by rotating the table and/or drum at 0.1 to 1 Hz with a fixed 5° amplitude. In order to evaluate motor learning, a mismatch between visual and vestibular input was created. Rotating both the visual and vestibular stimuli in phase (at the same amplitude) induced a decrease of gain; rotating the drum at greater amplitude relative to the table induced the so-called phase reversal of the VOR (day 1, 5°; day 2, 7.5°; day 3 – 4, 10°). Both training protocols were induced at 0.6 Hz with table rotation amplitude of 5°. For eye illumination during the experiments two table fixed infrared emitters (output 600 mW, dispersion angle 7°, peak wavelength 880 nm) and a third emitter, which produced the tracked corneal reflection (CR), were mounted to the camera and aligned horizontally with the optical axis of the camera. The movements of the eyes were recorded with eye-tracking software (ETL-200, ISCAN systems, Burlington, NA, USA). Gain and phase values of eye movements were calculated using MATLAB (MathWorksInc, City, Country).
Eyeblink conditioning
Shisa6L7 KO mice and control mice were anesthetized with an isoflurane/oxygen mixture (5% for induction, 1.5 – 2% for maintenance). After a local scalp injection of bupivacaine hydrochloride (2.5 mg/ml, Bupivacaine Actavis) we made a sagittal scalp incision of 2 – 3 cm length. Next, we carefully removed the exposed periosteum and further scratched the skull using an etchant gel (Kerr, Bioggio, Switzerland). After this, we placed a construct allowing head-fixation using Optibond primer and adhesive (Kerr, Bioggio, Switzerland) and Charisma (Heraeus Kulzer, Armonk, NY, USA). After surgery, mice had 3 – 5 days to recover.
All behavioral experiments were conducted using head-fixed mice that were placed on top of a cylindrical treadmill on which they were allowed to walk freely. The treadmill consisted of a foam roller (diameter 15 cm, width 12 cm; Exervo, TeraNova EVA) with a horizontal metal rod through the axis that was connected with a ball bearing construction to two solid vertical metal poles. A horizontal messing bar was fixated to the same vertical poles at 3-5 cm above the treadmill. Mice were head-fixed to this bar using 1 screw and 2 pins, thereby ensuring perfect head-fixation. This entire setup was placed in a sound- and light-isolating chamber. National Instruments (NI-PXI) processors were used to control experimental parameters and to acquire the eyelid position signal. Eyelid movements were recorded with the magnetic distance measurement technique (MDMT), which makes use of an NVE GMR magnetometer, positioned above the upper left eyelid, that measures movements of a minuscule magnet (1.5 × 0.7 × 0.5 mm) that is placed on the lower eyelid of the animal with superglue (cyanoacrylate). This way, MDMT allows high spatio-temporal detection of eyeblink kinematics(Koekkoek et al., 2002). The unconditioned stimulus (US) consisted of a weak air-puff applied to the eye (30 psi, 10 ms duration), which was controlled by an API MPPI-3 pressure injector, and delivered via a 27.5 gauge needle that was perpendicularly positioned at 0.5 – 1 cm from the center of the left cornea. Prior to training the experimenter always carefully inspected whether the needle opening was positioned exactly perpendicular to the center of the mouse’s cornea so that the air puff would hit the cornea and not too much the surrounding areas and would thus elicit reliable reflexive eyeblinks. The conditional stimulus (CS) was a green LED light (CS duration 260 ms, LED diameter 5 mm) placed 10 cm in front of the mouse’s head. Because we performed our experiments in almost complete darkness this small LED light was a salient stimulus, which could be easily detected by both eyes. The training consisted of 2 daily habituation sessions, 1 baseline measurement and 6 daily acquisition sessions. During the habituation sessions, mice were placed in the setup for 30 – 45 min, during which the air puff needle (for US delivery) and green LED (for CS delivery) were positioned properly but no stimuli were presented. On the day of acquisition session 1, each animal first received 20 CS-only trials as a baseline measure, to establish that the CS did not elicit any reflexive eyelid closure. During each daily acquisition session, animals received 200 paired CS-US trials and 20 CS only trials. The interval between the onset of CS and that of US was set at 250 ms. Because of the inherent delay in the delivery of air puff of 14 ms, we triggered the air puff at 236 ms after CS onset so that it would hit the cornea exactly at 250 ms after CS onset. The inter-trial interval was set according to the following constraints: at least 10 s had to elapse, the eyelid had to be open below a predetermined threshold, and eyelid position had to be stable for at least 1 s for a trial to begin. During all training sessions, the experimenter carefully inspected threshold and stability parameters and adjusted them if necessary. All experiments were performed at approximately the same time of day by the same experimenter.
Individual eyeblink traces were analyzed automatically with custom software (LabVIEW or MATLAB) in a five-step process. First, trials with significant activity in the 500 ms pre-CS period were regarded as invalid for further analysis. Second, trials were normalized by aligning the 500 ms pre-CS baselines and calculating the averaged UR amplitude in Volts per session. The voltage corresponding with a full closure was further used in the analysis of the eyeblink traces as the 100% value reflecting full eyelid closure (±1 mm movement), and other values like CR amplitude were expressed relative to this 100% value. Third, in valid normalized CS-only trials, eyelid movements larger than 5% of the 500 ms pre-CS period and with a latency to CR onset between 10 – 250 ms and a latency to CR peak of 25 – 500 ms (both relative to CS onset) were considered as conditioned responses (CRs). Fourth, based on this trial-by-trial analysis we calculated for each session per mouse (1) the percentage of eyeblink CRs, (2) the averaged amplitude in the CS-US interval (based on all valid trials and not thus only for trials in which a CR was present), and (3) timing parameters such as latency to CR onset and latency to CR peak time relative to CS onset (based on only these trials wherein a CR is present). Fifth, we calculated group averages (Shisa6L7 KO versus controls) for the same parameters (1 – 3) and determined statistically significant differences using Repeated-measures ANOVA. Data was considered statistically significant if p < 0.05.
Griptest
The strength of the mice was determined using a grip test. By placing the forepaws of a grid attached to a force gauge (BIOSEB, Chaville, France) and steadily pulling the mice by the tail. The grip strength was defined as the maximum weight pulled before releasing the grid. The test was performed over the course of four consecutive days.
Rotarod
Mice were trained to walk on the accelerating Rotarod (Ugo Basile, Comerio Varese, Italy). The Rotarod consisted of a cylinder with a diameter of 3 cm. The starting speed of the Rotarod was 3 rotations per minute (rpm) and was set to a maximum of 40 rpm in 270 s. The maximum walking time on the rotarod was 300 s. Latency to fall was recorded on the moment the mouse fell down or clang to the rod for three turns. This experiment consisted of four days with four daily turns on the Rotarod. On the fifth day there was an additional trial set to 80 rpm. The interval between each turn was 1 h.
Balance Beam
The Balance Beam is a small rod with a diameter of 12 or 6 mm. The Balance Beam was elevated to 43 cm with two steel rods at both ends. The home cage of the animal was placed at the end of the rod. Mice were placed on the beam and had to walk from one end of the beam to the other end where their home cage was located. The length of this trajectory was 80 cm. We measured the time it took for the mice to cross the beam. In addition, we analyzed video material to inspect if the mice presented with misstep behavior.
ErasmusLadder
Mice were tested on ErasmusLadder (Noldus, Wageningen, NL). The ErasmusLadder is a fully automated system consisting of a horizontal ladder between two shelter boxes. It has 37 rungs on each side of the ladder and all the rungs are attached to custom-made pressure sensors that are continuously monitored (Vinueza Veloz et al., 2015). In the current study, mice were tested in 5 daily sessions, during which mice were trained to walk between two shelter boxes for 50 trials each day. Step length and step time were defined as the distance and time between two consecutive touches from the right front limb, respectively.
Quantification and Statistical Analysis
All statistical analyses were performed using SPSS, Python, R or Graphpad Prism. Data in the figures is presented as mean ± SEM. Sample sizes (n) are present in all Figure legends. The p values are indicated in the results section. Mean ± SD, Brown-Forsythe tests for homogeneity of variances, type of statistical analysis, test-statistics and exact p values are reported in data Table S3. Extensive statistics related to Figures 2 and 3 are reported in additional data Tables S1 and S2. All statistical analyses of the SWATH data were performed on Log2-transformed data (see additional data Table S2). Non-parametric analysis of longitudinal factorial data was performed using the nparLD package for R (Noguchi et al., 2012).
Linear mixed models were performed using the lme4 (Bates et al., 2015) and lmerTest (Kuznetsova et al., 2017) packages in R. GluA2 and GluA3 enrichment in P2 and PSD fractions was tested using a directional one-tailed independent t test, as our hypothesis based on the SWATH-MS data was whether enrichment was reduced in the Shisa6L7 KO mice. All other tests utilized two-tailed tests.
Acknowledgments
We would like to express our gratitude for excellent technical assistance by Elize Haasdijk, Mandy Rutteman, and Laura Post. Financial support for C.I.D.Z. was provided by the Netherlands Organisation for Scientific Research (NWO-ALW), the Dutch Organization for Medical Sciences (ZonMW), ERC-adv, ERC-POC, EU-LISTEN, Medical NeuroDelta, and INTENSE (NWO-LSH). R.V.K. was funded by NWO-ALW grant (ALW2PJ/12048), S.S. by an NWO VICI grant (ALW-Vici 016.150.673/865.14.002), and M.S. by an ERC-StG grant (680235).
Author Contributions
Conceptualization, S.P., B.H.A.U., R.V.K., S.S., A.B.S., and C.I.D.Z.; Methodology, S.P., B.H.A.U., R.V.K., B.W., J.A.S., H.-J.B., and M.S.; Validation, S.P., B.H.A.U., and R.V.K.; Formal Analysis, B.H.A.U., S.P., and R.V.K.; Investigation, S.P., B.H.A.U., R.V.K., B.W., J.A.S., H.-J.B., and S.A.; Resources, A.B.H., S.S., A.B.S., and C.I.D.Z.; Data Curation, B.H.A.U., S.P., R.V.K., and M.S.; Writing – Original Draft, S.P. and B.H.A.U.; Writing – Review & Editing, S.P., B.H.A.U., R.V.K., M.S., F.E.H., S.S., A.B.S., and C.I.D.Z; Supervision, S.S., A.B.S., and C.I.D.Z.
Declaration of Interests
A.B.S. participates in a holding that owns shares of Sylics BV.
Published: April 14, 2020
Footnotes
Supplemental Information can be found online at https://doi.org/10.1016/j.celrep.2020.03.079.
Contributor Information
August B. Smit, Email: guus.smit@vu.nl.
Chris I. De Zeeuw, Email: c.dezeeuw@erasmusmc.nl.
Supplemental Information
Statistical Analysis of Mass Spectrometry IP Data, Related to Figure 2
Statistical Analysis of SWATH MS Data, Related to Figure 3
Summary of Extensive Statistics, Related to Figures 1, 2, 3, 4, 5, 6, and S1–S4
References
- Barski J.J., Dethleffsen K., Meyer M. Cre recombinase expression in cerebellar Purkinje cells. Genesis. 2000;28:93–98. [PubMed] [Google Scholar]
- Bates D., Mächler M., Bolker B., Walker S. Fitting linear mixed-effects models using lme4. J. Stat. Softw. 2015;67 [Google Scholar]
- Bruderer R., Bernhardt O.M., Gandhi T., Miladinović S.M., Cheng L.Y., Messner S., Ehrenberger T., Zanotelli V., Butscheid Y., Escher C. Extending the limits of quantitative proteome profiling with data-independent acquisition and application to acetaminophen-treated three-dimensional liver microtissues. Mol. Cell. Proteomics. 2015;14:1400–1410. doi: 10.1074/mcp.M114.044305. [DOI] [PMC free article] [PubMed] [Google Scholar]
- Chen L., Chetkovich D.M., Petralia R.S., Sweeney N.T., Kawasaki Y., Wenthold R.J., Bredt D.S., Nicoll R.A. Stargazin regulates synaptic targeting of AMPA receptors by two distinct mechanisms. Nature. 2000;408:936–943. doi: 10.1038/35050030. [DOI] [PubMed] [Google Scholar]
- Chen N., Pandya N.J., Koopmans F., Castelo-Székelv V., van der Schors R.C., Smit A.B., Li K.W. Interaction proteomics reveals brain region-specific AMPA receptor complexes. J. Proteome Res. 2014;13:5695–5706. doi: 10.1021/pr500697b. [DOI] [PubMed] [Google Scholar]
- Chen X., Aslam M., Gollisch T., Allen K., von Engelhardt J. CKAMP44 modulates integration of visual inputs in the lateral geniculate nucleus. Nat. Commun. 2018;9:261. doi: 10.1038/s41467-017-02415-1. [DOI] [PMC free article] [PubMed] [Google Scholar]
- Cox J., Mann M. MaxQuant enables high peptide identification rates, individualized p.p.b.-range mass accuracies and proteome-wide protein quantification. Nat. Biotechnol. 2008;26:1367–1372. doi: 10.1038/nbt.1511. [DOI] [PubMed] [Google Scholar]
- De Zeeuw C.I., Ten Brinke M.M. Motor Learning and the Cerebellum. Cold Spring Harb. Perspect. Biol. 2015;7:a021683. doi: 10.1101/cshperspect.a021683. [DOI] [PMC free article] [PubMed] [Google Scholar]
- De Zeeuw C.I., Hoebeek F.E., Bosman L.W., Schonewille M., Witter L., Koekkoek S.K. Spatiotemporal firing patterns in the cerebellum. Nat. Rev. Neurosci. 2011;12:327–344. doi: 10.1038/nrn3011. [DOI] [PubMed] [Google Scholar]
- Farrow P., Khodosevich K., Sapir Y., Schulmann A., Aslam M., Stern-Bach Y., Monyer H., von Engelhardt J. Auxiliary subunits of the CKAMP family differentially modulate AMPA receptor properties. eLife. 2015;4:e09693. doi: 10.7554/eLife.09693. [DOI] [PMC free article] [PubMed] [Google Scholar]
- Galliano E., Gao Z., Schonewille M., Todorov B., Simons E., Pop A.S., D’Angelo E., van den Maagdenberg A.M.J.M., Hoebeek F.E., De Zeeuw C.I. Silencing the majority of cerebellar granule cells uncovers their essential role in motor learning and consolidation. Cell Rep. 2013;3:1239–1251. doi: 10.1016/j.celrep.2013.03.023. [DOI] [PubMed] [Google Scholar]
- Gao Z., van Beugen B.J., De Zeeuw C.I. Distributed synergistic plasticity and cerebellar learning. Nat. Rev. Neurosci. 2012;13:619–635. doi: 10.1038/nrn3312. [DOI] [PubMed] [Google Scholar]
- Geyer P.E., Wewer Albrechtsen N.J., Tyanova S., Grassl N., Iepsen E.W., Lundgren J., Madsbad S., Holst J.J., Torekov S.S., Mann M. Proteomics reveals the effects of sustained weight loss on the human plasma proteome. Mol. Syst. Biol. 2016;12:901. doi: 10.15252/msb.20167357. [DOI] [PMC free article] [PubMed] [Google Scholar]
- Gonshor A., Jones G.M. Extreme vestibulo-ocular adaptation induced by prolonged optical reversal of vision. J. Physiol. 1976;256:381–414. doi: 10.1113/jphysiol.1976.sp011330. [DOI] [PMC free article] [PubMed] [Google Scholar]
- Greger I.H., Watson J.F., Cull-Candy S.G. Structural and Functional Architecture of AMPA-Type Glutamate Receptors and Their Auxiliary Proteins. Neuron. 2017;94:713–730. doi: 10.1016/j.neuron.2017.04.009. [DOI] [PubMed] [Google Scholar]
- Gutierrez-Castellanos N., Da Silva-Matos C.M., Zhou K., Canto C.B., Renner M.C., Koene L.M.C., Ozyildirim O., Sprengel R., Kessels H.W., De Zeeuw C.I. Motor Learning Requires Purkinje Cell Synaptic Potentiation through Activation of AMPA-Receptor Subunit GluA3. Neuron. 2017;93:409–424. doi: 10.1016/j.neuron.2016.11.046. [DOI] [PMC free article] [PubMed] [Google Scholar]
- Hansel C., de Jeu M., Belmeguenai A., Houtman S.H., Buitendijk G.H., Andreev D., De Zeeuw C.I., Elgersma Y. alphaCaMKII Is essential for cerebellar LTD and motor learning. Neuron. 2006;51:835–843. doi: 10.1016/j.neuron.2006.08.013. [DOI] [PubMed] [Google Scholar]
- Hashimoto K., Fukaya M., Qiao X., Sakimura K., Watanabe M., Kano M. Impairment of AMPA receptor function in cerebellar granule cells of ataxic mutant mouse stargazer. J. Neurosci. 1999;19:6027–6036. doi: 10.1523/JNEUROSCI.19-14-06027.1999. [DOI] [PMC free article] [PubMed] [Google Scholar]
- Hoebeek F.E., Stahl J.S., van Alphen A.M., Schonewille M., Luo C., Rutteman M., van den Maagdenberg A.M., Molenaar P.C., Goossens H.H., Frens M.A., De Zeeuw C.I. Increased noise level of purkinje cell activities minimizes impact of their modulation during sensorimotor control. Neuron. 2005;45:953–965. doi: 10.1016/j.neuron.2005.02.012. [DOI] [PubMed] [Google Scholar]
- Huettner J.E. TARPs and AMPA Receptors: Function Follows Form. Neuron. 2017;93:989–991. doi: 10.1016/j.neuron.2017.02.040. [DOI] [PubMed] [Google Scholar]
- Jirenhed D.A., Bengtsson F., Hesslow G. Acquisition, extinction, and reacquisition of a cerebellar cortical memory trace. J. Neurosci. 2007;27:2493–2502. doi: 10.1523/JNEUROSCI.4202-06.2007. [DOI] [PMC free article] [PubMed] [Google Scholar]
- Klaassen R.V., Stroeder J., Coussen F., Hafner A.S., Petersen J.D., Renancio C., Schmitz L.J., Normand E., Lodder J.C., Rotaru D.C. Shisa6 traps AMPA receptors at postsynaptic sites and prevents their desensitization during synaptic activity. Nat. Commun. 2016;7:10682. doi: 10.1038/ncomms10682. [DOI] [PMC free article] [PubMed] [Google Scholar]
- Koekkoek S.K., Den Ouden W.L., Perry G., Highstein S.M., De Zeeuw C.I. Monitoring kinetic and frequency-domain properties of eyelid responses in mice with magnetic distance measurement technique. J. Neurophysiol. 2002;88:2124–2133. doi: 10.1152/jn.2002.88.4.2124. [DOI] [PubMed] [Google Scholar]
- Kuznetsova A., Brockhoff P.B., Christensen R.H.B. lmerTest package: tests in linear mixed effects models. J. Stat. Softw. 2017;82 [Google Scholar]
- Lein E.S., Hawrylycz M.J., Ao N., Ayres M., Bensinger A., Bernard A., Boe A.F., Boguski M.S., Brockway K.S., Byrnes E.J. Genome-wide atlas of gene expression in the adult mouse brain. Nature. 2007;445:168–176. doi: 10.1038/nature05453. [DOI] [PubMed] [Google Scholar]
- Ly R., Bouvier G., Schonewille M., Arabo A., Rondi-Reig L., Léna C., Casado M., De Zeeuw C.I., Feltz A. T-type channel blockade impairs long-term potentiation at the parallel fiber-Purkinje cell synapse and cerebellar learning. Proc. Natl. Acad. Sci. USA. 2013;110:20302–20307. doi: 10.1073/pnas.1311686110. [DOI] [PMC free article] [PubMed] [Google Scholar]
- MacLean D.M., Ramaswamy S.S., Du M., Howe J.R., Jayaraman V. Stargazin promotes closure of the AMPA receptor ligand-binding domain. J. Gen. Physiol. 2014;144:503–512. doi: 10.1085/jgp.201411287. [DOI] [PMC free article] [PubMed] [Google Scholar]
- Makino H., Malinow R. Compartmentalized versus global synaptic plasticity on dendrites controlled by experience. Neuron. 2011;72:1001–1011. doi: 10.1016/j.neuron.2011.09.036. [DOI] [PMC free article] [PubMed] [Google Scholar]
- Nabavi S., Fox R., Proulx C.D., Lin J.Y., Tsien R.Y., Malinow R. Engineering a memory with LTD and LTP. Nature. 2014;511:348–352. doi: 10.1038/nature13294. [DOI] [PMC free article] [PubMed] [Google Scholar]
- Nguyen-Vu T.D., Kimpo R.R., Rinaldi J.M., Kohli A., Zeng H., Deisseroth K., Raymond J.L. Cerebellar Purkinje cell activity drives motor learning. Nat. Neurosci. 2013;16:1734–1736. doi: 10.1038/nn.3576. [DOI] [PMC free article] [PubMed] [Google Scholar]
- Noguchi K., Gel Y.R., Brunner E., Konietschke F. nparLD: an R software package for the nonparametric analysis of longitudinal data in factorial experiments. J. Stat. Softw. 2012;50 [Google Scholar]
- Pei J., Grishin N.V. Unexpected diversity in Shisa-like proteins suggests the importance of their roles as transmembrane adaptors. Cell. Signal. 2012;24:758–769. doi: 10.1016/j.cellsig.2011.11.011. [DOI] [PMC free article] [PubMed] [Google Scholar]
- Pernía-Andrade A.J., Goswami S.P., Stickler Y., Fröbe U., Schlögl A., Jonas P. A deconvolution-based method with high sensitivity and temporal resolution for detection of spontaneous synaptic currents in vitro and in vivo. Biophys. J. 2012;103:1429–1439. doi: 10.1016/j.bpj.2012.08.039. [DOI] [PMC free article] [PubMed] [Google Scholar]
- Peter S., Ten Brinke M.M., Stedehouder J., Reinelt C.M., Wu B., Zhou H., Zhou K., Boele H.J., Kushner S.A., Lee M.G. Dysfunctional cerebellar Purkinje cells contribute to autism-like behaviour in Shank2-deficient mice. Nat. Commun. 2016;7:12627. doi: 10.1038/ncomms12627. [DOI] [PMC free article] [PubMed] [Google Scholar]
- R Core Development Team . 2013. R: A language and environment for statistical computing.https://www.r-project.org/ [Google Scholar]
- Renner M.C., Albers E.H., Gutierrez-Castellanos N., Reinders N.R., van Huijstee A.N., Xiong H., Lodder T.R., Kessels H.W. Synaptic plasticity through activation of GluA3-containing AMPA-receptors. eLife. 2017;6:e25462. doi: 10.7554/eLife.25462. [DOI] [PMC free article] [PubMed] [Google Scholar]
- Schindelin J., Arganda-Carreras I., Frise E., Kaynig V., Longair M., Pietzsch T., Preibisch S., Rueden C., Saalfeld S., Schmid B. Fiji: an open-source platform for biological-image analysis. Nat. Methods. 2012;9:676–682. doi: 10.1038/nmeth.2019. [DOI] [PMC free article] [PubMed] [Google Scholar]
- Schmitz L.J.M., Klaassen R.V., Ruiperez-Alonso M., Zamri A.E., Stroeder J., Rao-Ruiz P., Lodder J.C., van der Loo R.J., Mansvelder H.D., Smit A.B., Spijker S. The AMPA receptor-associated protein Shisa7 regulates hippocampal synaptic function and contextual memory. eLife. 2017;6:e24192. doi: 10.7554/eLife.24192. [DOI] [PMC free article] [PubMed] [Google Scholar]
- Schonewille M., Belmeguenai A., Koekkoek S.K., Houtman S.H., Boele H.J., van Beugen B.J., Gao Z., Badura A., Ohtsuki G., Amerika W.E. Purkinje cell-specific knockout of the protein phosphatase PP2B impairs potentiation and cerebellar motor learning. Neuron. 2010;67:618–628. doi: 10.1016/j.neuron.2010.07.009. [DOI] [PMC free article] [PubMed] [Google Scholar]
- Smyth G.K. Limma: linear models for microarray data. In: Carey R.J., Rafael W.H., Irizarry A., Dudoit S., editors. Bioinformatics and computational biology solutions using R and Bioconductor. Springer; 2005. pp. 397–420. [Google Scholar]
- Suvrathan A., Raymond J.L. Depressed by Learning-Heterogeneity of the Plasticity Rules at Parallel Fiber Synapses onto Purkinje Cells. Cerebellum. 2018;17:747–755. doi: 10.1007/s12311-018-0968-8. [DOI] [PMC free article] [PubMed] [Google Scholar]
- Suvrathan A., Payne H.L., Raymond J.L. Timing Rules for Synaptic Plasticity Matched to Behavioral Function. Neuron. 2016;92:959–967. doi: 10.1016/j.neuron.2016.10.022. [DOI] [PMC free article] [PubMed] [Google Scholar]
- Takamiya K., Mao L., Huganir R.L., Linden D.J. The glutamate receptor-interacting protein family of GluR2-binding proteins is required for long-term synaptic depression expression in cerebellar Purkinje cells. J. Neurosci. 2008;28:5752–5755. doi: 10.1523/JNEUROSCI.0654-08.2008. [DOI] [PMC free article] [PubMed] [Google Scholar]
- ten Brinke M.M., Boele H.J., Spanke J.K., Potters J.W., Kornysheva K., Wulff P., IJpelaar A.C., Koekkoek S.K., De Zeeuw C.I. Evolving Models of Pavlovian Conditioning: Cerebellar Cortical Dynamics in Awake Behaving Mice. Cell Rep. 2015;13:1977–1988. doi: 10.1016/j.celrep.2015.10.057. [DOI] [PMC free article] [PubMed] [Google Scholar]
- Tomita S., Adesnik H., Sekiguchi M., Zhang W., Wada K., Howe J.R., Nicoll R.A., Bredt D.S. Stargazin modulates AMPA receptor gating and trafficking by distinct domains. Nature. 2005;435:1052–1058. doi: 10.1038/nature03624. [DOI] [PubMed] [Google Scholar]
- van Beugen B.J., Gao Z., Boele H.J., Hoebeek F., De Zeeuw C.I. High frequency burst firing of granule cells ensures transmission at the parallel fiber to purkinje cell synapse at the cost of temporal coding. Front. Neural Circuits. 2013;7:95. doi: 10.3389/fncir.2013.00095. [DOI] [PMC free article] [PubMed] [Google Scholar]
- Vinueza Veloz M.F., Zhou K., Bosman L.W.J., Potters J.-W., Negrello M., Seepers R.M., Strydis C., Koekkoek S.K.E., De Zeeuw C.I. Cerebellar control of gait and interlimb coordination. Brain Struct. Funct. 2015;220:3513–3536. doi: 10.1007/s00429-014-0870-1. [DOI] [PMC free article] [PubMed] [Google Scholar]
- von Engelhardt J., Mack V., Sprengel R., Kavenstock N., Li K.W., Stern-Bach Y., Smit A.B., Seeburg P.H., Monyer H. CKAMP44: a brain-specific protein attenuating short-term synaptic plasticity in the dentate gyrus. Science. 2010;327:1518–1522. doi: 10.1126/science.1184178. [DOI] [PubMed] [Google Scholar]
- Walter J.T., Alviña K., Womack M.D., Chevez C., Khodakhah K. Decreases in the precision of Purkinje cell pacemaking cause cerebellar dysfunction and ataxia. Nat. Neurosci. 2006;9:389–397. doi: 10.1038/nn1648. [DOI] [PubMed] [Google Scholar]
- Wiśniewski J.R., Zougman A., Nagaraj N., Mann M. Universal sample preparation method for proteome analysis. Nat. Methods. 2009;6:359–362. doi: 10.1038/nmeth.1322. [DOI] [PubMed] [Google Scholar]
- Wulff P., Schonewille M., Renzi M., Viltono L., Sassoè-Pognetto M., Badura A., Gao Z., Hoebeek F.E., van Dorp S., Wisden W. Synaptic inhibition of Purkinje cells mediates consolidation of vestibulo-cerebellar motor learning. Nat. Neurosci. 2009;12:1042–1049. doi: 10.1038/nn.2348. [DOI] [PMC free article] [PubMed] [Google Scholar]
- Yamazaki M., Le Pichon C.E., Jackson A.C., Cerpas M., Sakimura K., Scearce-Levie K., Nicoll R.A. Relative contribution of TARPs γ-2 and γ-7 to cerebellar excitatory synaptic transmission and motor behavior. Proc. Natl. Acad. Sci. USA. 2015;112:E371–E379. doi: 10.1073/pnas.1423670112. [DOI] [PMC free article] [PubMed] [Google Scholar]
- Zhou H., Voges K., Lin Z., Ju C., Schonewille M. Differential Purkinje cell simple spike activity and pausing behavior related to cerebellar modules. J. Neurophysiol. 2015;113:2524–2536. doi: 10.1152/jn.00925.2014. [DOI] [PMC free article] [PubMed] [Google Scholar]
Associated Data
This section collects any data citations, data availability statements, or supplementary materials included in this article.
Supplementary Materials
Statistical Analysis of Mass Spectrometry IP Data, Related to Figure 2
Statistical Analysis of SWATH MS Data, Related to Figure 3
Summary of Extensive Statistics, Related to Figures 1, 2, 3, 4, 5, 6, and S1–S4
Data Availability Statement
The data that support the findings of this study are available from the corresponding author(s) upon reasonable request.