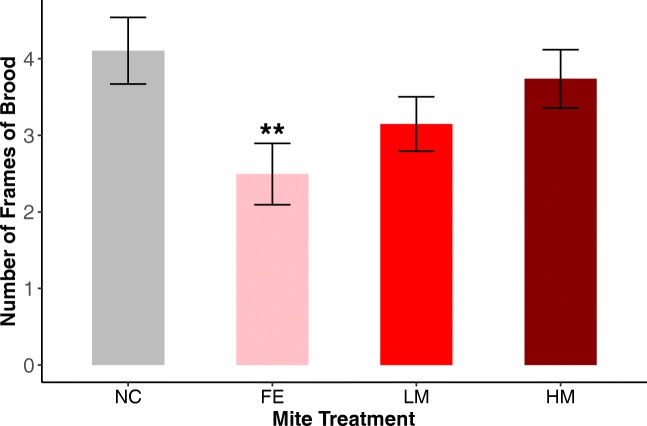
Figure 2.
Number of frames of brood by treatment over the course of the experiment (NC = Negative Control, FE = Feral, LM = Lightly Managed, HM = Heavily Managed). A GEE model found significantly (Wald = 8.27, P = 0.0040) fewer frames of brood in the colonies inoculated with mites from a feral background. Note that the trend in the experimental treatment groups is opposite to what we predicted. Error bars represent SEM.

