

Abstract
Alzheimer’s disease (AD) is characterized by the presence of proteinaceous brain deposits, brain atrophy, vascular dysfunction, and chronic inflammation. Along with cerebral inflammation, peripheral inflammation is also evident in many AD patients. Bradykinin, a proinflammatory plasma peptide, is also linked to AD pathology. For example, bradykinin infusion into the hippocampus causes learning and memory deficits in rats, and blockade of the bradykinin receptor lessens cognitive impairment in AD mouse models. Even though it has been hypothesized that plasma bradykinin could contribute to inflammation in AD, the level of plasma bradykinin and its association with beta-amyloid (Aβ) pathology in AD patients had not been explored. Here, we assessed plasma bradykinin levels in AD patients and age-matched non-demented (ND) control individuals. We found significantly elevated plasma bradykinin levels in AD patients compared to ND subjects. Additionally, changes in plasma bradykinin levels were more profound in many AD patients with severe cognitive impairment, suggesting that peripheral bradykinin could play a role in dementia most likely via inflammation. Bradykinin levels in the cerebrospinal fluid (CSF) were reduced in AD patients and exhibited an inverse correlation with the CSF Aβ40/Aβ42 ratio. We also report that bradykinin interacts with the fibrillar form of Aβ and co-localizes with Aβ plaques in the post-mortem human AD brain. These findings connect the peripheral inflammatory pathway to cerebral abnormalities and identify a novel mechanism of inflammatory pathology in AD.
Keywords: Beta-amyloid, Alzheimer’s disease, contact activation system, inflammation, bradykinin, high molecular weight kininogen, cognitive impairment
Introduction
Alzheimer’s disease (AD), a severe neurodegenerative disorder, is characterized by progressive loss of cognitive function (Qiu et al., 2009). The mechanisms causing neuronal dysfunction in AD are still not clear, but there is a growing understanding that vascular factors play a crucial role (Strickland, 2018; Sweeney et al., 2019). For example, perturbations in the circulatory system, including the clotting and fibrinolytic pathways, are present in most AD patients and mouse model (Cortes-Canteli et al., 2015; Cortes-Canteli et al., 2012; Cruz Hernandez et al., 2019; de la Torre, 2004; Humpel, 2011; Suidan et al., 2018). Moreover, studies have shown that deposition of fibrin, the main protein component of blood clots, plays a significant role in AD progression in mice (Akassoglou and Strickland, 2002; Cortes-Canteli et al., 2015; Cortes-Canteli et al., 2010; Cortes-Canteli et al., 2012; Davalos and Akassoglou, 2012). Fibrin is a proinflammatory molecule (Davalos and Akassoglou, 2012; Flick et al., 2007), and its deposits in the AD brain can lead to chronic inflammation (Cortes-Canteli et al., 2015).
Dysregulation of the contact activation system and increased plasma kallikrein have been proposed as inflammatory contributors in AD pathophysiology (Strickland, 2018; Viel and Buck, 2011; Zamolodchikov et al., 2015). Triggering the contact activation system releases bradykinin upon cleavage of high molecular weight kininogen (HK) (Long et al., 2016). Bradykinin and its metabolites, known for their proinflammatory and vasoactive properties (Golias et al., 2007), exert their effects through activation of G-coupled receptors, namely kinin B1 (B1R) and kinin B2 (B2R) (Golias et al., 2007). It has been shown that bradykinin infusion into the hippocampus causes learning and memory deficits in rats (Wang and Wang, 2002). Additionally, pharmacological and genetic blockade of B1R minimizes the beta-amyloid (Aβ)-induced cognitive impairment in AD mice (Prediger et al., 2008). Likewise, B1R blockade protects mice from focal brain injury by reducing inflammation and blood brain barrier (BBB) disruption(Raslan et al., 2010), an abnormality observed in AD (Sweeney et al., 2018). B1R is also upregulated in the hippocampus and in reactive astrocytes surrounding Aβ plaques in the AD mouse brain (Lacoste et al., 2013), and bradykinin levels are increased in the cerebrospinal fluid (CSF) of mice after cerebral injection of Aβ (Iores-Marcal et al., 2006). Bradykinin may also be involved in the secretory processing of amyloid precursor protein (APP), the parent molecule of Aβ (Racchi et al., 1998). All these studies suggest that bradykinin could be directly or indirectly responsible for inflammation, as well as other pathologies, in AD. However, this conclusion is based on the results obtained from animal model studies rather than from AD patients. A recent study showed that the contact activation system, is dysregulated in AD patients (Strickland, 2018), yet the plasma bradykinin changes in AD patients have not been reported. Also, whether the bradykinin levels affect the Aβ-induced cognitive impairment in AD patients is not understood. To explore this hypothesis, we analyzed plasma samples from AD patients and age-matched non-demented (ND) individuals. We found that bradykinin levels were indeed significantly higher in AD plasma compared to that of ND cases. Furthermore, plasma bradykinin levels were more abundant in AD patients with severe cognitive impairment, suggesting that plasma bradykinin could contribute to dementia most likely via the inflammatory arm of contact activation system.
We also analyzed the CSF from AD patients and ND controls to determine CSF bradykinin levels. We found that AD CSF bradykinin level correlated with CSF Aβ40/Aβ42 ratio, an established biomarker of AD (Anoop et al., 2010). Using NMR spectroscopy and immunohistochemistry, we also examined the interaction of bradykinin with different species of Aβ42 and the association of bradykinin to Aβ plaques.
We believe that increased plasma bradykinin could enhance cerebral inflammation and contribute to BBB damage observed in AD, all of which could significantly impact the cognitive status of AD patients. Inflammation is now considered a central mechanism in AD, and this study strengthens the connection of the peripheral inflammatory pathway to cerebral inflammatory pathology in AD patients.
Materials and Methods
Human plasma and CSF
Experiments using de-identified human tissue, plasma, and CSF were reviewed and approved by The Rockefeller Institutional Review Board. Plasma and CSF from AD patients and ND controls were purchased from a biobank (PrecisionMed Inc., San Diego, CA) (Suidan et al., 2018). The biobank had obtained medical records for each volunteer, and donors underwent MRI and neurological screening following the criteria established by National Institute of Neurological and Communicative Disorders and Stroke and the Alzheimer’s Disease and Related Disorders Association (NINCDS-ADRDA) to classify patients as AD or ND. Table 1 lists characteristics of donors, including scores from mini mental state examinations (MMSE).
Table 1.
Characteristics of ND and AD individuals.
| Characteristics | ND | AD | p value |
|---|---|---|---|
| Plasma studies | |||
| Individuals, n | 32 | 39 | |
| Ethnicity | Caucasia n | Caucasia n | |
| Age (year) at blood draw, mean (SD) | 65.25 (4.2) | 66.82 (6.0) | p=0.22 |
| Disease duration (year), mean (SD) | - | 2.81 (2.42) | |
| Female, n | 17 | 19 | |
| Male, n | 15 | 20 | |
| MMSE score, mean (SD) | 29.75 (0.43) | 20.8 (3.86) | p<0.0001 |
| Vascular risk factor (VRF) status, n | 11 | 27 | |
| CSF studies | |||
| Individuals, n | 14 | 25 | |
| Ethnicity | Caucasia n | Caucasia n | |
| Age (year) at CSF draw, mean (SD) | 65.64 (5.3) | 67.48 (6.3) | p=0.36 |
| Disease duration (year), mean (SD) | - | 2.84 (2.13) | |
| Female, n | 7 | 13 | |
| Male, n | 7 | 12 | |
| MMSE score, mean (SD) | 29.7 (0.42) | 21.2 (3.8) | p<0.0001 |
| Vascular risk factor (VRF) status, n | 5 | 16 | |
| APOE status, E4 carrier, n | 3 | 17 | |
| CSF Aβ40/42 ratio, mean (SD) | 12.6 (5.8) | 21.7 (7.6) | p=0.0005 |
Post-mortem AD brain tissue
Human post-mortem brain tissue was obtained from the Harvard Brain Tissue Resource Center. Upon autopsy, the AD cases were classified as Braak stage 5. Blocks of frozen tissue from the superior frontal cortex (3 AD and 3 ND) were sliced by cryostat into 10 μm-thick sections and were used for immunofluorescence analysis.
Plasma and CSF Bradykinin ELISA
CSF and plasma bradykinin levels were quantified using the ELISA kit (ADI-900–206; Enzo Life Sciences), which detects bradykinin (100%) and Lys-Bradykinin (100%). Cross-reactivity for Les-Des-Arg9-Bradykinin and Bradykinin 1–5 (BK1–5) is negligible (<1% and <0.1%, respectively). The ELISA was performed as per manufacturer’s instructions. CSF samples (50 μl) were diluted in assay buffer (50 μl). Plasma samples were normally diluted 5–10-fold in assay buffer for ELISA. Some plasma samples, which showed very high bradykinin level were repeated with higher dilution in assay buffer (30–60-fold). All plasma samples were analyzed in duplicate in ELISA. For the Aβ42-induced plasma bradykinin release study, blood was drawn from healthy volunteers and plasma was prepared as described in (Yamamoto-Imoto et al., 2018). The plasma samples were incubated with and without 500 nM Aβ42 oligomers at 37°C for 2 hours prior to performing the ELISA.
Aβ expression, purification, and fibril formation for NMR spectroscopy
For NMR spectroscopy, Aβ was expressed and purified (Finder et al., 2010; Walti et al., 2016). Final Aβ peptide sequence contains the true 42 amino acid residues without containing methionine at the N-terminus. For the monomeric Aβ preparation, the lyophilized peptide was resuspended in phosphate buffer and dissolved by adding sodium hydroxide. The peptide solution was then sonicated on ice, centrifuged and filtered through a 0.22 μm syringe filter. Final pH of the peptide solution was adjusted to 7.4. For fibrillar Aβ, monomeric peptide was incubated at a concentration of 100 μM at 37°C with agitation for 3 days. The fibrils formed were centrifuged, and 10% of the fibrils were used as a seed for the 2nd round of fibril generation. Three rounds of seeding were carried out in total for homogeneous fibril formation.
Two-dimensional nuclear magnetic resonance (2D NMR) spectroscopy
The HSQC (Walti et al., 2016) spectra of 15N-Aβ42 (25 μM) in the presence and absence of equimolar concentration of bradykinin were recorded on a Bruker 700 MHz Avance III HD spectrometer with a cryogenic probe. The number of scans measured was 128 with 256 data point in the indirect dimension for each experiment to achieve a satisfactory signal-to-noise ratio. HSQC experiment was performed in phosphate buffer, pH 7.4 containing 3% D2O. The temperature was set to 278K to prevent possible aggregation of Aβ42 during the course of the measurement time. All NMR spectra were processed with TopSpin 3.2 (Bruker) and analyzed with Sparky.
Saturation transfer difference (STD)-NMR experiment
The STD experiment is performed in molar excess of ligand molecules(Mayer and Meyer, 2001). Aβ42 fibrils (25 μM) were mixed and incubated with bradykinin (1.25 mM) at room temperature. The reaction mixture was transferred to a 3 mm NMR tube, and the STD experiment was carried out to ascertain the bradykinin-Aβ fibril interaction. STD experiments were performed on a Bruker 700 MHz spectrometer. The interscan delay was set to 1.5 s with an additional 3 s of irradiation at −1 ppm and at 60 ppm with a train of 50 ms Gaussian pulses at 80 Hz power. The experiments were accumulated over 512 scans and processed in topspin with a quadratic sinus.
Immunofluorescence
Frozen human AD and ND brain sections (10 μm) were fixed in 4% paraformaldehyde and rinsed in PBS. Sections were blocked in PBS with 5% BSA, 0.01% triton-X100, rinsed in PBS, and incubated with a rabbit monoclonal anti-bradykinin (1:100) antibody (Biorbyt, orb184822). After overnight incubation, the sections were rinsed in PBS and incubated for 1 hour at RT with donkey anti-rabbit Alexa Fluor 488 (Covance) (1:1000). The sections were also stained with Congo Red as described previously (Cortes-Canteli et al., 2015). The tissue was incubated with 0.3 % Sudan Black B in 70% ethanol to block lipofuscin autofluorescence (Cortes-Canteli et al., 2015). Imaging was performed using Nikon inverted fluorescence microscope (Eclipse Ti2). Images (20X) were processed using NIH image J software.
Angiotensin converting enzyme (ACE) activity assay
The ACE activity in plasma and CSF samples was measured using ACE activity assay kit (CS0002, Sigma-Aldrich). The assay was performed as per manufacturer’s instruction. Briefly, for plasma ACE activity, 10 μl plasma was diluted in 40 μl assay buffer and 50 μl substrate was added. For CSF ACE activity, 20 μl CSF was diluted with 30 μl assay buffer and 50 μl substrate was added in 96-well fluorescence plate. The fluorescence emission was recorded at 405 nm (excitation at 320 nm) using a plate reader (Molecular Devices) at 37°C.
Statistical analysis
Statistical analyses were performed using GraphPad Prism 4 software. The statistical comparisons between two groups were performed using unpaired two-tailed student’s t-test. Comparison between multiple groups was performed using 1-way ANOVA followed by Tukey’s multiple comparison test. The correlations were examined using Pearson’s correlation coefficient (r).
Results
Plasma bradykinin is significantly elevated in AD
We analyzed bradykinin levels in plasma samples from AD patients and age-matched ND individuals by ELISA. We found that plasma bradykinin level was significantly elevated in AD patients compared to that of ND (2751±458.2 pg/ml vs. 1001±86.69 pg/ml; p=0.0011; Fig 1A). Though there was a significant difference between AD and ND groups (Fig. 1A), not all the AD plasma showed high plasma bradykinin. Considering that AD is a multifactorial and complex disorder, it is possible that plasma bradykinin is altered only in a subgroup of AD patients. In fact, many, but not all, AD patients present with vascular risk factors (VRFs), such as hypertension, hyperlipidemia, diabetes, myocardial infarction, stroke, and atrial fibrillation (Helzner et al., 2009; Mielke et al., 2007; Wallin et al., 2012), which could influence plasma protein expression. To minimize the effect of these VRFs, we separately analyzed individuals that did not present with any of these abnormalities (Fig 1B). Eleven of 32 ND controls (34%) and 27 of 39 AD patients (69%) reported with VRFs (Table 1). Even after excluding all samples obtained from persons with VRFs, the bradykinin level in AD remained significantly higher compared to ND (2439±525.9 pg/ml vs. 1035±112.6 pg/ml; p=0.0018; Fig. 1B). Overall, our results indicate that plasma bradykinin changes could be linked to AD pathology at least in a subgroup of AD and could contribute to cerebral inflammation and dementia.
Figure 1.
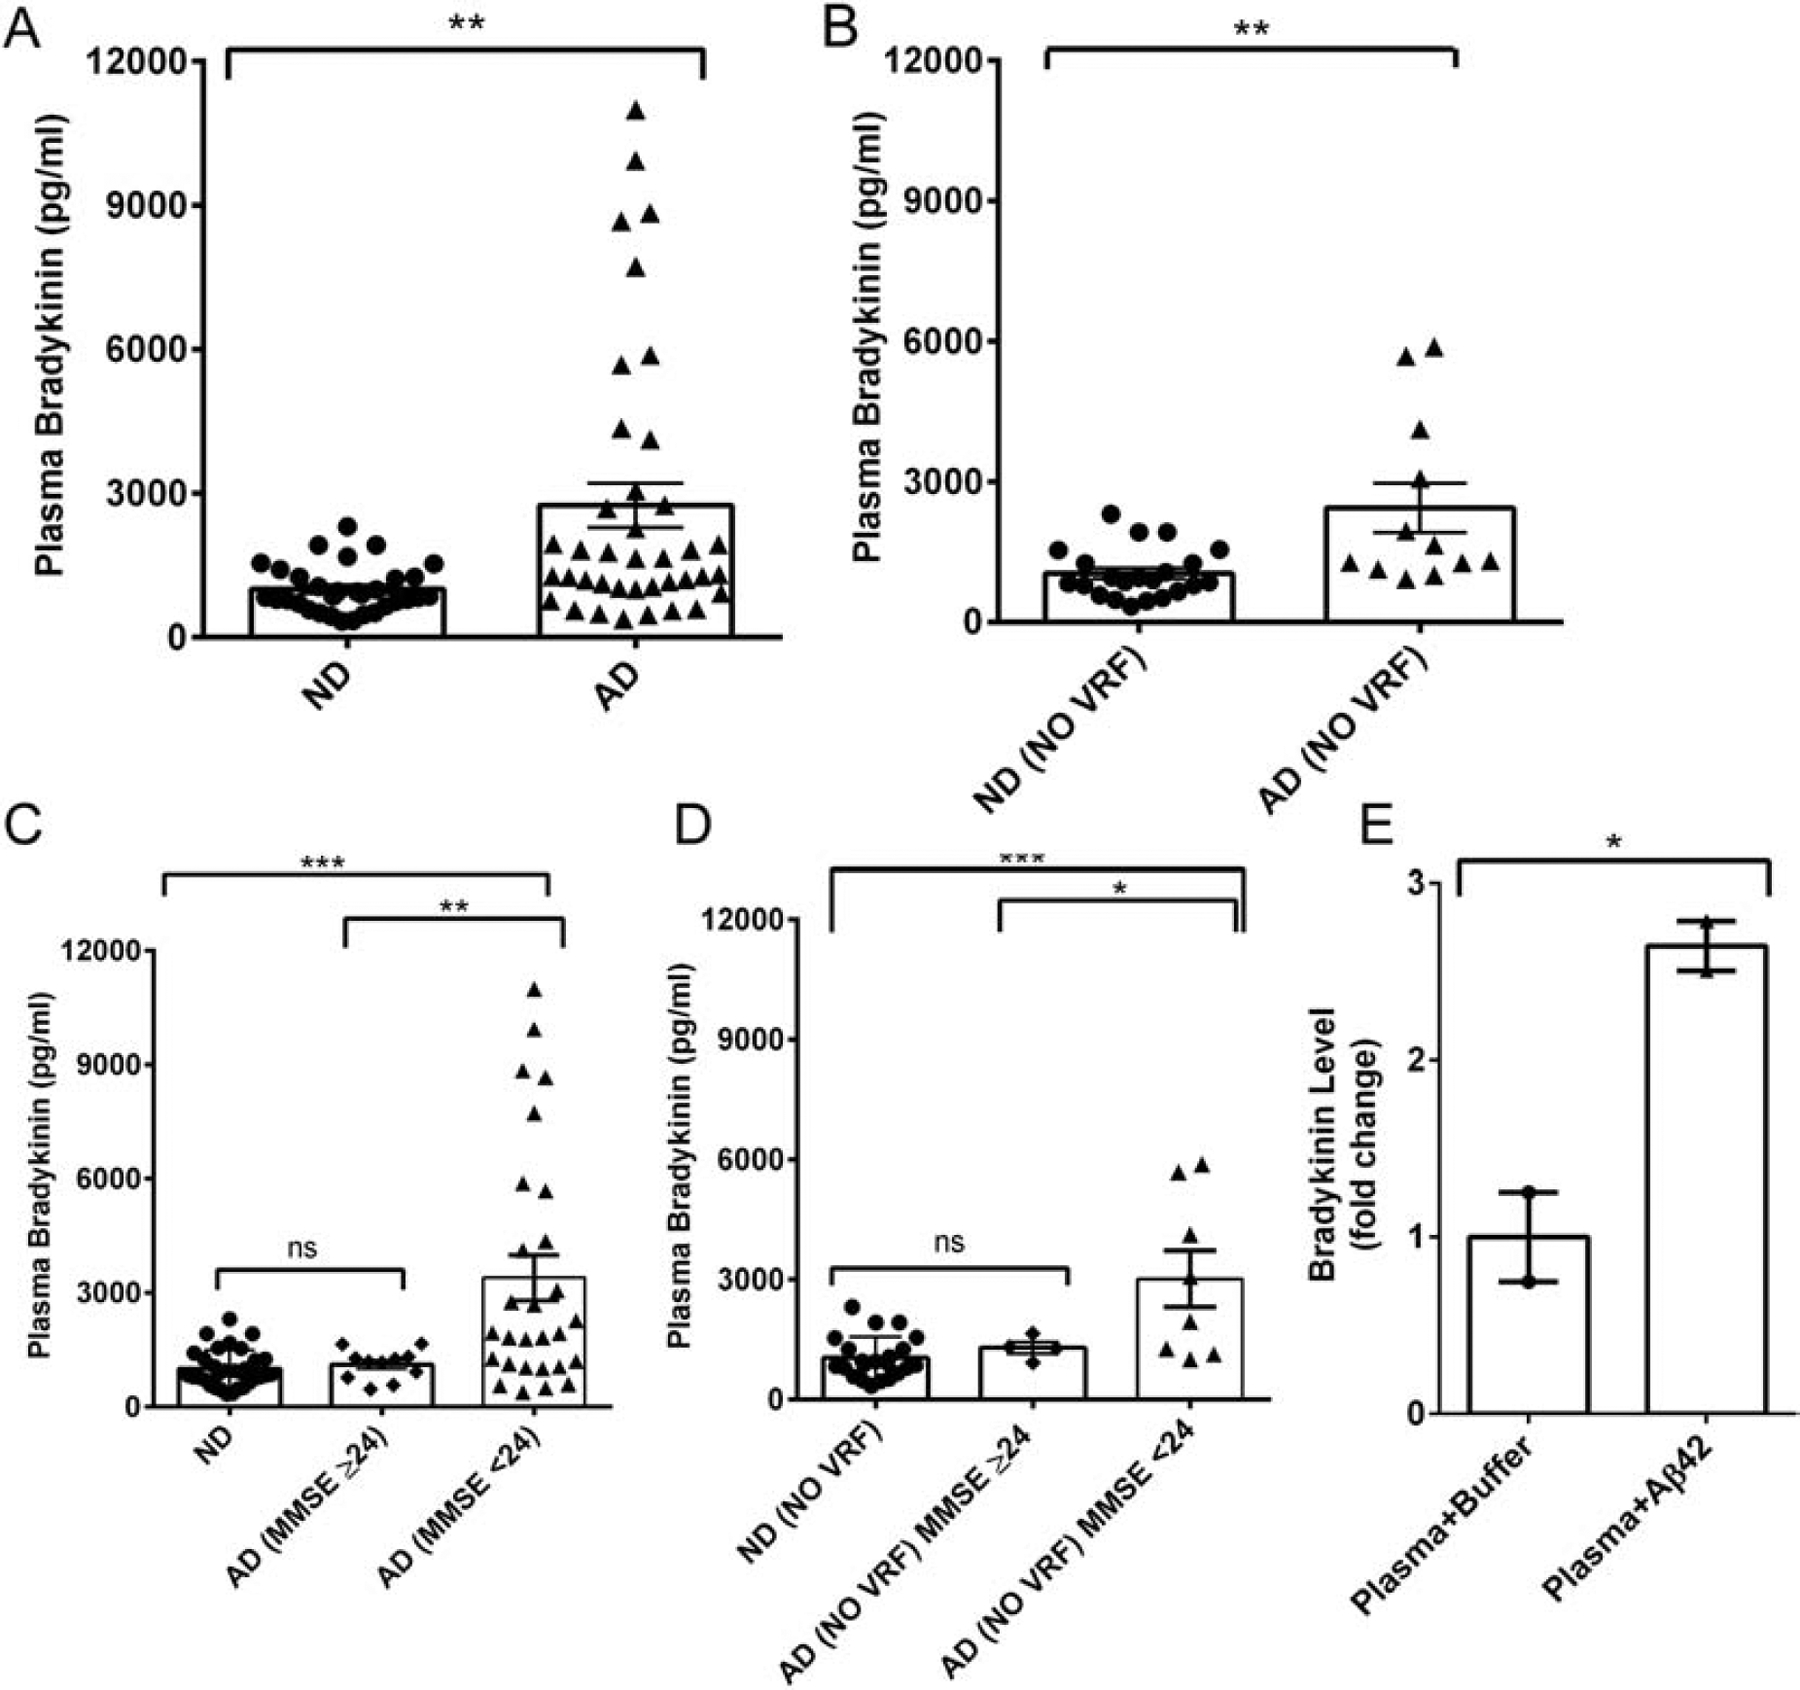
Plasma bradykinin level in ND and AD patients. (A) Plasma bradykinin levels from ND (N=32) and AD (N=39) subjects were quantified by ELISA. Plasma bradykinin was significantly higher in AD than ND samples. (B) Plasma bradykinin levels in ND (22) and AD (12) after excluding individuals with vascular risk factors (VRF). (C) AD samples were grouped according to their MMSE scores (MMSE ≥ 24, mild dementia, Group 1; MMSE < 24, moderate to severe dementia, Group 2), and their bradykinin levels were compared. Group 2 individuals presented with significantly higher bradykinin compared to ND and Group 1 subjects. (D) Plasma bradykinin levels in Group 2 remained significantly higher than ND and Group 1 after excluding samples from individuals with VRFs. (E) The effect of oligomeric Aβ42 on plasma bradykinin release was evaluated using normal human plasma. Plasma was incubated with or without oligomeric Aβ42 (500 nM) for 2 hours at 37°C. Bradykinin levels were then quantified by ELISA. The results are presented as mean ± SEM. The p value * < 0.05, ** < 0.01, and *** < 0.001. ns designates not significant.
Plasma bradykinin changes are associated with extent of memory impairment in AD
We also obtained the cognitive scores of the individuals used in our study (Table 1). The mini-mental state examination (MMSE) is a memory test routinely used to assess cognitive ability in AD patients (Folstein et al., 1975). MMSE score is inversely correlated with memory impairment; the maximum MMSE score (30) represents no cognitive impairment, and lower scores suggest cognitive decline(Kochhann et al., 2010). The mean MMSE scores of our AD and ND patients were 20.8±0.61 and 29.75±0.07, respectively. We separated AD individuals based on their MMSE scores: 1) MMSE score 24 and above (mild dementia; Group 1), and 2) MMSE score below 24 (moderate/severe dementia; Group 2) (Kochhann et al., 2010; Kukull et al., 1994). Group 2 AD patients showed much higher plasma bradykinin levels than Group 1 AD individuals (Fig. 1C; 3395 ± 595.9 pg/ml vs. 1112 ± 118.3 pg/ml; p<0.01). This result suggests that peripheral bradykinin changes could reflect the extent of memory impairment in AD. We also compared these groups after excluding patients with VRFs. We found that the bradykinin levels in non-VRF Group 2 (moderate/severe dementia) remained significantly higher than non-VRF ND (cognitively normal) or non-VRF Group 1 AD plasmas (mild dementia) (Fig. 1D). These results suggest an association between cognitive impairment and plasma bradykinin level in AD.
It is possible that Aβ is influencing the release of bradykinin in human plasma. To investigate this possibility, we incubated freshly prepared Aβ42 oligomers (Yamamoto-Imoto et al., 2018; Zamolodchikov et al., 2015) in normal human plasma and quantified the level of bradykinin in the plasma by ELISA. The plasma bradykinin level was much higher (~2.6 times) in the presence of Aβ42 (Fig. 1E), suggesting that bradykinin release in the plasma possibly could be mediated via Aβ42 in AD.
Bradykinin level is decreased in AD CSF and correlates with CSF Aβ40/Aβ42 ratio
Bradykinin levels were determined in CSF from AD patients and ND controls. Contrary to plasma bradykinin, the CSF bradykinin level was significantly lower in AD samples compared to ND controls (19.0 ± 2.4 vs. 33.8 ± 5.9 pg/ml; p=0.011; Fig 2A). We also correlated AD CSF bradykinin level with the established AD biomarker, CSF Aβ40/Aβ42 ratio, which increases in AD (Anoop et al., 2010). We found that bradykinin level was negatively correlated with the CSF Aβ40/Aβ42 ratio (r=−0.43, p=0.028) (Fig 2B), indicating a connection between CSF bradykinin and Aβ changes. AD is a complex disease and many AD patients also present with VRFs, such as hypertension, diabetes, myocardial infarction, stroke, and atrial fibrillation (Helzner et al., 2009; Mielke et al., 2007; Wallin et al., 2012). Similar to our plasma analyses, we excluded all CSF samples from patients with comorbid VRFs and repeated our CFS analyses. After exclusion, we still found that AD CSF bradykinin level was significantly lower compared to that of ND (Fig 2C; 17.3 ± 3.7 vs. 38.2 ± 7.6 pg/ml; p=0.025).
Figure. 2.
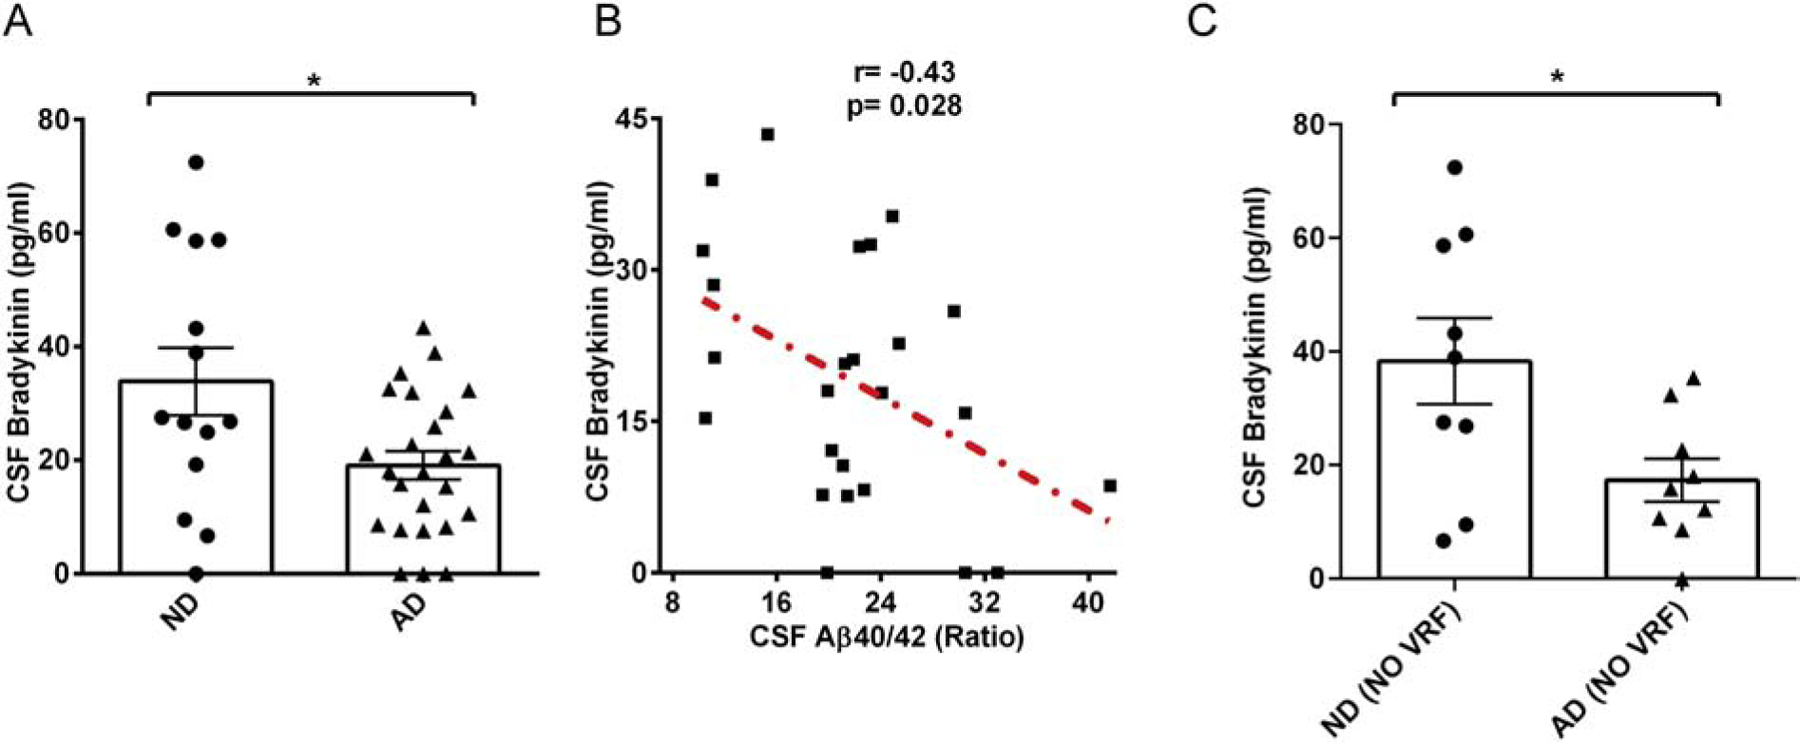
CSF bradykinin level in AD and ND. (A) CSF bradykinin was quantified by ELISA. CSF from AD patients had significantly lower bradykinin compared to ND CSF (N= 14 ND, 25 AD). (B) Correlation graph of CSF bradykinin level and CSF Aβ40/Aβ42 ratio in AD. A modest but significant inverse correlation was observed between these two parameters in AD (r= −0.43, P value=0.028). (C) CSF samples from donors with VRFs were excluded, and bradykinin levels were compared. AD patients’ CSF bradykinin was significantly lower than ND individuals’ CSF bradykinin. The results are presented with mean ± SEM. P value < 0.05 (*).
Bradykinin interacts with fibrillar form of Aβ42 and shows association with Aβ plaques
Since bradykinin levels are modestly associated with CSF Aβ levels (Fig. 2B), we explored whether bradykinin interacts with different Aβ42 species using solution state nuclear magnetic resonance (NMR) spectroscopy (Cao et al., 2018). We expressed and purified 15N-labeled Aβ42 to perform 2D-heteronuclear single quantum correlation (HSQC) experiment (Walti et al., 2016). The HSQC experiment was performed with monomeric Aβ42 (25 μM) in the absence and presence of an equimolar ratio of bradykinin. No significant changes in either HSQC peak position or intensity were observed upon addition of bradykinin to 15N-labeled Aβ42, which rules out the interaction of bradykinin to monomeric Aβ42 (Fig. 3A). Because plaques in AD mostly consist of aggregated Aβ species, we also performed an interaction study between fibrillar Aβ42 and bradykinin using NMR. For this study, a homogenous species of Aβ42 fibrils was prepared in vitro (unlabelled) by three rounds of seeding (Walti et al., 2016). These fibrils were then used to run one dimensional saturation transfer difference (STD) NMR spectroscopy with bradykinin. STD-NMR is routinely used to detect binding of small molecule ligands to macromolecular receptors (Mayer and Meyer, 2001). This experiment is performed in molar excess of ligand molecules (Mayer and Meyer, 2001). Here, we have used Aβ42 fibrils and bradykinin in a 1:50 molar ratio, and STD data were collected in the presence and absence of bradykinin. The STD signal in the presence of Aβ42 fibrils was positive (Fig. 3B, green), whereas bradykinin alone (in buffer) showed no STD signal (Fig. 3B, red). For reference, the 1D-NMR spectrum of bradykinin is also shown (Fig. 3B, blue). This result shows that bradykinin interacts with Aβ42 fibrils transiently.
Figure 3.
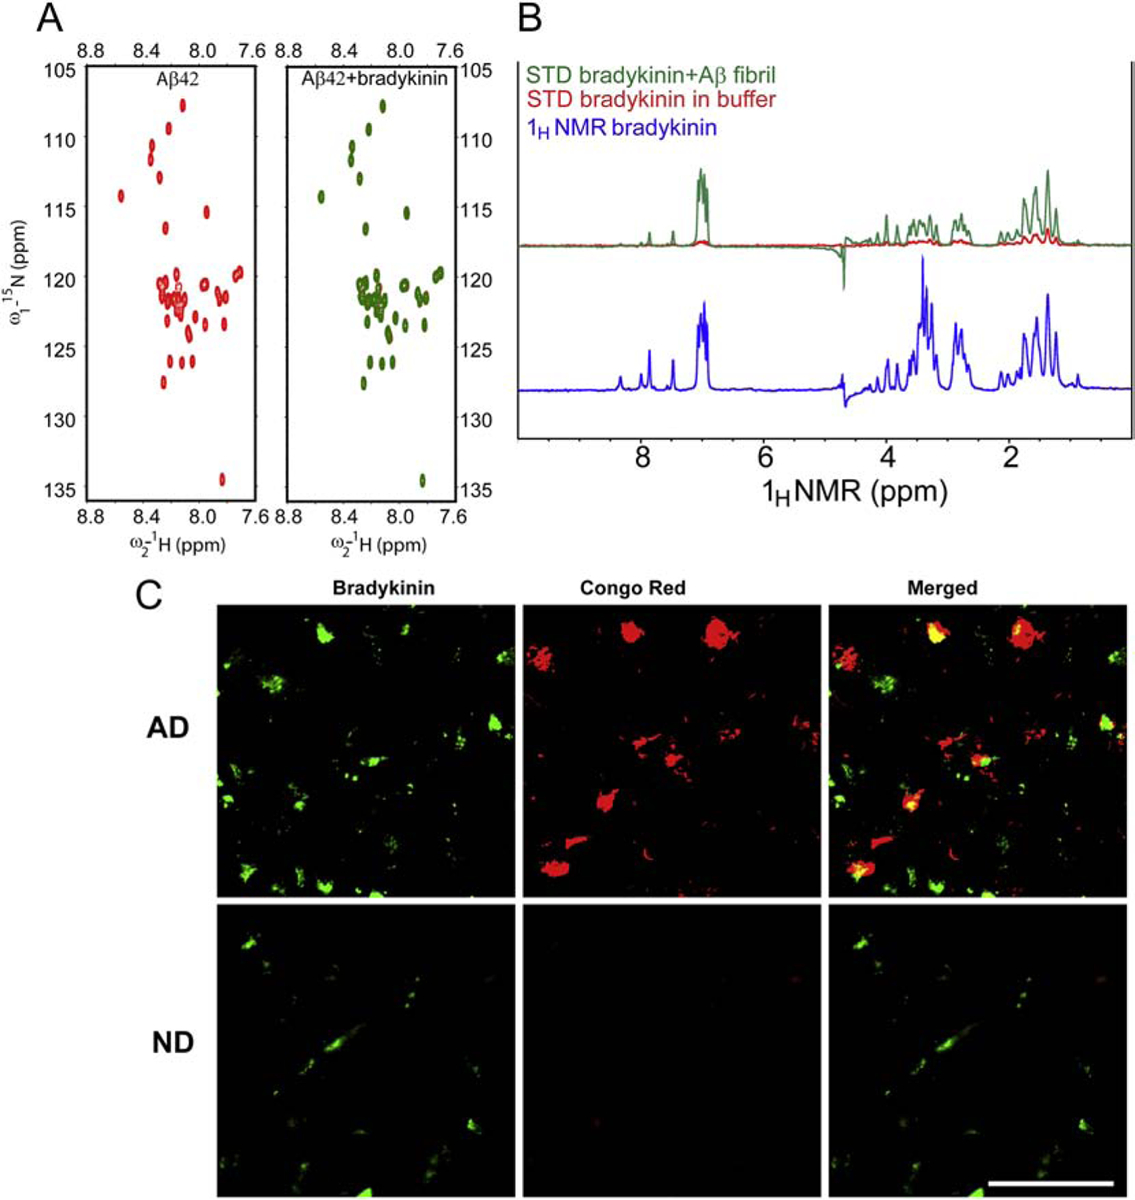
Analysis of bradykinin’s interaction with Aβ42 and association with Aβ plaques. (A) Interaction study between bradykinin and different species of Aβ42 in vitro probed by NMR. 2D [1H-15N] HSQC of monomeric/soluble Aβ42 (25 μM) in absence (red) and presence (green) of bradykinin. No significant chemical shift and/or peak intensities between these two spectra were observed, indicating that bradykinin does not interact with monomeric Aβ42. (B) 1D STD NMR spectra of fibrillar Aβ-bradykinin mixture (green), STD NMR signal of bradykinin in buffer only (red) and 1H NMR spectra of bradykinin (blue). Positive STD signal was observed in fibrillar Aβ-bradykinin mixture, suggesting bradykinin interacts with fibrillar Aβ42. (C) Immunohistochemical analysis of post-mortem human AD and ND brain tissue sections from superior frontal cortex. Sections were immunostained and imaged for bradykinin (green) and amyloid plaques (Congo red). Representative images show the association of bradykinin with amyloid plaques in AD (yellow in overlay, upper panel). The representative ND section immunostaining is shown as a control (Lower panel). N=3 AD and 3 ND. Scale bar is 100 μm.
Since we detected an interaction between fibrillar Aβ42 and bradykinin, we asked whether bradykinin could also be associated with parenchymal plaques in AD. To investigate this possibility, immunofluorescence analysis was performed using AD human post-mortem brain sections (superior frontal cortex). The sections were stained for bradykinin (green) and Aβ plaques (Congo red staining). Some of the plaques in AD brain sections also showed bradykinin immunoreactivity (yellow), confirming association of bradykinin with Aβ plaques (Fig. 3C, top panel). For control, ND sections (superior frontal cortex) were also immunostained in the same way (Fig. 3C, lower panel).
Plasma and CSF bradykinin changes are not due to altered angiotensin-converting enzyme (ACE) activity in AD patients
We also analyzed angiotensin converting enzyme (ACE) activity in plasma and CSF of AD and ND individuals. ACE is known to degrade vasoactive bradykinin, and therefore, ACE inhibitors are widely used in the treatment of hypertension (Ignjacev-Lazich et al., 2005). In our cohort of samples, the medical information provided indicated that many of the individuals were hypertensive and therefore may have been medicated. However, we were not provided with patients’ specific prescription information. We analyzed whether the differences in CSF and plasma bradykinin levels between ND and AD are due to differences in ACE activity in these samples by measuring ACE activity (Fig. 4). We did not find any difference in plasma ACE activity between ND and AD (Fig. 4A). However, compared to plasma, the CSF ACE activity was very low in both ND and AD CSF, yet there was no significant difference between ND and AD CSF ACE activity (Fig. 4B). This result indicates that the bradykinin changes in ND and AD are not due to any altered ACE activity.
Figure 4.
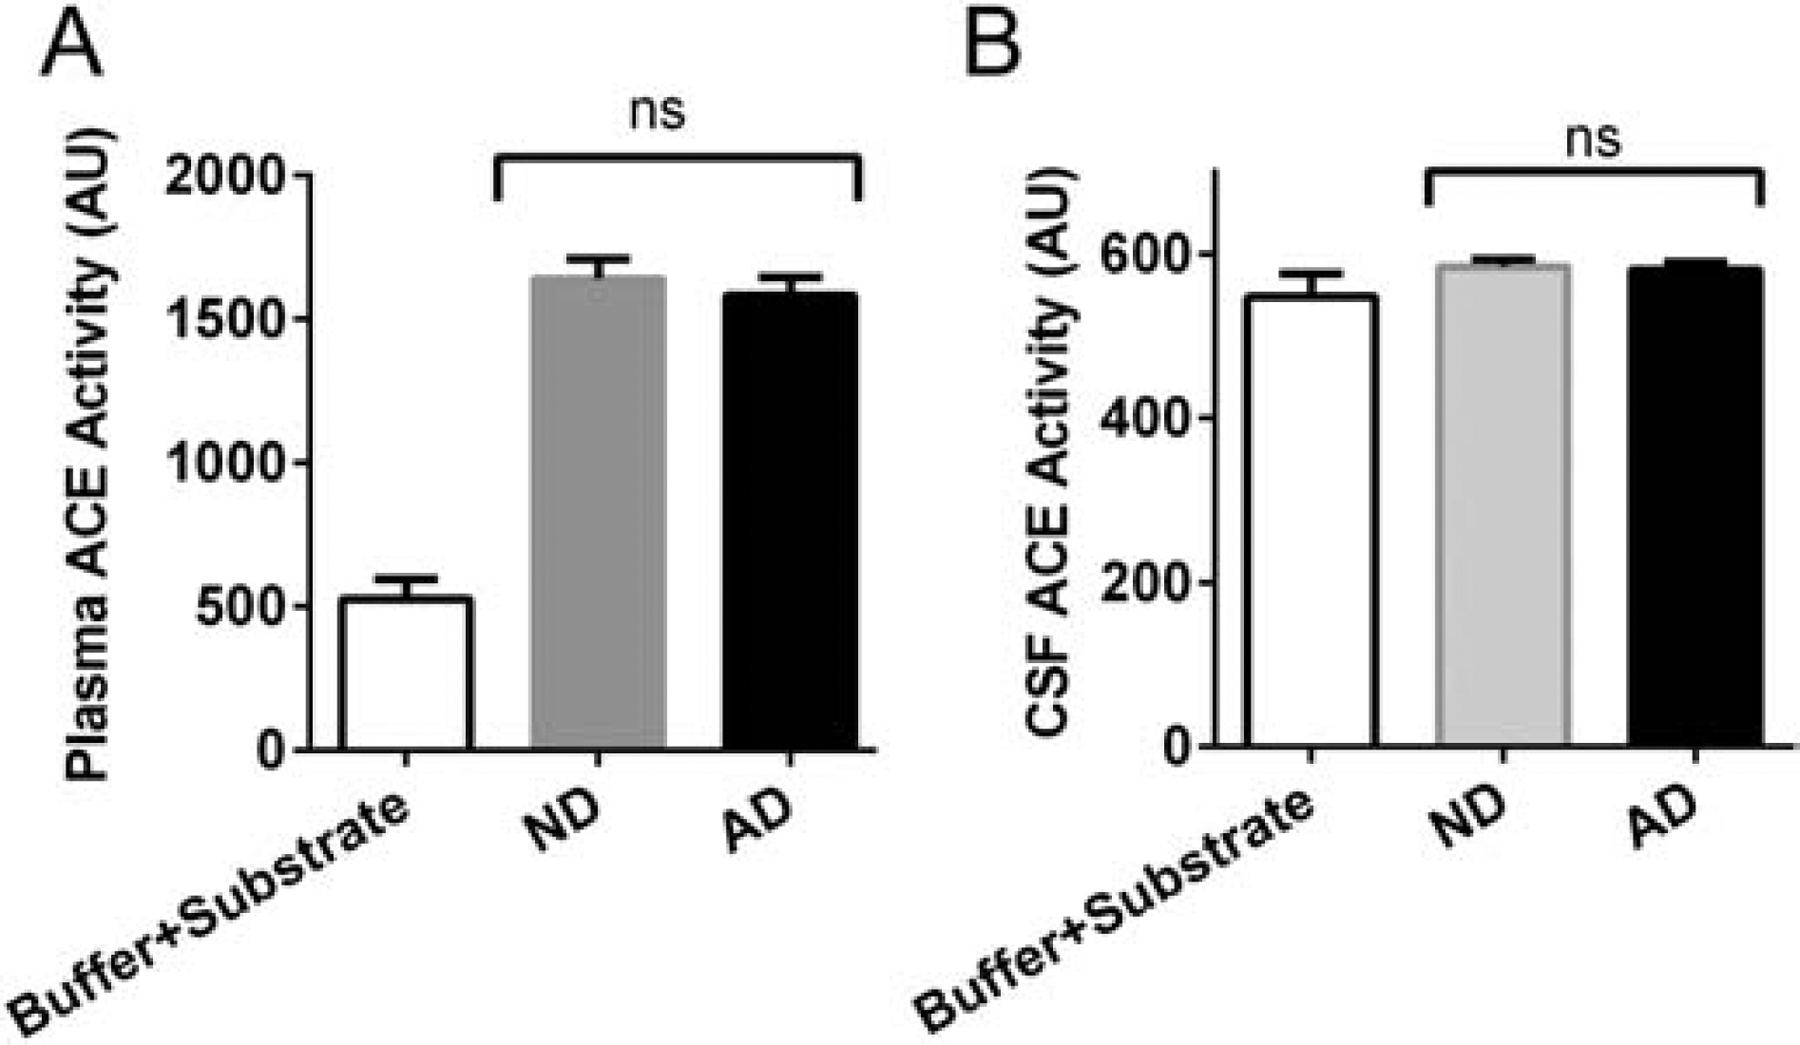
Angiotensin converting enzyme (ACE) activity in plasma and CSF of ND and AD patients. (A) Plasma from ND (N=32) and AD (N=35) individuals was used to measure ACE activity. The plasma ACE activity between ND and AD were similar, and overall no significant differences were observed. (B) ACE activity was analyzed in CSF from ND (N=14 ND, 25 AD) donors. No differences were found between groups. The results are presented as mean ± SEM. ns designates not significant.
Discussion
AD is a multifactorial disease, and it is likely that multiple disease mechanisms contribute to AD pathology (Strickland, 2018). Therefore, identifying and targeting various mechanisms in subgroups of AD patients are needed for the advancement of AD therapeutics (Selkoe, 2019). The central pathology in AD is neuronal dysfunction causing cognitive decline (Hardy and Higgins, 1992). However, one pathway that has been generally understudied in AD is vascular dysregulation. Accumulating evidence suggests that vascular dysregulation (Ahn et al., 2014; Baker et al., 2018; Chen et al., 2017; Cruz Hernandez et al., 2019; Strickland, 2018; Sweeney et al., 2019; Zamolodchikov et al., 2015) and inflammation (Akiyama et al., 2000; Ayata et al., 2018; Mandrekar-Colucci and Landreth, 2010; Merlini et al., 2019; Wyss-Coray and Rogers, 2012) play major roles in cognitive decline. The evidence for neuroinflammation in AD also includes data from several epidemiologic studies that generally support an inverse risk relationship between the use of nonsteroidal anti-inflammatory drugs (NSAIDs) and AD (Zhang et al., 2018). Anti-inflammatory compounds are also found to be protective against memory impairment associated with cerebral small vessel disease and cerebral ischemic injury in rats (Chen et al., 2018; Guan et al., 2018; Tian et al., 2019). Recently, several studies have suggested that AD may have systemic manifestations (Wang et al., 2017). Furthermore, cognitive abnormalities correlate with changes in peripheral inflammatory signals such as TNFα and IL-1β (Wang et al., 2017). Here, we demonstrate elevated levels of bradykinin, a proinflammatory molecule, in AD patient plasma (Fig. 1A), which identifies a novel mechanism of inflammatory pathology in AD. Bradykinin is generated by activation of the kallikrein-kinin system, which has been recently reported to be activated in AD (Zamolodchikov et al., 2015). Also, blockade or deletion of bradykinin receptor (B1R) has been shown to improve cognitive function in mice by reducing inflammation and BBB disruption (Raslan et al., 2010). BBB disruption is evident in AD (Montagne et al., 2017; Sweeney et al., 2018) before initiation of significant cognitive impairment or brain atrophy. It should be noted that bradykinin induces vascular permeability and is linked to BBB damage (Abbott, 2000; Marcos-Contreras et al., 2016). Bradykinin can cause overproduction of nitric oxide (NO), which is believed to be involved in neuroinflammation due to its free radical properties (Bae et al., 2003; Yuste et al., 2015). All these findings suggest that bradykinin could be involved in a pathogenic mechanism of AD. However, most of these conclusions are based on animal model studies, and therefore, a direct quantification of plasma bradykinin in AD patients has been performed in this study.
Another question would be whether these peripheral bradykinin changes affect the pathology and cognition of AD patients. Although MMSE score, a measure of cognitive status, is not specific to AD, it does give an overall view of the cognitive abilities of the patient (Arevalo-Rodriguez et al., 2015). Our data indicate a relationship between bradykinin levels and cognitive state of AD patients. In fact, many of the AD patients with lower MMSE (<24) scores had even higher plasma bradykinin levels (Fig. 1C). Considering the fact that AD is a multifactorial disorder, these data are meaningful even in a subset of AD patients. We found many but not all AD patients showed a high level of bradykinin in their plasma (Fig. 1A). Our data suggest that in the AD population, there could be a subgroup of individuals where elevated plasma bradykinin could significantly contribute to inflammation and AD pathology.
We also believe that there is a link between peripheral bradykinin level and the extent of neuroinflammation in AD. Bradykinin can induce BBB damage and extravasation of plasma proteins into the brain parenchyma. This extravasation causes glial cell activation, and the associated edema can lead to impaired cerebral blood flow. However, additional studies are required to validate our hypothesis. Microglia expresses bradykinin receptors (Ifuku et al., 2007; Noda et al., 2007), and therefore, bradykinin could be associated with activated microglia in the AD patient brain. Moreover, bradykinin distribution was found increased in the AD brain separate from the plaque area (Fig. 3C). This result suggests increased bradykinin extravasation in the AD brain. Furthermore, increased activity of plasma kallikrein, an enzyme required for bradykinin generation, was reported in AD brain parenchyma (Ashby et al., 2012).
Altered bradykinin levels are also linked with other diseases, for example hereditary angioedema (HAE) (Hofman et al., 2016), which is characterized by bradykinin-mediated edema. It should be noted that the contact system is dysregulated in both HAE and AD (Colman and Schmaier, 1997; Strickland, 2018). Some of the approved drugs for treatment of HAE might be useful in treating AD patients with high plasma bradykinin levels in the future (Strickland, 2018).
ACE can degrade vasoactive bradykinin and thus modulates blood pressure (Hofman et al., 2016). Many AD patients suffer from hypertension (Kruyer et al., 2015) and are treated with ACE inhibitors among other anti-hypertensives. ACE inhibitors block ACE activity and thus enhance the level of vasoactive plasma bradykinin (Hofman et al., 2016). We found no difference in ACE activity between ND and AD plasma (Fig. 4A), which shows that there was not a significant contribution of drug-mediated elevation of plasma bradykinin in our AD cohort. Moreover, we also excluded all ND and AD patients with hypertension and other vascular risk factors (VRFs) in order to analyze bradykinin changes in ND and AD individuals without any comorbidities or associated medications. In this analysis, we found the same result in that AD plasma bradykinin level is elevated compared to controls (Fig. 1B) and these bradykinin changes are more pronounced in AD patients with higher memory impairment (Fig. 1D). After exclusion of VRF samples, we had only 12 AD samples. Although this is a small group, we found that many of the AD patients without vascular comorbidities have a high level of bradykinin in the plasma (Fig. 1B). Again, considering the pathogenic complexity in AD, a larger group of ND and AD plasma samples (without vascular comorbidities) should be analyzed.
When the contact system is activated, bradykinin is released upon cleavage of high molecular weight kininogen (HK). It has been reported that HK cleavage is increased in AD patient’s plasma and CSF (Bergamaschini et al., 1998; Zamolodchikov et al., 2015). The increased plasma bradykinin in AD patients could be due to the increased HK cleavage observed in AD patient plasma. However, these findings do not explain the lower CSF bradykinin level in AD patients compared to ND control individuals (Fig. 2A). It is possible that CSF bradykinin is reduced in AD due to its increased degradation by other proteases in the CSF. Bradykinin can be degraded by ACE (Hofman et al., 2016), whose levels are also dysregulated in AD. Plasma ACE activity in AD was reported to be lower than that of control individuals (Vardy et al., 2009), and CSF ACE activity was reported higher in AD (He et al., 2006). However, we did not find any significant difference between ND and AD ACE activity in plasma or CSF (Fig. 4A and 4B). ACE activity is reported to be higher in AD brain (Miners et al., 2009), but we were unable to measure ACE activity in our samples since we were working with ante-mortem brain tissue.
ACE has been reported to cleave Aβ in vitro (Hemming and Selkoe, 2005), and there are some reports that ACE inhibitors improve memory in AD patients (Ohrui et al., 2004; Soto et al., 2013). However, this observation is controversial as there are other studies that show that ACE inhibitors could potentially increase the risk of developing AD (Qiu et al., 2013; Qiu et al., 2014; Zou et al., 2007). It should be taken into account that non-ACE enzymes are also capable of degrading ACE substrates (Skidgel, 1992). Therefore, there may be other proteases in the CSF that could degrade and therefore lower the level of CSF bradykinin in AD. It is also possible that bradykinin levels are lower in the CSF because CSF bradykinin is depositing around plaques in the brain (Fig. 3C).
The plasma-CSF inverse correlation is not surprising in AD. For example, glycoprotein CD40, which activates microglia, is elevated in AD patient plasma but is decreased in AD patient CSF (compared to healthy controls) (Buchhave et al., 2009; Ye et al., 2019). Furthermore, plasma Aβ42 levels increase while CSF Aβ42 levels decrease in AD patients (Nakamura et al., 2018; Teunissen et al., 2018). While we did not find an inverse correlation between plasma bradykinin and CSF Aβ40/Aβ42 ratio, we did find one between CSF bradykinin and CSF Aβ40/Aβ42 ratio (Fig. 2B). This finding indicates that CSF bradykinin changes could be influenced by CSF Aβ changes. We also confirmed that bradykinin interacts with Aβ42 fibrils and is associated with Aβ plaques in AD (Fig. 3). However, the mechanism for how CSF bradykinin changes are related to AD pathology needs to be explored in detail. Furthermore, we found that adding Aβ42 oligomers to normal human plasma significantly increases bradykinin level (Fig 1E). All these findings suggest that bradykinin changes could be driven by Aβ, likely due to the dysregulated contact system in AD.
As mentioned above, VRFs and vascular dysfunction are present in the majority of AD patients and significantly contribute to AD pathology. For example, nearly 70% of our AD patient cohort had VRF comorbidities (Table 1). In fact, many AD patients with VRF showed very high plasma bradykinin (Fig 1A and Fig 1C). Thus, without a detailed analysis of each variable, we cannot fully determine how these comorbidities contribute to bradykinin changes. Therefore, our conclusion is that increased plasma bradykinin level (by any mechanism) could worsen AD pathology and cognition.
Highlights.
Proinflammatory bradykinin, which is linked to Alzheimer’s disease (AD) pathology, is elevated in many AD patients’ plasma.
Plasma bradykinin levels are often higher in AD patients with greater cognitive impairment.
In contrast, plasma bradykinin level is lower in cerebrospinal fluid (CSF) in many AD patients.
Bradykinin interacts with Aβ42 aggregates and is found localized with Aβ plaques in AD postmortem brain tissue.
Changes in bradykinin levels in AD patients are not due to altered angiotensin converting enzyme (ACE) activity.
Acknowledgements
We are thankful to members of the Strickland laboratory for helpful discussions and valuable suggestions. We are also thankful to Dr. Harindranath Kadavath for providing the in-house STD NMR pulse sequence and setup. This work was supported by National Institutes of Health Grants NS106668 and NS102721, Cure Alzheimer’s Fund, Alzheimer’s Association, the Rudin Family Foundation, and Mr. John A. Herrmann, Jr.
Footnotes
Publisher's Disclaimer: This is a PDF file of an unedited manuscript that has been accepted for publication. As a service to our customers we are providing this early version of the manuscript. The manuscript will undergo copyediting, typesetting, and review of the resulting proof before it is published in its final form. Please note that during the production process errors may be discovered which could affect the content, and all legal disclaimers that apply to the journal pertain.
Conflict-of-interest disclosure:
The authors declare no competing financial interests.
References
- Abbott NJ, 2000. Inflammatory mediators and modulation of blood-brain barrier permeability. Cell Mol Neurobiol. 20, 131–47. [DOI] [PMC free article] [PubMed] [Google Scholar]
- Ahn HJ, et al. , 2014. A novel Abeta-fibrinogen interaction inhibitor rescues altered thrombosis and cognitive decline in Alzheimer’s disease mice. J Exp Med. 211, 1049–62. [DOI] [PMC free article] [PubMed] [Google Scholar]
- Akassoglou K, Strickland S, 2002. Nervous system pathology: the fibrin perspective. Biol Chem. 383, 37–45. [DOI] [PubMed] [Google Scholar]
- Akiyama H, et al. , 2000. Inflammation and Alzheimer’s disease. Neurobiol Aging. 21, 383–421. [DOI] [PMC free article] [PubMed] [Google Scholar]
- Anoop A, et al. , 2010. CSF Biomarkers for Alzheimer’s Disease Diagnosis. Int J Alzheimers Dis. 2010. [DOI] [PMC free article] [PubMed] [Google Scholar]
- Arevalo-Rodriguez I, et al. , 2015. Mini-Mental State Examination (MMSE) for the detection of Alzheimer’s disease and other dementias in people with mild cognitive impairment (MCI). Cochrane Database Syst Rev. CD010783. [DOI] [PMC free article] [PubMed] [Google Scholar]
- Ashby EL, et al. , 2012. Assessment of activation of the plasma kallikrein-kinin system in frontal and temporal cortex in Alzheimer’s disease and vascular dementia. Neurobiol Aging. 33, 1345–55. [DOI] [PubMed] [Google Scholar]
- Ayata P, et al. , 2018. Epigenetic regulation of brain region-specific microglia clearance activity. Nat Neurosci. 21, 1049–1060. [DOI] [PMC free article] [PubMed] [Google Scholar]
- Bae SW, et al. , 2003. Rapid increase in endothelial nitric oxide production by bradykinin is mediated by protein kinase A signaling pathway. Biochem Biophys Res Commun. 306, 981–7. [DOI] [PubMed] [Google Scholar]
- Baker SK, et al. , 2018. Blood-derived plasminogen drives brain inflammation and plaque deposition in a mouse model of Alzheimer’s disease. Proc Natl Acad Sci USA. 115, E9687–E9696. [DOI] [PMC free article] [PubMed] [Google Scholar]
- Bergamaschini L, et al. , 1998. Activation of the contact system in cerebrospinal fluid of patients with Alzheimer disease. Alzheimer Dis Assoc Disord. 12, 102–8. [DOI] [PubMed] [Google Scholar]
- Buchhave P, et al. , 2009. Elevated plasma levels of soluble CD40 in incipient Alzheimer’s disease. Neurosci Lett. 450, 56–59. [DOI] [PubMed] [Google Scholar]
- Cao Q, et al. , 2018. Inhibiting amyloid-beta cytotoxicity through its interaction with the cell surface receptor LilrB2 by structure-based design. Nat Chem. 10, 1213–1221. [DOI] [PMC free article] [PubMed] [Google Scholar]
- Chen FY, et al. , 2018. Effect of polydatin on expression of p53 and Notch1 in brain tissue of ischemic cerebrovascular disease. J Biol Regul Homeost Agents. 32, 133–138. [PubMed] [Google Scholar]
- Chen ZL, et al. , 2017. Depletion of coagulation factor XII ameliorates brain pathology and cognitive impairment in Alzheimer disease mice. Blood. 129, 2547–2556. [DOI] [PMC free article] [PubMed] [Google Scholar]
- Colman RW, Schmaier AH, 1997. Contact system: a vascular biology modulator with anticoagulant, profibrinolytic, antiadhesive, and proinflammatory attributes. Blood. 90, 3819–43. [PubMed] [Google Scholar]
- Cortes-Canteli M, et al. , 2015. Fibrin deposited in the Alzheimer’s disease brain promotes neuronal degeneration. Neurobiol Aging. 36, 608–17. [DOI] [PMC free article] [PubMed] [Google Scholar]
- Cortes-Canteli M, et al. , 2010. Fibrinogen and beta-amyloid association alters thrombosis and fibrinolysis: a possible contributing factor to Alzheimer’s disease. Neuron. 66, 695–709. [DOI] [PMC free article] [PubMed] [Google Scholar]
- Cortes-Canteli M, et al. , 2012. Fibrinogen and altered hemostasis in Alzheimer’s disease. J Alzheimers Dis. 32, 599–608. [DOI] [PMC free article] [PubMed] [Google Scholar]
- Cruz Hernandez JC, et al. , 2019. Neutrophil adhesion in brain capillaries reduces cortical blood flow and impairs memory function in Alzheimer’s disease mouse models. Nat Neurosci. 22, 413–420. [DOI] [PMC free article] [PubMed] [Google Scholar]
- Davalos D, Akassoglou K, 2012. Fibrinogen as a key regulator of inflammation in disease. Semi n Immunopathol. 34, 43–62. [DOI] [PubMed] [Google Scholar]
- de la Torre JC, 2004. Is Alzheimer’s disease a neurodegenerative or a vascular disorder? Data, dogma, and dialectics. Lancet Neurol. 3, 184–90. [DOI] [PubMed] [Google Scholar]
- Finder VH, et al. , 2010. The recombinant amyloid-beta peptide Abeta1–42 aggregates faster and is more neurotoxic than synthetic Abeta1–42. J Mol Biol. 396, 9–18. [DOI] [PubMed] [Google Scholar]
- Flick MJ, et al. , 2007. Fibrin(ogen) exacerbates inflammatory joint disease through a mechanism linked to the integrin alphaMbeta2 binding motif. J Clin Invest. 117, 3224–35. [DOI] [PMC free article] [PubMed] [Google Scholar]
- Folstein MF, et al. , 1975. “Mini-mental state”. A practical method for grading the cognitive state of patients for the clinician. J Psychiatr Res. 12, 189–98. [DOI] [PubMed] [Google Scholar]
- Golias C, et al. , 2007. The kinin system--bradykinin: biological effects and clinical implications. Multiple role of the kinin system--bradykinin. Hippokratia. 11, 124–8. [PMC free article] [PubMed] [Google Scholar]
- Guan D, et al. , 2018. Thymoquinone protects against cerebral small vessel disease: Role of antioxidant and anti-inflammatory activities. J Biol Regul Homeost Agents. 32, 225–231. [PubMed] [Google Scholar]
- Hardy JA, Higgins GA, 1992. Alzheimer’s disease: the amyloid cascade hypothesis. Science. 256, 184–5. [DOI] [PubMed] [Google Scholar]
- He M, et al. , 2006. ACE activity in CSF of patients with mild cognitive impairment and Alzheimer disease. Neurology. 67, 1309–10. [DOI] [PubMed] [Google Scholar]
- Helzner EP, et al. , 2009. Contribution of vascular risk factors to the progression in Alzheimer disease. Arch Neurol. 66, 343–8. [DOI] [PMC free article] [PubMed] [Google Scholar]
- Hemming ML, Selkoe DJ, 2005. Amyloid beta-protein is degraded by cellular angiotensin-converting enzyme (ACE) and elevated by an ACE inhibitor. J Biol Chem. 280, 37644–50. [DOI] [PMC free article] [PubMed] [Google Scholar]
- Hofman Z, et al. , 2016. Bradykinin: Inflammatory Product of the Coagulation System. Clin Rev Allergy Immunol. 51, 152–61. [DOI] [PMC free article] [PubMed] [Google Scholar]
- Humpel C, 2011. Chronic mild cerebrovascular dysfunction as a cause for Alzheimer’s disease? Exp Gerontol. 46, 225–32. [DOI] [PMC free article] [PubMed] [Google Scholar]
- Ifuku M, et al. , 2007. Bradykinin-induced microglial migration mediated by B1-bradykinin receptors depends on Ca2+ influx via reverse-mode activity of the Na+/Ca2+ exchanger. J Neurosci. 27, 13065–13073. [DOI] [PMC free article] [PubMed] [Google Scholar]
- Ignjacev-Lazich I, et al. , 2005. Angiotensin-converting enzyme regulates bradykinin receptor gene expression. Am J Physiol Heart Circ Physiol. 289, H1814–20. [DOI] [PubMed] [Google Scholar]
- Iores-Marcal LM, et al. , 2006. Bradykinin release and inactivation in brain of rats submitted to an experimental model of Alzheimer’s disease. Peptides. 27, 3363–9. [DOI] [PubMed] [Google Scholar]
- Kochhann R, et al. , 2010. The Mini Mental State Examination: Review of cutoff points adjusted for schooling in a large Southern Brazilian sample. Dement Neuropsychol. 4, 35–41. [DOI] [PMC free article] [PubMed] [Google Scholar]
- Kruyer A, et al. , 2015. Chronic Hypertension Leads to Neurodegeneration in the TgSwDI Mouse Model of Alzheimer’s Disease. Hypertension. 66, 175–82. [DOI] [PMC free article] [PubMed] [Google Scholar]
- Kukull WA, et al. , 1994. The Mini-Mental State Examination score and the clinical diagnosis of dementia. J Clin Epidemiol. 47, 1061–7. [DOI] [PubMed] [Google Scholar]
- Lacoste B, et al. , 2013. Cognitive and cerebrovascular improvements following kinin B1 receptor blockade in Alzheimer’s disease mice. J Neuroinflammation. 10, 57. [DOI] [PMC free article] [PubMed] [Google Scholar]
- Long AT, et al. , 2016. Contact system revisited: an interface between inflammation, coagulation, and innate immunity. J Thromb Haemost. 14, 427–37. [DOI] [PubMed] [Google Scholar]
- Mandrekar-Colucci S, Landreth GE, 2010. Microglia and inflammation in Alzheimer’s disease. CNS Neurol Disord Drug Targets. 9, 156–67. [DOI] [PMC free article] [PubMed] [Google Scholar]
- Marcos-Contreras OA, et al. , 2016. Hyperfibrinolysis increases blood-brain barrier permeability by a plasmin- and bradykinin-dependent mechanism. Blood. 128, 2423–2434. [DOI] [PubMed] [Google Scholar]
- Mayer M, Meyer B, 2001. Group epitope mapping by saturation transfer difference NMR to identify segments of a ligand in direct contact with a protein receptor. J Am Chem Soc. 123, 6108–17. [DOI] [PubMed] [Google Scholar]
- Merlini M, et al. , 2019. Fibrinogen Induces Microglia-Mediated Spine Elimination and Cognitive Impairment in an Alzheimer’s Disease Model. Neuron. 101, 1099–1108 e6. [DOI] [PMC free article] [PubMed] [Google Scholar]
- Mielke MM, et al. , 2007. Vascular factors predict rate of progression in Alzheimer disease. Neurology. 69, 1850–8. [DOI] [PubMed] [Google Scholar]
- Miners S, et al. , 2009. Angiotensin-converting enzyme levels and activity in Alzheimer’s disease: differences in brain and CSF ACE and association with ACE1 genotypes. Am J Transl Res. 1, 163–77. [PMC free article] [PubMed] [Google Scholar]
- Montagne A, et al. , 2017. Alzheimer’s disease: A matter of blood-brain barrier dysfunction? J Exp Med. 214, 3151–3169. [DOI] [PMC free article] [PubMed] [Google Scholar]
- Nakamura A, et al. , 2018. High performance plasma amyloid-beta biomarkers for Alzheimer’s disease. Nature. 554, 249–254. [DOI] [PubMed] [Google Scholar]
- Noda M, et al. , 2007. Multifunctional effects of bradykinin on glial cells in relation to potential anti-inflammatory effects. Neuroschemistry International. 51, 185–191. [DOI] [PubMed] [Google Scholar]
- Ohrui T, et al. , 2004. Effects of brain-penetrating ACE inhibitors on Alzheimer disease progression. Neurology. 63, 1324–5. [DOI] [PubMed] [Google Scholar]
- Prediger RD, et al. , 2008. Genetic deletion or antagonism of kinin B(1) and B(2) receptors improves cognitive deficits in a mouse model of Alzheimer’s disease. Neuroscience. 151, 631–43. [DOI] [PubMed] [Google Scholar]
- Qiu C, et al. , 2009. Epidemiology of Alzheimer’s disease: occurrence, determinants, and strategies toward intervention. Dialogues Clin Neurosci. 11, 111–28. [DOI] [PMC free article] [PubMed] [Google Scholar]
- Qiu WQ, et al. , 2013. Angiotensin converting enzyme inhibitors and the reduced risk of Alzheimer’s disease in the absence of apolipoprotein E4 allele. J Alzheimers Dis. 37, 421–8. [DOI] [PMC free article] [PubMed] [Google Scholar]
- Qiu WW, et al. , 2014. Angiotensin converting enzyme inhibitors and Alzheimer disease in the presence of the apolipoprotein E4 allele. Am J Geriatr Psychiatry. 22, 177–85. [DOI] [PMC free article] [PubMed] [Google Scholar]
- Racchi M, et al. , 1998. Bradykinin-induced amyloid precursor protein secretion: a protein kinase C-independent mechanism that is not altered in fibroblasts from patients with sporadic Alzheimer’s disease. Biochem J. 330 (Pt 3), 1271–5. [DOI] [PMC free article] [PubMed] [Google Scholar]
- Raslan F, et al. , 2010. Inhibition of bradykinin receptor B1 protects mice from focal brain injury by reducing blood-brain barrier leakage and inflammation. J Cereb Blood Flow Metab. 30, 1477–86. [DOI] [PMC free article] [PubMed] [Google Scholar]
- Selkoe DJ, 2019. Alzheimer disease and aducanumab: adjusting our approach. Nat Rev Neurol. [DOI] [PubMed] [Google Scholar]
- Skidgel RA, 1992. Bradykinin-degrading enzymes: structure, function, distribution, and potential roles in cardiovascular pharmacology. J CARDIOVASC PHARMACOL. 20, Suppl S4–S9. [DOI] [PubMed] [Google Scholar]
- Soto ME, et al. , 2013. Angiotensin-converting enzyme inhibitors and Alzheimer’s disease progression in older adults: results from the Reseau sur la Maladie d’Alzheimer Francais cohort. J Am Geriatr Soc. 61, 1482–8. [DOI] [PubMed] [Google Scholar]
- Strickland S, 2018. Blood will out: vascular contributions to Alzheimer’s disease. J Clin Invest. 128, 556–563. [DOI] [PMC free article] [PubMed] [Google Scholar]
- Suidan GL, et al. , 2018. Abnormal clotting of the intrinsic/contact pathway in Alzheimer disease patients is related to cognitive ability. Blood Adv. 2, 954–963. [DOI] [PMC free article] [PubMed] [Google Scholar]
- Sweeney MD, et al. , 2019. Vascular dysfunction-The disregarded partner of Alzheimer’s disease. Alzheimers Dement. 15, 158–167. [DOI] [PMC free article] [PubMed] [Google Scholar]
- Sweeney MD, et al. , 2018. Blood-brain barrier breakdown in Alzheimer disease and other neurodegenerative disorders. Nat Rev Neurol. 14, 133–150. [DOI] [PMC free article] [PubMed] [Google Scholar]
- Teunissen CE, et al. , 2018. Plasma Amyloid-beta (Abeta42) Correlates with Cerebrospinal Fluid Abeta42 in Alzheimer’s Disease. J Alzheimers Dis. 62, 1857–1863. [DOI] [PubMed] [Google Scholar]
- Tian JN, et al. , 2019. Cerebral small-vessel disease in the prognosis of acute cerebral hemorrhage in northeastern China: a retrospective study. J Biol Regul Homeost Agents. 33, 1249–1254. [PubMed] [Google Scholar]
- Vardy ER, et al. , 2009. Plasma angiotensin-converting enzyme in Alzheimer’s disease. J Alzheimers Dis. 16, 609–18. [DOI] [PubMed] [Google Scholar]
- Viel TA, Buck HS, 2011. Kallikrein-kinin system mediated inflammation in Alzheimer’s disease in vivo. Curr Alzheimer Res. 8, 59–66. [DOI] [PubMed] [Google Scholar]
- Wallin K, et al. , 2012. Midlife rheumatoid arthritis increases the risk of cognitive impairment two decades later: a population-based study. J Alzheimers Dis. 31, 669–76. [DOI] [PubMed] [Google Scholar]
- Walti MA, et al. , 2016. Atomic-resolution structure of a disease-relevant Abeta(1–42) amyloid fibril. Proc Natl Acad Sci USA. 113, E4976–84. [DOI] [PMC free article] [PubMed] [Google Scholar]
- Wang J, et al. , 2017. A systemic view of Alzheimer disease - insights from amyloid-beta metabolism beyond the brain. Nat Rev Neurol. 13, 612–623. [DOI] [PubMed] [Google Scholar]
- Wang Q, Wang J, 2002. Injection of bradykinin or cyclosporine A to hippocampus induces Alzheimer-like phosphorylation of Tau and abnormal behavior in rats. Chin Med J (Engl). 115, 884–7. [PubMed] [Google Scholar]
- Wyss-Coray T, Rogers J, 2012. Inflammation in Alzheimer disease-a brief review of the basic science and clinical literature. Cold Spring Harb Perspect Med. 2, a006346. [DOI] [PMC free article] [PubMed] [Google Scholar]
- Yamamoto-Imoto H, et al. , 2018. A novel detection method of cleaved plasma high-molecular-weight kininogen reveals its correlation with Alzheimer’s pathology and cognitive impairment. Alzheimers Dement (Amst). 10, 480–489. [DOI] [PMC free article] [PubMed] [Google Scholar]
- Ye X, et al. , 2019. Association of CSF CD40 levels and synaptic degeneration across the Alzheimer’s disease spectrum. 694, 41–45. [DOI] [PubMed] [Google Scholar]
- Yuste JE, et al. , 2015. Implications of glial nitric oxide in neurodegenerative diseases. Front Cell Neurosci. 9, 322. [DOI] [PMC free article] [PubMed] [Google Scholar]
- Zamolodchikov D, et al. , 2015. Activation of the factor XII-driven contact system in Alzheimer’s disease patient and mouse model plasma. Proc Natl Acad Sci USA. 112, 4068–73. [DOI] [PMC free article] [PubMed] [Google Scholar]
- Zhang C, et al. , 2018. NSAID Exposure and Risk of Alzheimer’s Disease: An Updated Meta-Analysis From Cohort Studies. Front Aging Neurosci. 10, 83. [DOI] [PMC free article] [PubMed] [Google Scholar]
- Zou K, et al. , 2007. Angiotensin-converting enzyme converts amyloid beta-protein 1–42 (Abeta(1–42)) to Abeta(1–40), and its inhibition enhances brain Abeta deposition. J Neurosci. 27, 8628–35. [DOI] [PMC free article] [PubMed] [Google Scholar]