

Abstract
Background:
Pulmonary artery (PA) pulsitility index (PAPi) is a novel hemodynamic index shown to predict right ventricular failure in acute inferior myocardial infarction and post left ventricular assist device surgery. We hypothesized that PAPi calculated as [PA systolic pressure - PA diastolic pressure] / right atrial pressure (RAP) would be associated with mortality in the National Institutes of Health Registry for Primary Pulmonary Hypertension (NIH-RPPH).
Methods:
The impact of PAPi, the Pulmonary Hypertension Connection (PHC) risk score, right ventricular stroke work, pulmonary artery capacitance (PAC), other hemodynamic indices, and demographic characteristics was evaluated in 272 NIH-RPPH patients using multivariable Cox proportional hazards (CPH) regression and receiver operating characteristic (ROC) analysis.
Results:
In the 272 patients (median age 37.7+/−15.9 years, 63% female), the median PAPi was 5.8 (IQR 3.7–9.2). During 5 years of follow-up, 51.8% of the patients died. Survival was markedly lower (32.8% during the first 3 years) in PAPi quartile 1 compared with the remaining patients (58.5% over 3 years in quartiles 2–4; P<0.0001). The best multivariable CPH survival model included PAPi, the PHC-Risk score, PAC, and body mass index (BMI). In this model, the adjusted hazard ratio for death with increasing PAPi was 0.946 (95% CI 0.905–0.989). The independent ROC areas for 5-year survival based on bivariable logistic regression for PAPi, BMI, PHC Risk, and PAC were 0.63, 0.62, 0.64, and 0.65, respectively (P<0.01). The ROC area for 5-year survival for the multivariable logistic model with all 4 covariates was 0.77 (P < 0.0001).
Conclusions:
PAPi was independently associated with survival in PAH, highlighting the utility of PAPi in combination with other key measures for risk stratification in this population.
Keywords: Pulmonary hypertension, heart failure, PAPi
Introduction:
Pulmonary arterial hypertension (PAH) is a progressive disease characterized by pathological pulmonary vascular remodeling that invariably leads to severe elevation in right ventricle (RV) afterload leading to RV failure and ultimately death.1,2 In the early phase of the disease, the RV maybe able to compensate, remodel and accommodate the increased afterload imposed on it. Anatomically the RV is a thin walled structure and by extension subjected to a greater wall stress for any given unit increase in pressure. Furthermore, the RV is constitutively adapted to function more as a high volume – low pressure chamber making it extremely vulnerable to conditions of increased pressure overload. Although the locus of the initial insult in PAH lies within the pulmonary vasculature, the towering determinants of survival and overall prognosis are intricately correlated with the integrity of the RV function.3–5 Thus there is a growing interest in the physiological interactions between the RV and the pulmonary artery (PA) in patients with PAH.6 Ventriculo-arterial (VA) hemodynamics in PAH have been demonstrated to parallel clinical outcomes.6 A novel hemodynamic index that represents VA interaction has been recently described, PA pulsatility index (PAPi) calculated as [PA systolic pressure - PA diastolic pressure] / right atrial pressure (RAP) is associated with RV failure in patients with acute inferior myocardial infarction requiring temporary mechanical support as well in the post operatively patients with continuous flow left ventricular assist devices (LVADs).7–9 To our knowledge, the utility of PAPi in predicting mortality in patients with PAH has never been tested. Accordingly, we sought to test the hypothesis that low PAPi among patients with PAH would be associated with an increased probability of death in the National Institutes of Health Registry for Primary PH (NIH-RPPH) database.
Methods
The NIH-RPPH database was one of the first PAH registries established (patients included idiopathic, familial, and anorexigen-associated PAH; now called WHO Group 1) with the specific purpose of defining the natural history of the disease, determinants of severity and how the disease trajectory was modified with therapy. The methodology and enrollment including the determinants of 5-year survival have previously been published.3 Briefly, PAH patients were enrolled from 32 medical centers across the United States. Pulmonary hypertension was hemodynamically defined as mean pulmonary artery pressure (mPAP) of greater than 25 mmHg at rest with a pulmonary artery wedge pressure (PAWP) of less than 15 mmHg. Other secondary causes of pulmonary hypertension were excluded. For example, pulmonary hypertension related to congenital abnormalities of the heart, lung and diaphragm, chronic pulmonary thromboembolic disease (now WHO group 4), sickle cell anemia (WHO group 5), prior use of intravenous recreational drugs, chronic obstructive lung disease, interstitial lung disease, arterial hypoxemia (WHO group 3), collagen vascular disease, parasitic disease with lung involvement, and pulmonary hypertension secondary to left heart disease (WHO group 2). The current analysis was conducted with a de-identified public release of the NIH primary PH database.
Study Design and Outcomes
In order to investigate the association between PAPi and survival probability in the NIH-RPPH database, we analyzed all patients in the database with complete invasive hemodynamic variables for the calculation of PAPi and the Pulmonary Hypertension Connection (PHC) risk equation. The PHC is a contemporary PAH risk equation that was derived in the current era of pulmonary vasodilator therapy.10
We calculated PAPi and the PHC risk equation from invasively derived hemodynamic data. The 5-year probability of survival using the PHC risk equation was calculated as an integer between 0 and 1 based on the, mPAP, right atrial pressure (RAP), and cardiac index (CI). Patients were then stratified based on PAPi quartiles with their representative hemodynamic profiles. The 5 -year survival probabilities and group comparisons for the four PAPi quartiles characteristics were then evaluated using a multivariable Cox proportional hazards model. Kaplan-Meier survival curves were determined using Log-rank statistic. Multivariable logistic regression and receiver operating characteristic (ROC) analysis were used to analyze the impact of PAPi and other key covariates on 5-year survival.
Statistics Analysis
Statistical analysis was conducted using SAS 9.4 (SAS Institute, Cary, NC). Analyses of categorical variables were conducted using the Chi-square test. The Fisher exact test was used for categorical variables with low frequencies. The Wilcoxon rank sum test was used to test for differences in continuous variables. Categorical variables are presented as frequencies with percentages, whereas continuous variables are described using medians and interquartile ranges (IQR). Survival analysis and Kaplan-Meier plots are used to show differences in adverse events between groups with stratification based on key predictor variables. The log rank test was used to compare differences between groups. Multivariable Cox proportional hazards regression and multivariable logistic regression were used to model associations of multiple independent variables of interest with the endpoints of interest during follow-up. Receiver operating characteristic curves were constructed based on logistic regression results. An alpha value of 0.05 was used for statistical significance.
Results
Baseline Characteristics
The database for the NIH-RPPH contains records for 310 patients. Of these, 272 had complete invasive hemodynamics for determination of the PHC risk equation and the PAPi, and these patients (N=272) were used in the present analysis. The mean age of patients was 37.7 ± 15.9 years old, 63% were female, and 72% had race reported as “white”. 141 of the 272 patients (51.8%) died during 5 years of follow-up. The distribution of baseline demographic characteristics, by quartile of PAPi is shown in Table 1, while the distribution of baseline hemodynamic characteristics by quartile of PAPi is shown in Table 2. Of note, there were no significant differences in age, gender, or race in PAPi quartiles. With respect to hemodynamic measurements, Table 2 demonstrates that the following variables were significantly different among PAPi quartiles: PAWP, PA diastolic pressure (PADP), mean RA pressure, PA pulse pressure (PPP), RV stroke work index (RVSWI), and cardiac index (CI).
Table 1.
Demographics of the population cohort by quartiles (Q1-Q4).
| Variables | PAPi Q1 (<3.7) | PAPi Q2 (3.7–5.8) | PAPi Q3 (5.9–9.2) | PAPi Q4 (>9.2) | P-Value |
|---|---|---|---|---|---|
| n=67 | n=69 | n=68 | n=68 | ||
| Age | 38 (28–48) | 40 (33–50) | 35 (26–46) | 36 (23–48) | 0.13 |
| Female gender (n, %) | 42 (63%) | 40 (58%) | 39 (57%) | 49 (72%) | 0.26 |
| Race (%) | 0.21 | ||||
| White | 54 (78%) | 50 (74%) | 49 (72%) | 43 (63%) | |
| AA | 9 (13%) | 6 (9%) | 9 (13%) | 13 (19%) | |
| Other | 6 (9%) | 11 (17%) | 10 (15%) | 12 (18%) | |
| BMI | 23 (19–28) | 24 (20–26) | 22 (19–27) | 23 (19–25) | 0.62 |
AA, African American; BMI, body mass index; PAPi, pulmonary artery pulsatility index.
Table 2.
Hemodynamic measurements and calculation by quartiles (Q1-Q4).
| Variables | PAPi Q1 (<3.7) | PAPi Q2 (3.7–5.8) | PAPi Q3 (5.9–9.2) | PAPi Q4 (>9.2) | P-Value |
|---|---|---|---|---|---|
| Directly measured hemodynamics | |||||
| Mean PAP (mmHg) | 58 (48–67) | 56 (48–64) | 54 (44–65) | 55 (48–65) | 0.75 |
| PCWP (mmHg) | 10 (7–13) | 9 (6–11) | 8 (6–10) | 5 (4–8) | <0.0001 |
| PASP (mmHg) | 84 (70–95) | 85 (72–100) | 85 (70–103) | 90 (76–104) | 0.40 |
| PADP (mmHg) | 43 (33–50) | 40 (34–46) | 36 (30–45) | 35 (30–43) | 0.01 |
| Mean RAP (mmHg) | 17 (13–21) | 10 (38–12) | 7 (5–8) | 3 (2–5) | <0.0001 |
| Calculated hemodynamics | |||||
| TPG (mmHg) | 46 (38–55) | 46 (36–57) | 45 (36–57) | 50 (42–59) | 0.38 |
| PVR (Wood units) | 15 (10–19) | 12 (8–19) | 12 (9–17) | 12 (9–19) | 0.28 |
| PA pulse pressure (mmHg) | 40 (30–53) | 45 (37–55) | 50 (38–58) | 53 (44–60) | <0.0001 |
| PA capacitance (ml/mmHg) | 0.8 (0.6–1.2) | 1.0 (0.7–1.7) | 0.9 (0.5–1.5) | 0.9 (0.6–1.3) | 0.62 |
| RVSWI (g/m2) | 10 (8–14) | 16 (12–20) | 20 (13–25) | 24 (15–28) | <0.0001 |
| PA elastance (mmHg/ml) | 2.6 (2–3) | 1.9 (1–3) | 1.8 (1–3) | 2.0 (1–3) | 0.10 |
| CI (L/min/m2) | 1.8 (1–2) | 2.1 (2–3) | 2.2 (2–3) | 2.5 (2–3) | <0.0001 |
CI, Cardiac Index; PA, pulmonary artery; PAP, pulmonary artery pressure; PADP, pulmonary artery diastolic pressure; PASP, pulmonary artery systolic pressure; PCWP, pulmonary capillary wedge pressure; PVR, pulmonary vascular resistance; RAP, right atrial pressure; RVSWI, right ventricle stroke work index; TGP, transpulmonary gradient.
Distribution of PAPi
As shown in Figure 1, the distribution of PAPi was skewed to the right in this cohort with a median value of 5.8 (IQR 3.7.−9.2). Higher values above 10–56 were present and driven by either low right atrial pressure or high pulmonary pulse pressures.
Figure 1: Histograms of (A) PAPi Distribution.

The histogram showing the distribution of the pulmonary artery pulsatility index (PAPi).
Survival Analysis
As shown in Figure 2, survival was different among PAPi quartiles (log-rank P = 0.0001) and was lowest in the PAPi quartile 1. The separation between the quartile 1 survival curve and the survival curves for quartiles 2–4 is evident within the first few months of follow-up. Survival in the middle PAPi quartiles was similar, while separation between the quartile 4 survival curve and the quartile 2–3 survival curves became more prominent after the first year of follow-up.
Figure 2: Kaplan Meier Survival Curves for the Quartiles of PAPi.

Kaplan Meier survival curves are shown by quartiles of PAPi.
Because the survival curve for quartile 1 was distinctly worse compared with the survival curves for quartiles 2–4, we constructed survival curves dichotomized for these two groups in Figure 3. The distinct prognosis for patients in PAPi quartile 1 at baseline compared with the other groups is evident graphically and statistically significant (P < 0.0001). One-year survival was 50.7% in PAPi quartile 1 versus 74.6% in the remaining patients, and three-year survival was 32.8% in PAPi quartile 1 versus 58.5% in the remaining patients (P < 0.0001).
Figure 3: Kaplan Meier Survival Curves for PAPi.
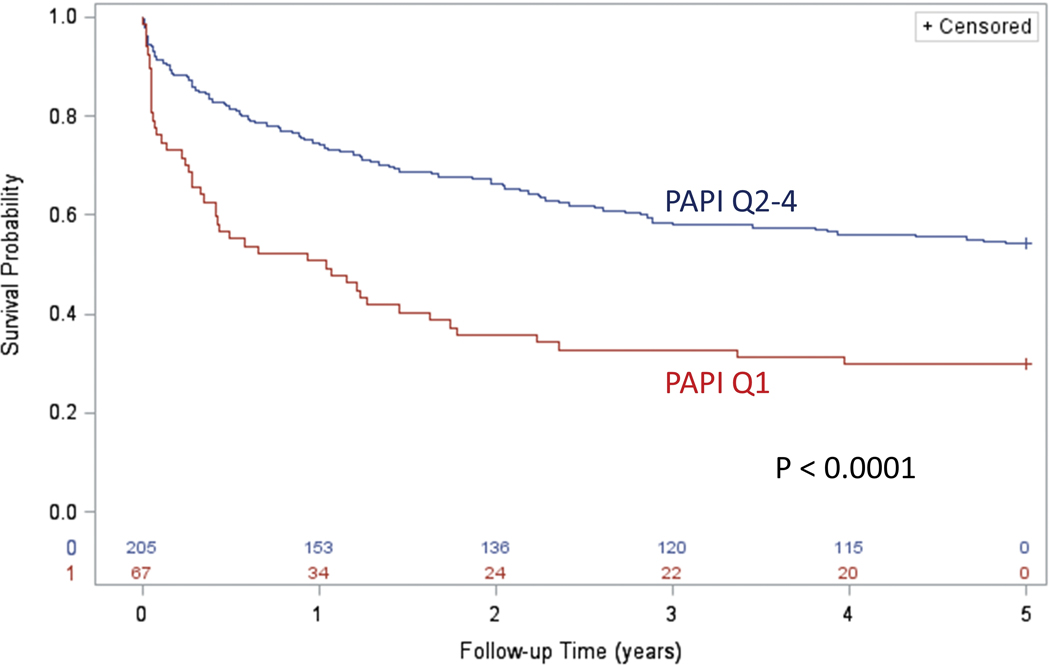
Kaplan Meier survival curves comparing PAPi in the lowest quartile versus remaining patients are shown.
Bivariable Associations for Hemodynamic Parameters with Respect to Survival with Cox Proportional Hazards Regression
Bivariable Cox proportional hazards regression was performed to evaluate associations for demographic and hemodynamic variables with survival (Table 3). Significant bivariable hazard ratios were obtained for PAPi, the PHC risk equation, body mass index (BMI), RVSWI, PA capacitance (PAC), PA elastance, and right atrial pressure. The bivariable hazard ratio for PAPi was 0.955 (95% CI 0.927–0.983) per unit increase. RAP however had higher odds for adverse events than PAPi 1.064 (95% CI 1.037–1.092) per unit increase, p < 0.0001.
Table 3:
Bivariable (Univariable) Cox Regression Analysis for Survival
| HR (95% CI) | Chi Square χ² | P value | |
|---|---|---|---|
| PAPi (per 1 unit) | 0.955 (0.927–0.983) | 9.6 | 0.002 |
| PHC-RISK (per 0.01) | 0.954 (0.934–0.974) | 19.2 | <0.0001 |
| BMI (per kg/m2) | 0.959 (0.935–0.984) | 10.1 | 0.002 |
| RVSWI (g/m2) | 0.965 (0.941–0.990) | 7.6 | 0.006 |
| PAC (per ml/mm Hg) | 0.529 (0.378–0.740) | 13.8 | 0.002 |
| PCWP (per mm Hg) | 1.005 (0.970–1.041) | 0.08 | 0.78 |
| RAP (per mm Hg) | 1.064 (1.037–1.092) | 22.6 | <0.0001 |
BMI, body mass index; PAC, pulmonary artery capacitance; PCWP, pulmonary capillary wedge pressure; PVR, pulmonary vascular resistance; RAP, right atrial pressure; RVSWI, right ventricle stroke work index
Multivariable Associations for Hemodynamic Parameters with Respect to Survival with Cox Proportional Hazards Regression
Variable selection for the multivariable Cox proportional hazards regression model was performed iteratively with only variables that had an adjusted p-value less than 0.05 accepted for the final model. As shown in Table 4, the best 4-variable model included PAPi, the PHC-Risk score (range 0–1), BMI, and PAC. When right atrial pressure was added as a fifth covariate in this model, it was not statistically significant (P=0.99), and all four other covariates remained significant (P<0.05) The adjusted hazard ratio for PAPi in this model was 0.946 (95% CI 0.905–0.989) per unit increase in PAPi, indicating that increasing PAPi was associated with better outcomes. As hypothesized, a PHC score closer to 1 was associated with better outcomes, as was increasing BMI and increasing PAC. None of the other hemodynamic or demographic variables (including age and gender) were significant when adjusted for these 4 covariates.
Table 4:
Best Multivariable Cox Regression Model for Survival
| HR (95% CI) | Chi Square χ² | P value | |
|---|---|---|---|
| PAPi (per 1 unit) | 0.946 (0.905–0.989) | 6.0 | 0.01 |
| PHC-RISK (per 0.01) | 0.969 (0.944–0.996) | 5.2 | 0.02 |
| BMI (per kg/m2) | 0.943 (0.912–0.974) | 12.2 | 0.0005 |
| PAC (per ml/mm Hg) | 0.613 (0.434–0.864) | 7.8 | 0.005 |
BMI, body mass index; PAC, pulmonary artery capacitance; PAPi, pulmonary artery pulsatility index; PHC, Pulmonary hypertension connection risk equation
Receiver Operating Characteristic Analysis and Multivariable Logistic Regression Model
The corresponding multivariable logistic regression analysis for these covariates for the outcome of 5-year survival is shown in Table 5. PAPi had an odds ratio (OR) of 0.930 (95% CI 0.877–0.986) and the second-highest chi-square statistic in the model. The corresponding receiver operating characteristic (ROC) analysis is shown in Figure 4. The ROC areas for 5-year survival for bivariable models with PAPi, BMI, PHC Risk, and PAC were 0.63, 0.62, 0.64, and 0.65, respectively (P < 0.01 for all). The ROC Area for all 4 covariates was 0.77 (P < 0.0001).
Table 5:
Best Multivariable Logistic Regression Model for 5-Year Survival (ROC=0.774)
| OR (95% CI) | Chi Square χ² | P value | |
|---|---|---|---|
| PAPi (per 1 unit) | 0.930 (0.877–0.986) | 5.9 | 0.02 |
| PHC-RISK (per 0.01) | 0.944 (0.899–0.991) | 5.5 | 0.02 |
| BMI (per kg/m2) | 0.899 (0.849–0.951) | 13.6 | 0.0002 |
| PAC (per ml/mm Hg) | 0.614 (0.388–0.971) | 4.4 | 0.04 |
BMI, body mass index; PAC, pulmonary artery capacitance; PAPi, pulmonary artery pulsatility index; PHC, Pulmonary hypertension connection risk equation
Figure 4: ROC Analysis for Pulmonary Artery Pulsatility Indices.
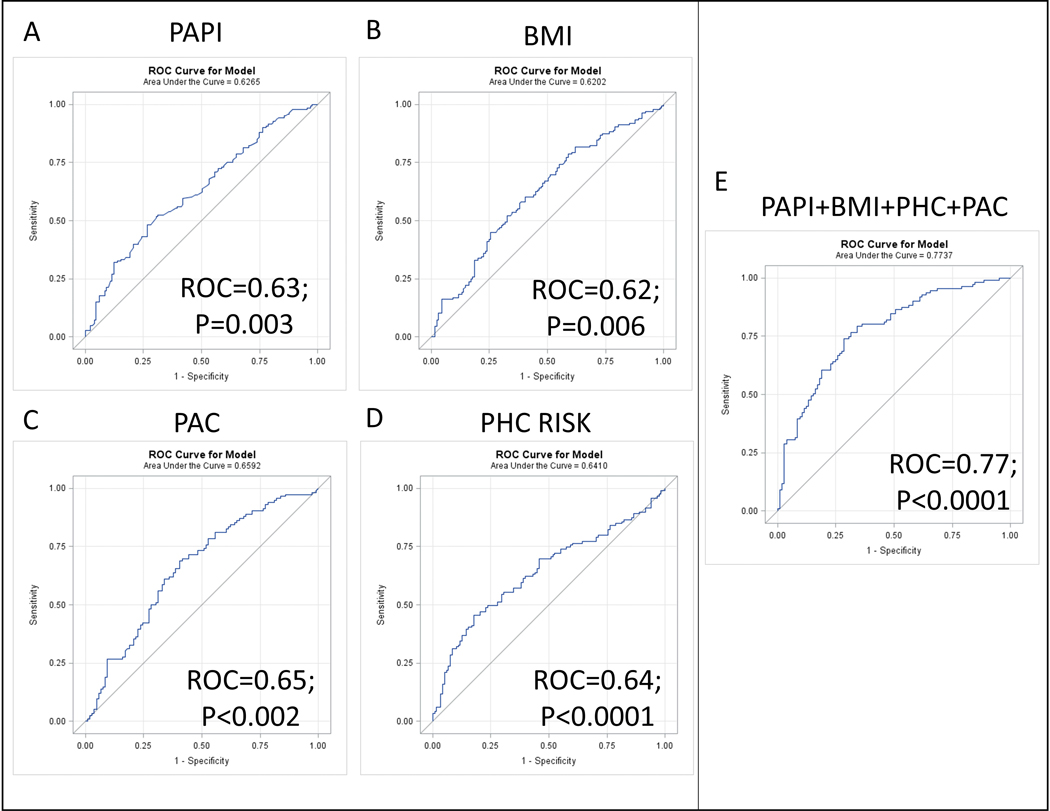
Receiver Operating Characteristic (ROC) curves are shown for the multivariable logistic regression model for 5-year survival with the Pulmonary artery pulsatility index (A), BMI (B), PAC (C), the PHC risk equation (D), and all four variables together (E).
Discussion
The present analysis investigated the relationship between a novel hemodynamic marker, PAPi and the probability of 5-year survival in patients with pulmonary arterial hypertension in the NIH-RPPH database. Our results demonstrate that PAPi is strongly associated with mortality among patients with PAH. The first key finding was that decreased PAPi was independently associated with mortality during the five years of follow up even after adjustment for the PHC risk equation and key hemodynamic indices. Second, patients in the lowest PAPi quartile had a profile of hemodynamic indices associated with severe RV failure. Notably these patients had significantly elevated RAP, lower CI, and RSVWI. Third, the range of distribution of PAPi in PAH was wider than that reported in prior PAPi studies involving acute RV failure (in the clinical context of inferior AMI and postoperative cLVAD placement).7–9 This broader range of PAPi distribution may very well be a reflection of the sustained adaptive RV remodeling in the face of persistently elevated PA pressures, in marked contrast to the RV failure in related to acute inferior MI and postoperative LVAD.
In PAH, increased afterload impairs RV contractility leading to RV failure and death. The degree to which the RV adapts to the chronically elevated pulmonary artery pressures is a key determinant of survival and prognosis.11,12 PAPi is an integrated hemodynamic index of VA coupling, and more specifically, a marker of RV adaptive response to afterload. The component variables used in the calculation of PAPi are PPP as the numerator and RAP as the denominator. Pulmonary artery pulse pressure reflects the combined effects of RV contractility and pulmonary vascular distensibility (pulmonary arterial capacitance).13,14 Taken in isolation, PPP in prior studies has not been shown to linearly correlate with mortality.15 However, PPP invariably rises with the progression of PAH and parallels a worsening of pulmonary vascular bed stiffness. Distal pulmonary vascular bed stiffness mirrors elevations in pulmonary vascular resistance (PVR), a pernicious marker of mean resistive load and pulmonary arterial stiffness. Importantly this has profound hemomdynamic implications on the RV. For example, decreased pulmonary arterial compliance enhances premature reflection of arterial wave from the distal vascular bed, further increasing the pulmonary artery systolic pressure (PASP). Taken, together, this has a net effect of augmenting the pulsatile load on the right ventricle.16 Importantly, however, the magnitude of PASP and the amplitude of PPP can both be attenuated by the development of severe RV dysfunction. When the RV contractile reserve is exhausted and the RV is unable to generate sufficient pulsatility to offset the increased afterload, then the PA pressures and PPP concurrently decrease.17 We observed statistically significant lower PPP among patients in the lowest PAPi quartile compared to the rest of the quartiles, although the mean pulmonary artery pressure was not statistically different between these groups. As we anticipated, the lowest PAPi quartile had significantly higher RAP signaling the important role of right sided filling pressures in predicting RV failure. In fact, RAP in isolation on bivariable analysis (Table 3) had a higher odds ratio than PAPi (22.1 vs 9.6), implying that the strength of PAPi in predicting outcomes was driven by the increase in RAP.
There is overwhelming evidence from multiple studies validating the prognostic role of elevated RAP in PAH.3,10,18,19 The fact that the lowest PAPi quartile had a constellation of unfavorable hemodynamic variables associated with poor RV function (low CI and RVSWI),3,18 was perhaps a reflection of the maladaptive heterometric remodeling of the RV in the face of chronically elevated RV afterload. It has been previously shown, within normal physiological limits that the RV adapts to increased afterload by increasing contractility (without chamber dilatation), through a homeometric response referred to as the Anrep effect.20,21 In addition to the aforementioned autoregulatory mechanism, right ventricular performance is further maintained, in conditions of chronically elevated RV afterload, by yet another adaptive mechanism that involves RV chamber dilatation (heterometric autoregulation) in line with the Frank-Starling law. However, these adaptive mechanisms come at a price of greater increase in right ventricular end-diastolic filling pressures and central venous congestion as evidenced by the hemodynamic profiles in this cohort.22,23 Additionally, we noted a higher PAWP in the lower PAPi quartile compared to the rest of the quartiles (albeit below the threshold 15 mmHg). One could speculate that the higher left sided filling pressures in the lowest quartile group was related to abnormalities in left ventricular relaxation owing to interventricular dependence. In severe RV failure decreased RV output results in decreased left ventricle end-diastolic volume (LVEDV) through interventricular interaction mechanism (reverse Bernheim effect);24,25 however, we did not have echocardiographic data to correlate these hemodynamic parameters of severe RV failure and the effect on the left ventricle.
To our knowledge this is the first study to employ PAPi in the risk stratification of patients with PAH. These findings support the use of PAPi in the risk stratification of patients with PAH. From a clinical utility standpoint, PAPi is easy to calculate and relies on only 3 invasively measured parameters (PASP, PADP and RAP) and may be better applied in combination with other variables (Figure E) rather than in isolation. The sparse availability of clinical risk stratification tools in PAH dictates the adoption of multiple risk models. Accordingly, there have been clarion calls for the adoption of more robust markers and endpoints that mirror disease severity and track with treatment response.26–29
Limitations
In this retrospective analysis of a well-conducted NIH-RPPH, we note some limitations worth of mention; first, the phenotype of PAH patients has considerably changed over the years with respect to age and gender. The NIH-RPPH had relatively younger, predominantly female patients compared to the more contemporary PAH registries.30 Second, survival of patients with PAH in the current era of pulmonary vasodilator therapies has modestly improved by about 10%, in contrast to the era when this study was conducted.18,31 Third, there has been multiple PH guideline updates since the conclusion of the registry, including several schematic modifications in the classification system.32 Fourth, we did not have echocardiographic images to correlate with the hemodynamic data. These are offset by the many strengths of this analysis, including a primary focus on objective hemodynamic measurements, the use of the contemporaneous PHC equation for risk adjustment and the multicenter enrollment nature of the study.
Conclusions
PAPi was independently associated with survival in PAH patients even after adjustment for the PHC risk equation. RAP in isolation however had higher odds of adverse events than PAPi. These findings support further investigation into the use of PAPi in multivariable models in guiding PAH risk stratification.
Acknowledgments
We acknowledge the help of the National Institutes of Health in making its database available for secondary analysis.
Abbreviations
- BMI
Body Mass Index
- CI
Cardiac Index
- IQR
Interquartile range
- LVAD
left ventricular assist device
- NIH-RPPH
National Institutes of Health Registry for Primary Pulmonary Hypertension
- PA
Pulmonary artery
- PAC
Pulmonary arterial capacitance
- PADP
Pulmonary arterial diastolic pressure
- PASP
Pulmonary arterial systolic pressure
- PAH
Pulmonary arterial hypertension
- PAPi
Pulmonary artery pulsatility index
- PCWP
Pulmonary capillary wedge pressure
- PHC
Pulmonary Hypertension Connection
- PPP
Pulmonary Artery Pulse Pressure
- RAP
Right atrial pressure
- ROC
Receiver operating characteristic
- RV
Right ventricle
- RVSWI
Right ventricular stroke work index
- VA
Ventriculo-arterial
- WHO
World Health Organization
Disclosure statement
None of the authors has a financial relationship with a commercial entity that has an interest in the subject of the presented manuscript or other conflicts of interest to disclose.
References:
- 1.Haddad F, Hunt SA, Rosenthal DN, Murphy DJ. Right ventricular function in cardiovascular disease, part I: Anatomy, physiology, aging, and functional assessment of the right ventricle. Circulation. 2008;117(11):1436–1448. [DOI] [PubMed] [Google Scholar]
- 2.Farber HW, Loscalzo J. Pulmonary arterial hypertension. N Engl J Med. 2004;351(16):1655–1665. [DOI] [PubMed] [Google Scholar]
- 3.D’Alonzo GE, Barst RJ, Ayres SM, et al. Survival in patients with primary pulmonary hypertension. Results from a national prospective registry. Ann Intern Med. 1991;115(5):343–349. [DOI] [PubMed] [Google Scholar]
- 4.Benza RL, Miller DP, Gomberg-Maitland M, et al. Predicting survival in pulmonary arterial hypertension: insights from the Registry to Evaluate Early and Long-Term Pulmonary Arterial Hypertension Disease Management (REVEAL). Circulation. 2010;122(2):164–172. [DOI] [PubMed] [Google Scholar]
- 5.Sachdev A, Villarraga HR, Frantz RP, et al. Right ventricular strain for prediction of survival in patients with pulmonary arterial hypertension. Chest. 2011;139(6):1299–1309. [DOI] [PubMed] [Google Scholar]
- 6.Champion HC, Michelakis ED, Hassoun PM. Comprehensive invasive and noninvasive approach to the right ventricle-pulmonary circulation unit: state of the art and clinical and research implications. Circulation. 2009;120(11):992–1007. [DOI] [PubMed] [Google Scholar]
- 7.Korabathina R, Heffernan KS, Paruchuri V, et al. The pulmonary artery pulsatility index identifies severe right ventricular dysfunction in acute inferior myocardial infarction. Catheter Cardiovasc Interv. 2012;80(4):593–600. [DOI] [PubMed] [Google Scholar]
- 8.Kang G, Ha R, Banerjee D. Pulmonary artery pulsatility index predicts right ventricular failure after left ventricular assist device implantation. J Heart Lung Transplant. 2016;35(1):67–73. [DOI] [PubMed] [Google Scholar]
- 9.Morine KJ, Kiernan MS, Pham DT, Paruchuri V, Denofrio D, Kapur NK. Pulmonary Artery Pulsatility Index Is Associated With Right Ventricular Failure After Left Ventricular Assist Device Surgery. J Card Fail. 2016;22(2):110–116. [DOI] [PubMed] [Google Scholar]
- 10.Thenappan T, Glassner C, Gomberg-Maitland M. Validation of the pulmonary hypertension connection equation for survival prediction in pulmonary arterial hypertension. Chest. 2012;141(3):642–650. [DOI] [PubMed] [Google Scholar]
- 11.Vonk Noordegraaf A, Galie N. The role of the right ventricle in pulmonary arterial hypertension. Eur Respir Rev. 2011;20(122):243–253. [DOI] [PMC free article] [PubMed] [Google Scholar]
- 12.Vonk-Noordegraaf A, Haddad F, Chin KM, et al. Right heart adaptation to pulmonary arterial hypertension: physiology and pathobiology. J Am Coll Cardiol. 2013;62(25 Suppl): D22–33. [DOI] [PubMed] [Google Scholar]
- 13.Reuben SR, Swadling JP, Gersh BJ, Lee Gde J. Impedance and transmission properties of the pulmonary arterial system. Cardiovasc Res. 1971;5(1):1–9. [DOI] [PubMed] [Google Scholar]
- 14.Ha B, Lucas CL, Henry GW, Frantz EG, Ferreiro JI, Wilcox BR. Effects of chronically elevated pulmonary arterial pressure and flow on right ventricular afterload. Am J Physiol. 1994;267(1 Pt 2): H155–165. [DOI] [PubMed] [Google Scholar]
- 15.Blyth KG, Syyed R, Chalmers J, et al. Pulmonary arterial pulse pressure and mortality in pulmonary arterial hypertension. Respir Med. 2007;101(12):2495–2501. [DOI] [PubMed] [Google Scholar]
- 16.Thenappan T, Prins KW, Pritzker MR, Scandurra J, Volmers K, Weir EK. The Critical Role of Pulmonary Arterial Compliance in Pulmonary Hypertension. Ann Am Thorac Soc. 2016;13(2):276–284. [DOI] [PMC free article] [PubMed] [Google Scholar]
- 17.Sitbon O, Humbert M, Nunes H, et al. Long-term intravenous epoprostenol infusion in primary pulmonary hypertension: prognostic factors and survival. J Am Coll Cardiol. 2002;40(4):780–788. [DOI] [PubMed] [Google Scholar]
- 18.Humbert M, Sitbon O, Chaouat A, et al. Survival in patients with idiopathic, familial, and anorexigen-associated pulmonary arterial hypertension in the modern management era. Circulation. 2010;122(2):156–163. [DOI] [PubMed] [Google Scholar]
- 19.Sandoval J, Bauerle O, Palomar A, et al. Survival in primary pulmonary hypertension. Validation of a prognostic equation. Circulation. 1994;89(4):1733–1744. [DOI] [PubMed] [Google Scholar]
- 20.von Anrep G On the part played by the suprarenals in the normal vascular reactions of the body. J Physiol. 1912;45(5):307–317. [DOI] [PMC free article] [PubMed] [Google Scholar]
- 21.Danton MH, Greil GF, Byrne JG, Hsin M, Cohn L, Maier SE. Right ventricular volume measurement by conductance catheter. Am J Physiol Heart Circ Physiol. 2003;285(4):H1774–1785. [DOI] [PubMed] [Google Scholar]
- 22.Patterson SW, Starling EH. On the mechanical factors which determine the output of the ventricles. J Physiol. 1914;48(5):357–379. [DOI] [PMC free article] [PubMed] [Google Scholar]
- 23.Szabo G, Soos P, Bahrle S, et al. Adaptation of the right ventricle to an increased afterload in the chronically volume overloaded heart. Ann Thorac Surg. 2006;82(3):989–995. [DOI] [PubMed] [Google Scholar]
- 24.Belenkie I, Smith ER, Tyberg JV. Ventricular interaction: from bench to bedside. Ann Med. 2001;33(4):236–241. [DOI] [PubMed] [Google Scholar]
- 25.Bemis CE, Serur JR, Borkenhagen D, Sonnenblick EH, Urschel CW. Influence of right ventricular filling pressure on left ventricular pressure and dimension. Circ Res. 1974;34(4):498–504. [DOI] [PubMed] [Google Scholar]
- 26.van de Veerdonk MC, Kind T, Marcus JT, et al. Progressive right ventricular dysfunction in patients with pulmonary arterial hypertension responding to therapy. J Am Coll Cardiol. 2011;58(24):2511–2519. [DOI] [PubMed] [Google Scholar]
- 27.Rubin LJ. The 6-minute walk test in pulmonary arterial hypertension: how far is enough? Am J Respir Crit Care Med. 2012;186(5):396–397. [DOI] [PubMed] [Google Scholar]
- 28.The Rich S. 6-minute walk test as a primary endpoint in clinical trials for pulmonary hypertension. J Am Coll Cardiol. 2012;60(13):1202–1203. [DOI] [PubMed] [Google Scholar]
- 29.Gaine S, Simonneau G. The need to move from 6-minute walk distance to outcome trials in pulmonary arterial hypertension. Eur Respir Rev. 2013;22(130):487–494. [DOI] [PMC free article] [PubMed] [Google Scholar]
- 30.McGoon MD, Benza RL, Escribano-Subias P, et al. Pulmonary arterial hypertension: epidemiology and registries. J Am Coll Cardiol. 2013;62(25 Suppl): D51–59. [DOI] [PubMed] [Google Scholar]
- 31.Ling Y, Johnson MK, Kiely DG, et al. Changing demographics, epidemiology, and survival of incident pulmonary arterial hypertension: results from the pulmonary hypertension registry of the United Kingdom and Ireland. Am J Respir Crit Care Med. 2012;186(8):790–796. [DOI] [PubMed] [Google Scholar]
- 32.Simonneau G, Gatzoulis MA, Adatia I, et al. Updated clinical classification of pulmonary hypertension. J Am Coll Cardiol. 2013;62(25 Suppl): D34–41. [DOI] [PubMed] [Google Scholar]