Abstract
Over-expression of B7-H1 (PD-L1) molecule in the tumor microenvironment (TME) is a major immune evasion mechanism in some cancer patients and antibody blockade of the B7-H1/PD-1 interaction can normalize compromised immunity without excessive side-effects. Using a genome-scale T-cell activity array, we identified Siglec-15 as a critical immune suppressor. While only expressed on some myeloid cells normally, Siglec-15 is broadly upregulated on human cancer cells and tumor-infiltrating myeloid cells, and its expression is mutually exclusive to B7-H1, partially due to its induction by M-CSF and downregulation by IFN-γ. We demonstrate that Siglec-15 suppresses antigen-specific T-cell responses in vitro and in vivo. Genetic ablation or antibody blockade of Siglec-15 amplifies anti-tumor immunity in the TME and inhibits tumor growth in some mouse models. Taken together, our results support Siglec-15 as a potential target for normalization cancer immunotherapy.
Keywords: suppression, cancer, immune, tumor-associated macrophages, immunotherapy
Introduction
While antigen is required for T-cells to initiate the activation process, the specific ligand-receptor interactions on the cell surface, such as the molecules in the B7-CD28 family and the tumor necrosis factor superfamily, transmit either positive or negative signals to T-cells and determine the direction and fate of the immune response1-3. Manipulation by antagonizing or agonizing these signals can selectively amplifies immune responses and eliminates tumors4-7. In addition to the magnitude of the immune response, the geographic location where the response is generated and executed is critical in the context of cancer immunotherapy. Selective amplification of anti-tumor immunity in the TME has led to highly efficacious cancer immunotherapies without excessive side-effects8,9. A conceptually important advance in cancer immunology in recent years is the presence of adaptive resistance mechanisms in the TME to prevent the execution of tumor immunity. For example, B7-H1 (CD274, PD-L1)10,11 is selectively induced in the TME, predominantly by interferon-gamma (IFN-γ) from tumor infiltrating T-lymphocytes, which in turn initiates a series of events including the engagement of PD-1 on T-cells, transmission of apoptosis and exhaustion signals, which eventually leads to the dysfunction of T-cells, a process collectively called adaptive resistance7,12,13. Blockade of the B7-H1/PD-1 pathway by specific mAbs to B7-H1 or PD-1 (anti-PD therapy) prevents the dysfunction of T-cells and selectively restores immune responses in the TME7-9. This strategy, collectively called normalization cancer immunotherapy14, is remarkably effective for the treatment of cancer, as demonstrated clinically by the regression of a broad spectrum of advanced cancers and by significant survival benefits in patients8,15,16.
Immune evasion mechanisms in the TME of advanced human cancers are highly heterogeneous. Based on our recent definitions used to classify Tumor Immunity in the Microenvironment (TIME), the B7-H1/PD-1 pathway is responsible for dysfunctional immunity in fewer than 40% of human solid tumors12,15,17. Ample evidence supports that, in addition to the upregulation of B7-H1, many other molecular or cellular mechanisms can also contribute to dysfunctional immunity in the TME. These mechanisms include, but are not limited to, a lack of sufficient immune cell infiltration, accumulation of regulatory T-cells, the presence of tumor associated macrophages (TAMs) and myeloid-derived suppressive cells (MDSCs), as well as upregulation of suppressive molecules, cytokines, metabolites and down-regulation of immune stimulatory molecules 18,19. Many of these mechanisms, however, may not be selective for the TME, and therefore, manipulation of these pathways could lead to a broad activation of the immune system with the risk of autoimmune toxicities8,20. The current success of anti-PD therapy highlights the importance of restoring defective immune responses in the TME as a principle for normalization cancer immunotherapy14.
Siglec-15 was originally identified as one of the Siglec gene family members with a characteristic sialic acid-binding immunoglobulin-type lectin structure21. While the role of Siglec-15 in osteoclast differentiation and bone remodeling has been reported22-25, its immunological function remains largely unknown. We demonstrate that the expression of Siglec-15 is normally limited to cells in myeloid lineage but can be upregulated in many human cancers. Employing a newly developed genome-scale T-Cell Activity Array (TCAA), mice with whole body or lineage-specific gene ablation and specific mAbs, we discovered Siglec-15 as an immune suppressive molecule largely operating in the TME, and is non-redundant to the B7-H1/PD-1 pathway.
Results
High-throughput screening of the human transmembrane proteome for the discovery of T-cell activity modulators
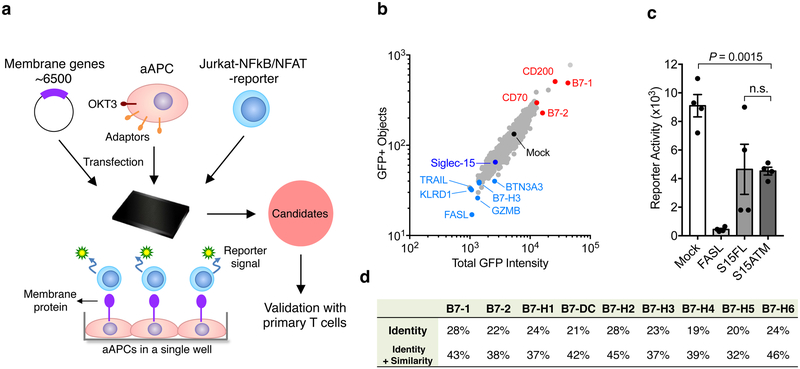
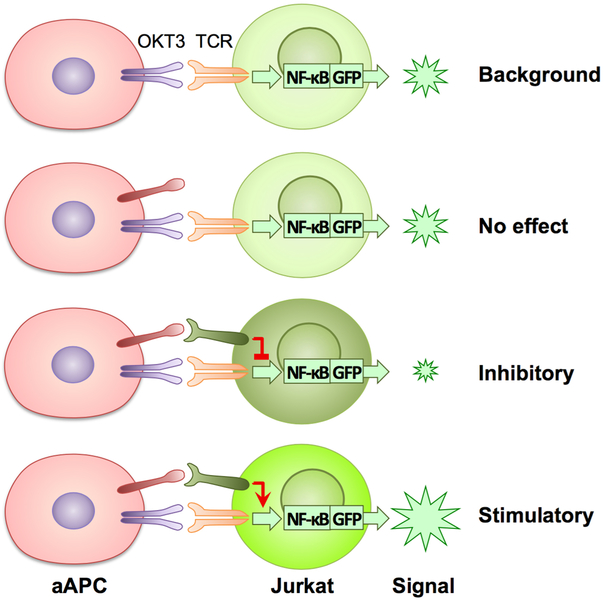
We constructed a high-throughput functional screening system (TCAA) to identify cell surface modulators of T-cell activities in vitro (Fig. 1a). The TCAA includes over 6,500 human genes encoding >90% of transmembrane proteins in the human genome. Individual genes were transiently expressed in the array, as previously described26,27. We engineered an artificial antigen-presenting cell line (aAPC) based on a 293T cell line that expressed a membrane-associated anti-human CD3 (OKT3) single chain variable fragment (scFv) for T-cell receptor stimulation and several transmembrane signaling adaptor genes (DAP10, DAP12, FCER1G and CD3Z) to facilitate membrane protein expression27. The function of target genes and their effect on T-cell activity was measured using a Jurkat T-cell line, where an NF-κB or NFAT response element-driven green fluorescence protein (GFP) reporter was stably expressed (Fig. 1a). Transmembrane proteins expressed on aAPCs that significantly enhanced or decreased GFP expression were compared to mock transfected controls for initial identification (Extended Data Fig. 1). Genes that consistently suppressed or enhanced GFP signals were selected after multiple rounds of TCAA screening and were subsequently subjected to comprehensive analyses in vivo and in vitro (see below). Among these candidates, some have been previously reported1,3,8,9 to be co-stimulatory (B7–1, B7–2, CD200, CD70), apoptotic (FASL, TRAIL, GZMB) or co-inhibitory (KLRD1, BTN3A3 etc.), which validated the relevance of our TCAA system (Fig. 1b). Siglec-15 consistently suppressed T-cell activity in the TCAA (Fig.1c) and has potential to meet major features for normalization cancer immunotherapy14, was therefore selected for further study.
Figure 1. Identification of Siglec-15 as a T-cell suppressive molecule in the TCAA.
(a) Schematic representation of TCAA for rapid screening of cell surface molecules with co-stimulatory and co-inhibitory activity. cDNA plasmids coding human membrane proteins were individually transfected into an artificial antigen presenting cell line (aAPC) overnight together with a pre-expressing transmembrane form of anti-human CD3 antibody (OKT3) scFv. Jurkat-NFκb/ NFAT-reporter T-cells were added into the wells and the effect of each transmembrane protein on OKT3-stimulated reporter activity is indicated as intensity of GFP fluorescence. The function of the candidate genes is further validated on primary human T-cells. Siglec-15 is one of the molecules selected for further study.
(b) A representative result of TCAA. GFP signals of Jurkat-NFκb reporter cells were quantified based on the GFP positivity of the objects (y -axis) and the GFP density (x -axis) in each well of the array. The results of ~1,500 genes in the TCAA shown as different dots are displayed. The GFP signal in the well transfected with the mock plasmid is shown as a black dot. The activity of several genes with known T-cell stimulatory (red), apoptotic or inhibitory (light blue) activity, as well as Siglec-15 (dark blue) is indicated. Data are representative of two independent experiments.
(c) A representative reporter activity of Jurkat-NFAT cells after co-culture with aAPC transfected with Fas ligand (FASL), full length Siglec-15 (S15FL), Siglec-15 ectodomain fused with B7-H6 transmembrane motif (S15ATM), or mock plasmid is displayed. Data are mean ± s.e.m. (n=4 cell cultures). P values by two-tailed unpaired t-test (n.s., not significant; P = 0.9462).
(d) The homology of human Siglec-15 with B7 family members. Shown are the % identity or identity plus similarity of amino acid sequences in the extracellular domains.
See also Extended Data Fig. 1.
Siglec-15 was previously characterized as a Siglec family gene encoding an exceptionally short extracellular domain (ECD)21. Protein sequence analysis revealed that the Siglec-15 ECD contains an immunoglobulin variable region (IgV) and a constant type 2 (IgC2) region, which exhibits over 30% homology with the B7 gene family (Fig. 1d), like others among the B7 family (Supplementary Table 1). These data suggest that Siglec-15 has a close relationship with the B7 gene family and potentially shares immune regulatory functions with B7 family members.
Siglec-15 is a macrophage-associated T-cell suppressive molecule
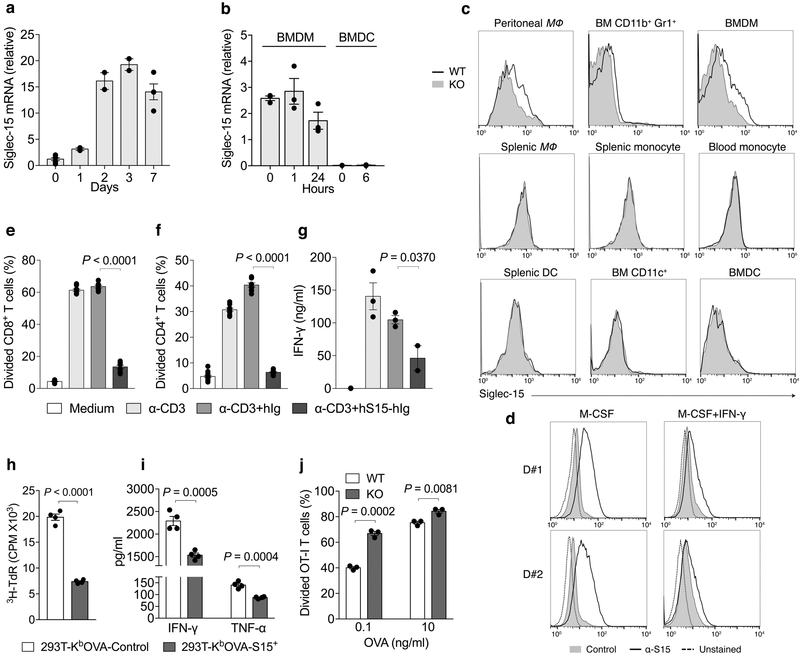
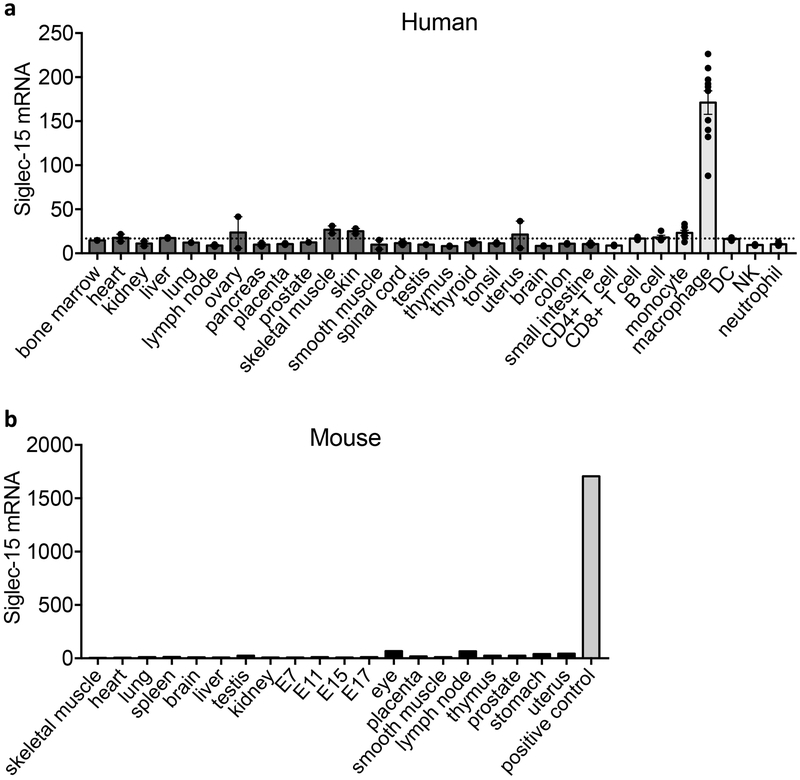
Siglec-15 mRNA expression is minimal in most normal human tissues and various immune cell subsets but can be found in macrophages (Extended Data Fig. 2a). This was validated via analysis of human macrophages derived from M-CSF stimulated monocytes (Fig. 2a). Similarly, mouse Siglec-15 mRNA was also not detectable in normal mouse tissues (Extended Data Fig. 2b). Siglec-15 mRNA is detected at low levels in bone marrow derived macrophages (BMDMs) but was absent in bone marrow derived dendritic cells (BMDCs), even after LPS stimulation (Fig. 2b).
Figure 2. Expression of Siglec-15 by macrophages and its inhibitory activity for T-cells.
(a, b) Quantitative PCR (Q-PCR) estimation on Siglec-15 mRNA levels in human macrophages derived from CD14+ peripheral blood monocytes with 100ng/ml M-CSF (a), or LPS-treated mouse BMDMs or BMDCs (b) at indicated time points. Data are mean ± s.e.m. after normalization to reference gene GAPDH (a), or RPL13a (b), and representative of two independent experiments.
(c) Flow cytometry analysis of Siglec-15 expression by anti-Siglec-15 mAb (clone m03) staining on mouse myeloid cell subsets from blood, spleen, bone marrow (BM) or peritoneal cavity of S15KO and WT mice. MΦ, macrophage. Data are representative of three independent experiments.
(d) Human macrophages were generated from CD14+ peripheral blood monocytes from two healthy donors (D#1 and D#2) with M-CSF for 7 days. Alternatively, monocytes were cultured with M-CSF for 4 days followed by M-CSF + IFN-γ for 3 more days. Siglec-15 expression was analyzed by flow cytometry with anti-Siglec-15 (clone 1H3) or an isotype control mAb staining.Data are representative of two independent experiments.
(e-g) The % of divided human peripheral CD8+ (e) or CD4+ T-cells (f) as indicated by CFSE dilution, as well as IFN-γ in the culture medium (g) after stimulation with 0.1 μg/ml of anti-CD3 in the presence of 5 μg/ml human Siglec-15 fusion protein (hS15-hIg) or control (hIg) for 3 days. (e and f, n = 6 cell cultures; g, n = 3 cell cultures from the same donor)
(h, i) OT-I T-cells pre-activated with OVA257-264 (1×10⁵/well) were co-cultured with irradiated 293T-KbOVA cells stably expressing Siglec-15 (293T-KbOVA-S15+) or mock (293T-KbOVA-Control) (2×10⁴/well) in a 96-well plate. OT-I T-cell proliferation was determined by 3H-thymidine incorporation at 72 hrs (h). The cytokine levels in the culture medium were analyzed at 48 hrs (i). (n = 4 cell cultures from the same mouse)
(j) The % of divided OT-I T-cells as indicated by CFSE dilution after co-cultured for 3 days with S15KO or WT peritoneal macrophages pulsed with OVA257-264 at the indicated concentrations. (n = 3 cell cultures)
In e-j, data are presented as mean ± s.e.m. and representative of two or three independent experiments. P values by two-tailed unpaired t-test.
See also Extended Data Figs. 2-4.
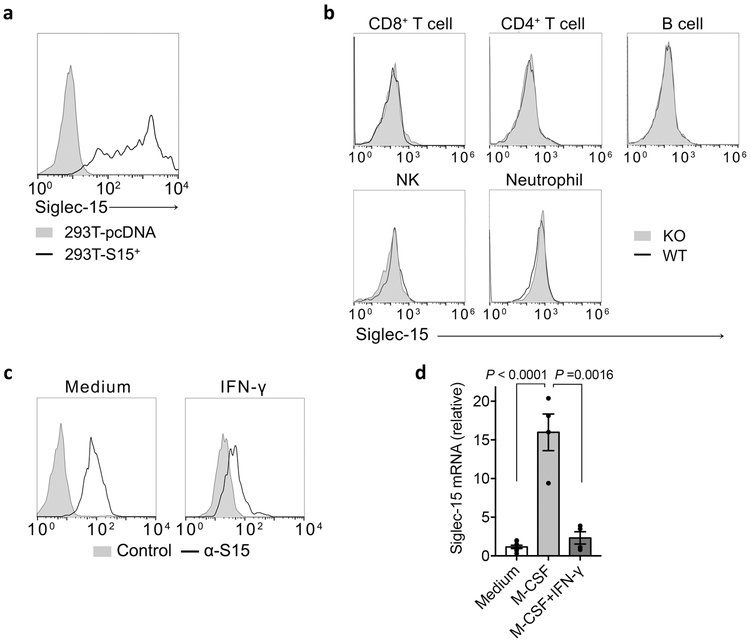
To facilitate Siglec-15 expression analysis, we generated a monoclonal antibody specific for mouse Siglec-15 (clone m03); its specificity was verified via positive staining on 293T-cells overexpressing mouse Siglec-15 compared to mock transfected cells (Extended Data Fig. 3a). We also generated a Siglec-15 whole body knockout mouse strain (S15KO) by crossing Siglec-15-loxP mice with CMV-Cre mice. Flow cytometry analysis of antibody-stained hematopoietic cells from wild type (WT) or KO mice showed that Siglec-15 was expressed at low levels on CD11b+F4/80+ peritoneal macrophages, CD11b+Gr-1+ myeloid cells from freshly isolated bone marrow, and CD11b+F4/80+ BMDMs, but was not detectable on other myeloid or lymphoid cell subsets (Fig. 2c and Extended Data Fig. 3b).
As IFN-γ has proven to be the dominant cytokine required for B7-H1 induction7, we tested its effect on Siglec-15 expression. IFN-γ inhibited Sigelc15 expression on RAW264.7, a mouse myeloid cell line, which constitutively expresses Siglec-15 (Extended Data Fig. 3c). Furthermore, IFN-γ also inhibited M-CSF-induced Siglec-15 expression on human monocyte-derived macrophages (Fig. 2d and Extended Data Fig. 3d). Therefore, the regulation of Siglec-15 expression appears distinct from B7-H1.
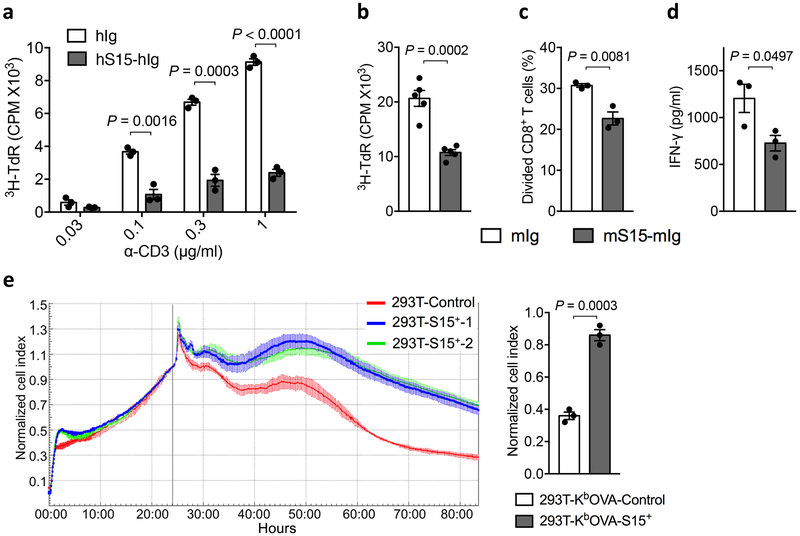
We generated a recombinant Siglec-15 fusion protein consisting of the ECD of human Siglec-15 and human IgG1 Fc (hS15-hIg). Both soluble and immobilized hS15-hIg, but not control hIg, suppressed human CD4+ and CD8+ T-cell activity as evidenced by decreased proliferation; hS15-hIg also inhibited IFN-γ release in response to anti-CD3 stimulation (Fig. 2e-g and Extended Data Fig. 4a). Similarly, murine Siglec-15 fusion protein (mS15-mIg) also suppressed proliferation and IFN-γ secretion of mouse splenic T-cells (Extended Data Fig. 4b-d). We also tested the effect of Siglec-15 in an antigen-specific system in which the murine Siglec-15 gene was expressed in a 293T- KbOVA cell line to establish a 293T-KbOVA-S15+ line. This 293T cell line also stably expressed a fusion gene encoding H-2Kb and OVA257-264 peptide, which allows antigen-specific stimulation of CD8+ OT-I TCR transgenic T-cells (OT-I). As expected, irradiated 293T-KbOVA-S15+ cells induced significantly less proliferation of OT-I compared to the 293T-KbOVA control, as assayed by 3H-thymidine incorporation (Fig. 2h) and decreased IFN-γ or TNF-α (Fig. 2i). The 293T-KbOVA-S15 cells were also more resistant to cytotoxicity mediated by pre-activated OT-I in an xCELLigence RTCA impedance assay28 (Extended Data Fig. 4e), suggesting over-expression of Siglec-15 may also contribute to cell survival. Finally, freshly isolated peritoneal macrophages from WT and S15KO mice were co-cultured with purified OT-I in the presence of OVA257-264 peptide. Macrophages from the S15KO mice induced higher levels of OT-I proliferation than WT macrophages (Fig. 2j). Together, our results support a role for Siglec-15 on macrophages to directly suppress T-cell activity.
Macrophage/myeloid cell-associated Siglec-15 inhibits antigen-specific T-cell responses in vivo
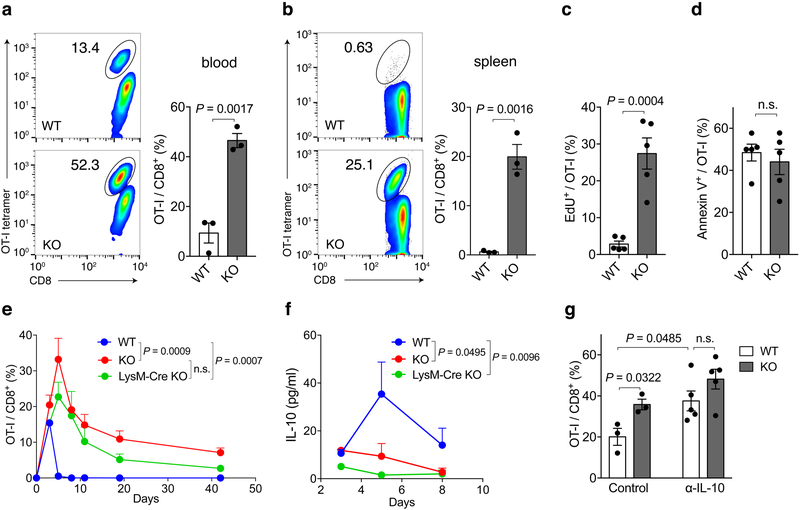
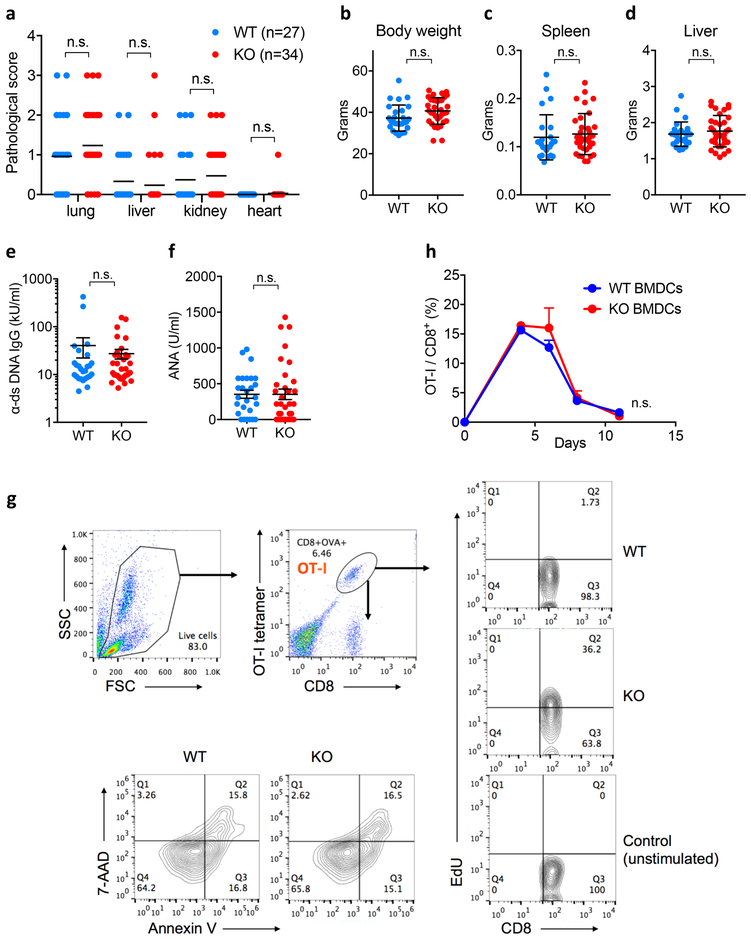
At 18-months, S15KO mice do not display obvious disease phenotypes as evaluated by pathological score (Extended Data Fig. 5a); their body weight, lymphoid organ weight and serum anti-nuclear antibodies were all within normal range (Extended Data Fig. 5b-f). These observations suggest that Siglec-15 is not essential for mouse development or immune system homeostasis. To evaluate the immune suppressive function of Siglec-15 in an antigen-specific T-cell response in vivo, OT-I from spleens of OT-I TCR transgenic mice on a Rag-1 KO background were transferred into WT or S15KO mice, and the mice were subsequently immunized the following day with OVA257-264 peptide plus poly(I:C) as an adjuvant. OT-I from the blood (day 4) and spleen (day 5) were detected by anti-CD8 mAb/H-2KbOVA257-264 tetramer staining. Significantly more OT-I was observed in the blood and spleen obtained from S15KO mice than from WT mice (Fig. 3a and b). Consistent with these findings, higher levels of OT-I proliferation, indicated using incorporation of 5-ethynyl-2’-deoxyuridine (EdU) was observed in S15KO mice on day 5 after immunization (Fig. 3c and Extended Data Fig. 5g). There was no significant difference in Annexin V staining on OT-I from S15KO and WT mice (Fig. 3d and Extended Data Fig. 5g), indicating a lack of Siglec-15 did not affect apoptosis in activated T-cells. Therefore, Siglec-15 appears to suppress antigen-specific T-cell responses mainly by regulating cell growth, not apoptosis.
Figure 3. Inhibitory effect of Siglec-15 on antigen-specific T-cell responses in vivo.
Splenic cells from OT-I/Rag-1 KO mice were injected i.v. into WT, Siglec-15 KO or LysM-Cre KO mice on day −1. On day 0, mice were immunized i.p. with 100 μg OVA257-264 peptide plus 100μg poly(I:C). OT-I T-cells in blood on day 4 (a) and in spleen on day 5 (b) were analyzed by flow cytometry with H-2KbOVA257-264 tetramer (OT-I tetramer) and CD8 mAb staining. Representative flow cytometry analysis and quantification of OT-I T-cells among total CD8+ T-cells are shown. Data are mean ± s.e.m. (n = 3 mice per group) and representative of three independent experiments. P values by two-tailed unpaired t-test. In some experiments, WT and KO were fed with EdU at 0.8mg/ml in drinking water from day 0 of immunization. On day 5, the % of EdU+ OT-I T-cells (c) and Annexin V+ OT-I T-cells in the spleen (d) were analyzed by flow cytometry. Data are mean ± s.e.m. (n = 5 mice per group) and representative of two independent experiments. P values by two-tailed unpaired t-test (n.s., not significant; P = 0.5566). (e, f) The kinetics of OT-I T-cells in the blood (e) and IL-10 levels in the plasma (f) of WT, Siglec-15 KO and LysM-Cre KO mice after OVA257-264/poly(I:C) immunization are shown. Data are mean ± s.e.m. (WT n = 4 mice; KO or LysM-Cre KO n=3 mice) and representative of three independent experiments. P values by two-way ANOVA (n.s.; P = 0.1475). (g) WT and KO mice were treated with 200 μg anti-IL-10 mAb or isotype control mAb daily after OT-I T-cell transfer. The % of OT-I T-cells among total CD8 T-cells in blood at day 5 is shown. Data are mean ± s.e.m. (control, n = 3 mice per group; α-IL-10, n = 5 mice per group). P values by two-tailed unpaired t-test (n.s., not significant, P = 0.1581).
See also Extended Data Fig. 5.
Next, we determined the role of macrophage-associated Siglec-15 in the induction of T-cell responses in vivo. Siglec-15-loxP mice were backcrossed to the LysM-Cre strain29 to produce a deletion of Siglec-15 on macrophages/granulocytes (LysM-Cre S15KO). Because Siglec-15 is mainly found on macrophages, not on monocytes or granulocytes, this strain provides a unique tool to study the macrophage-related functions of Siglec-15. Upon OVA257-264 immunization, OT-I proliferation in vivo was evaluated in blood, as described above. Kinetic analysis of T-cell expansion in vivo indicated that OT-I had significantly higher proliferation rates, as indicated by the peak response and the delayed contraction in S15KO compared with those in WT mice (Fig. 3e). The kinetics of OT-I proliferation in LysM-Cre S15KO mice were slightly lower in both proliferation and contraction but insignificant compared with whole-body S15KO mice (Fig. 3e). Enhanced OT-I responses to OVA257-264 in S15KO and LysM-Cre S15KO mice were also associated with decreased IL-10 in sera (Fig. 3f). Furthermore, anti-murine IL-10 mAb amplified OT-I responses and completely abrogated the effect of Siglec-15 deficiency (Fig. 3g), suggesting that the role of Siglec-15 is dependent on IL-10. After the immunization of OT-I-transferred mice with OVA257-264 peptide-pulsed BMDC from WT or S15KO mice, we did not observe a significant difference in OT-I responses between these two groups of mice (Extended Data Fig. 5h), indicating that BMDC-associated Siglec-15 may have a non-essential role in the suppression of T-cell functions in this system. However, we cannot exclude a possible role for Siglec-15 on DCs or other immune subsets. Together, our results suggest that Siglec-15 on macrophages/myeloid cells could suppress T-cell responses in vivo.
Siglec-15 is abundant in human cancer cells and tumor-associated myeloid cells/macrophages
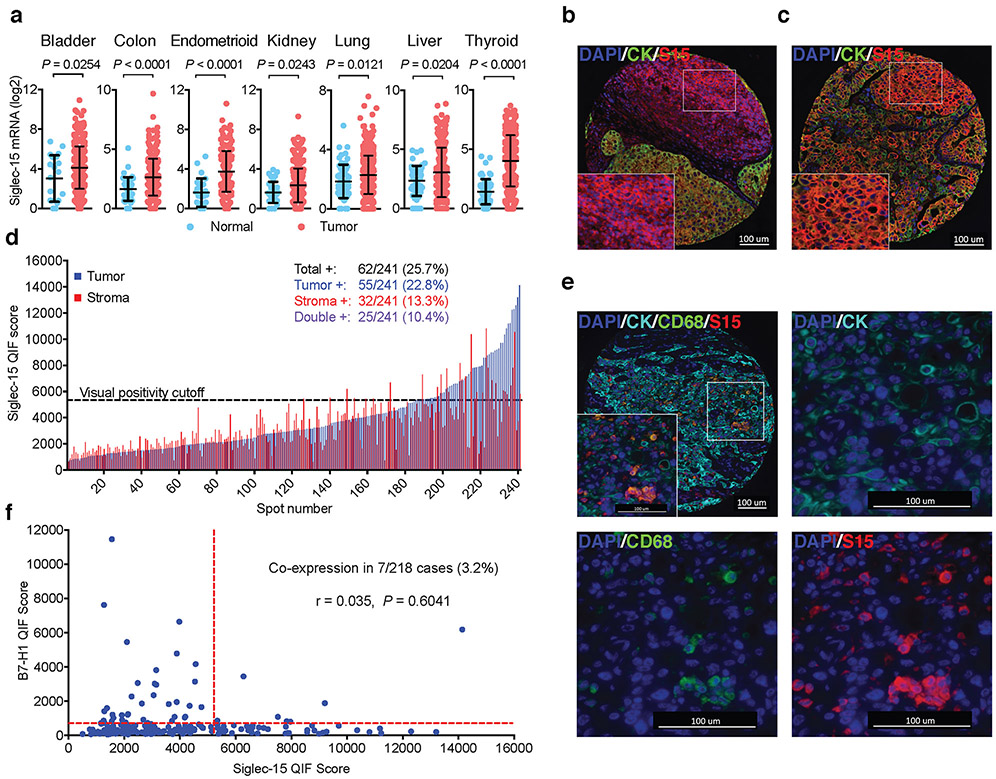
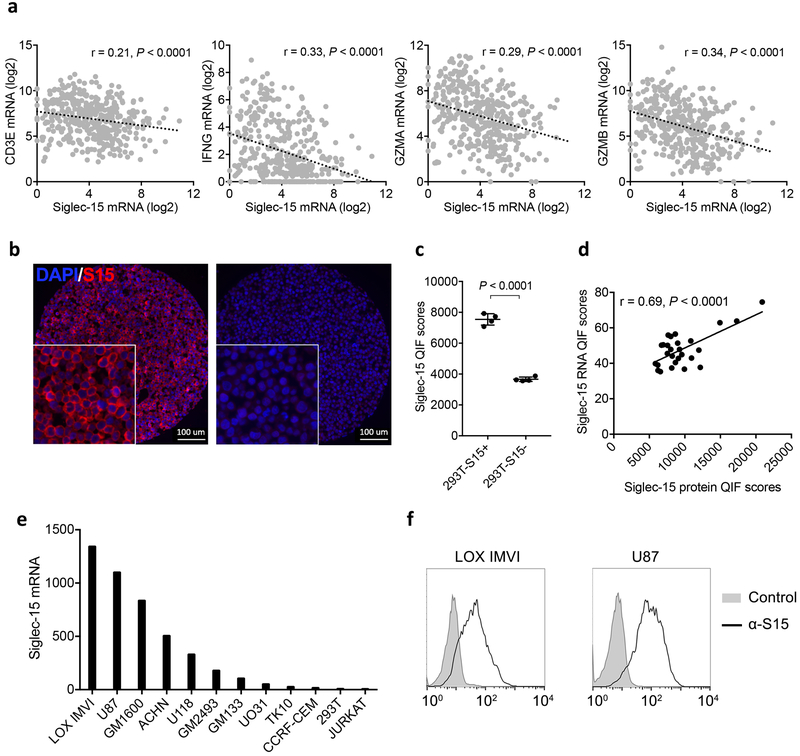
Meta-analysis of TCGA databases indicates that Siglec-15 mRNA is upregulated in a broad spectrum of human cancers. It is mostly upregulated in colon cancer, endometrioid cancer and thyroid cancer; it is also significantly upregulated in bladder, kidney, lung and liver cancers by comparison with respective normal tissues (Fig. 4a). Siglec-15 mRNA expression also correlates inversely with several immune signature genes, such as CD3E, IFNG and GZMA or GZMB in human bladder cancer (Extended Data Fig. 6a).
Figure 4. Siglec-15 is abundant in human cancers.
(a) The mRNA expression levels of Siglec-15 in human cancers versus corresponding normal tissues by meta-analysis of the TCGA database. Data are mean ± s.d. (bladder, n = 407 vs 20; colon, n = 288 vs 41; endometrioid, n = 175 vs 24; kidney, n = 291 vs 32; lung, n = 510 vs 58; liver, n = 373 vs 50; thyroid, n= 513 vs 59 samples of human tumor vs normal tissues). P values by two-tailed unpaired t-test.
(b-f) Siglec-15 expression on an NSCLC patient cohort by Quantitative Immunofluorescence (QIF). Representative images of formalin-fixed paraffin-embedded tissue sections with positive Siglec-15 staining on stroma (b) and tumor (c) cells using anti-Siglec-15(S15) antibody PA5-48221 (4’,6-diamidino-2-phenylindole (DAPI) [blue], cytokeratin (CK) [green], and S15 [red]). Data are representative of three independent experiments. QIF score distribution of Siglec-15 expression in tumor and stroma compartments in the NSCLC cohort (d). Numbers and percentage of patient cases with visually positive Siglec-15 on total, tumor, stromal, or both cell types are shown. Representative images of an NSCLC tumor case with Siglec-15 and CD68 co-expression (DAPI [blue], CK [cyan], CD68 [green], and S15 [red]) (e). Top left: overlay of all multiplexed markers (10X magnification); top right: CK and DAPI (40X); bottom left: CD68 and DAPI (40X); bottom right: S15 and DAPI (40X). Data are representative of three independent experiments. The correlation between B7-H1 and Siglec-15 expression was assessed on serial tumor sections of the same cohort (f). Pearson r score and P value are shown.
See also Extended Data Fig. 6.
Immunohistochemistry analysis was performed in a tissue array from 241 non-small cell lung cancer (NSCLC) samples using human Siglec-15 antibody via Quantitative Immunofluorescence (QIF) (Supplementary Table 2). This antibody specifically stains Siglec-15 positive 293T cells, but not control cells (Extended Data Fig. 6b and c). Siglec-15 QIF staining was further validated using a Siglec-15 RNA score determined by in situ mRNA hybridization on human tumor tissue arrays and a Siglec-15 specific probe (Extended Data Fig. 6d). Analysis of Siglec-15 QIF staining indicated that Siglec-15 could be detected either on tumor-associated stromal cells or tumor cells (Fig. 4b and c). Quantification of Siglec-15 signal revealed that 25.7% of the samples are positive over a visually defined signal to noise threshold cut-off, including 22.8% on tumor cells, 13.3% on tumor stromal cells, and 10.4% on both cell types (Fig. 4d). We also confirmed Siglec-15 expression on tumor-associated myeloid cells using CD68 multiplexed staining (Fig. 4e). Interestingly, there was no correlation between B7-H1 and Siglec-15 expression (r=0.035, P=0.60), with only 7/218 (3.2%) of patient cases being positive for both markers (Fig. 4f). Consistent with the tumor cell-associated expression of Siglec-15, high levels of Siglec-15 mRNA were found in multiple human tumor lines from the NCI-60 panel (Extended Data Fig. 6e). Furthermore, the expression of cell surface Siglec-15 protein on LOX IMVI melanoma and U87 glioblastoma lines was also validated by flow cytometry analysis with the specific mAb (Extended Data Fig. 6f).
Siglec-15 deficient mice are resistant to tumor growth in mouse models by promoting T-cell responses
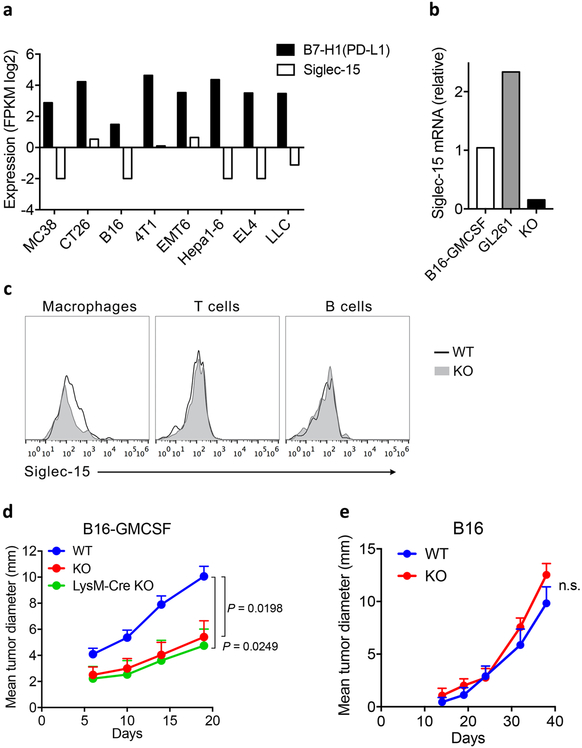
In contrast to human cancer, we did not find Siglec-15 expression in an array of tumors established by several commonly used mouse tumor lines including B16, CT26, and MC38 (Extended Data Fig. 7a). Inoculation of B16 cells into syngeneic C57BL/6 mice developed rapidly growing tumors without significant TAMs and other immune cells30. To better model human cancers that have abundant Siglec-15 positive TAMs, we used a B16-GMCSF cell line that over-expresses granulocyte-macrophage colony-stimulating factor (GM-CSF) using retroviral transduction, which led to abundant infiltrations of TAMs in tumor tissues31,32. Using RT-PCR analysis, we found low levels of Siglec-15 expression in B16-GMCSF as well as our previously characterized GL261 tumors33 (Extended Data Fig. 7b). Therefore, these two cell lines were chosen as the relevant models to mimic human tumors with Siglec-15 expression for further studies.
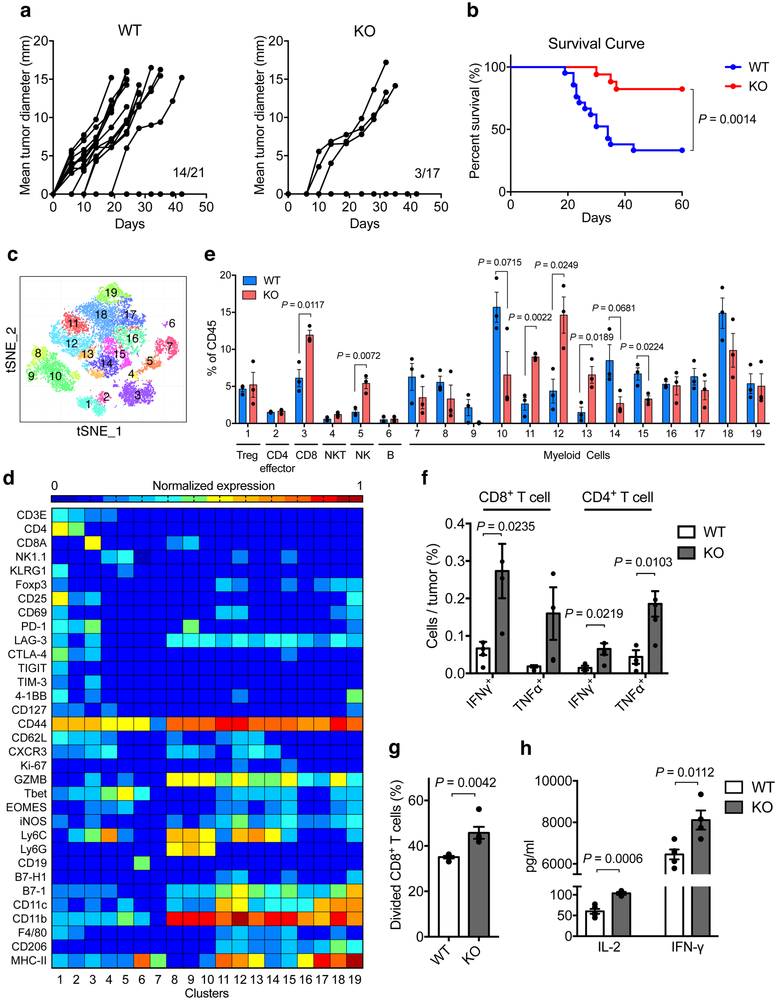
Flow cytometry analysis of tumor infiltrating cells using specific mAb confirmed positive Siglec-15 staining on TAMs, but not on T or B cells in B16-GMCSF tumors (Extended Data Fig. 7c). Interestingly, inoculation of B16-GMCSF tumor cells into S15KO mice exhibited retarded tumor growth and prolonged survival compared to WT mice (Fig. 5a and b), similar to LysM-Cre S15KO mice (Extended Data Fig. 7d). By comparison, there was no difference in B16 tumor growth between S15KO and WT mice (Extended Data Fig. 7e), supporting that Siglec-15 does not play a role in the growth of WT B16 tumors.
Figure 5. Effect of Siglec-15 on tumor growth in syngeneic mice.
(a, b) B16-GMCSF tumor cells at 1.5×10⁶ were injected s.c. into Siglec-15 WT and KO mice. Tumor incidence and growth in individual mouse (a) and percentage of survival (b) are shown. (WT, n = 21 mice; KO, n =17 mice; results were pooled from two independent experiments). P values by two-sided Log-rank test.
(c-e) Mass cytometry analysis of tumor-infiltrating leukocytes at day 14 after B16-GMCSF tumor inoculation. t-SNE plot of tumor infiltrating leukocytes overlaid with color-coded clusters (c). Heatmap displaying normalized marker expression of each immune cluster (d). Frequency of clusters of indicated immune cell subsets (e). Data are mean ± s.e.m. (n = 3 mice per group). P values by two-tailed unpaired t-test.
(f-h) The ex vivo function analysis of B16-GMCSF tumor-infiltrating T-cells or myeloid cells. T-cells (f) or myeloid cells (g, h) were isolated from B16-GMCSF tumors from WT and KO mice at day 14. The % of IFN-γ and TNF-α producing T-cells were analyzed by intracellular staining after 4 hrs re-stimulation with PMA and ionomycin (f). CD11b+ myeloid cells were co-cultured with CSFE-labeled naïve splenic CD8+ T-cells stimulated with anti-CD3. T-cell proliferation (g) and cytokine production (h) was analyzed at 48 hrs. Data are mean ± s.e.m. (n = 4 mice per group) and representative of two independent experiments. P values by two-tailed unpaired t-test.
See also Extended Data Figs. 7-9.
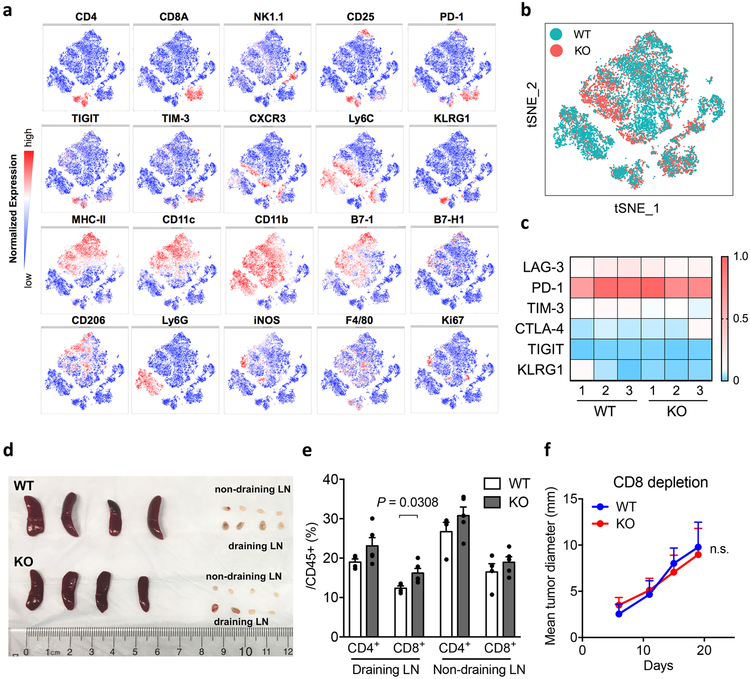
To evaluate overall immunological changes within tumors, we profiled B16-GMCSF tumor-infiltrating leukocytes from S15KO and WT mice using mass cytometry (CyTOF), a single cell high dimensional analysis tool with over 30 mAbs to determine immune cell lineages as well as functional molecules via an unsupervised phenograph clustering method34. Analysis of the total CD45+ hematopoietic cells revealed 19 distinct cell subsets (clusters) (Fig. 5c). Among those distinct clusters, we found significant expansion of CD8+ T-cells (cluster 3) as well as NK cells (cluster 5), but not Treg (cluster 1), CD4+ effector T-cells (cluster 2), NKT cells (cluster 4) or B cell populations (cluster 6) in S15KO tumors (Fig. 5d and e, and Extended Data Fig. 8a and b). Interestingly, several inflammatory myeloid cell populations (cluster 11–13, CD11b+ MHC-IIhi B7-1+ B7-H1med F4/80low) were also considerably higher in S15KO tumors, by comparison with a significant decrease in CD11b+ MHC-IIlow B7-1med B7-Hlow F4/80med tumor-associated macrophages (cluster 15) and a trend of decreased CD11b+ Ly6G+ myeloid-derived suppressor cells (cluster 9 and 10) (Fig. 5d and e). Although there was little difference in the expression of immune suppressive molecules on CD8+ T-cells (Extended Data Fig. 8c) or CD4+ T-cells (data not shown), we found a significant increase in IFN-γ+CD8+ as well as IFN-γ+ and TNF-α+CD4+ T-cells in S15KO compared to WT mice upon ex vivo re-stimulation (Fig. 5f). There was no difference in the size of the spleen, tumor draining or non-tumor draining lymph nodes, but there was a small increase in the CD8+ T-cells from the tumor draining lymph nodes in S15KO mice (Extended Data Fig. 8d and e).
Importantly, depletion of CD8+ T-cells using specific mAb completely eliminated the difference in B16-GMCSF tumor growth between S15 KO and WT mice (Extended Data Fig. 8f), indicating a critical role of Siglec-15 in the regulation of CD8+ T-cells in this model. As Siglec-15 is mainly expressed by TAMs (Extended Data Fig. 7c), we tested the functional contribution of macrophage/myeloid-associated Siglec-15 on CD8+ T-cell responses. We found that tumor-infiltrating CD11b+ cells from S15KO mice significantly promoted T-cell proliferation as well as cytokine secretion compared to those from WT mice (Fig. 5g and h).
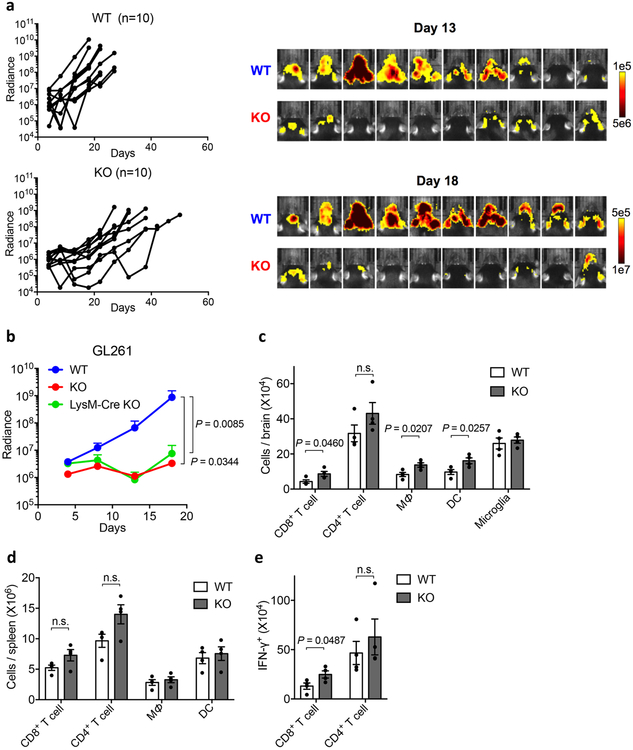
In the second model, intracranial injection of GL261 cells developed rapidly progressing brain tumors with significant infiltration of macrophages/microglia35. A subline of GL261 cells expressing firefly luciferase (GL261-luc) was applied to monitor tumor growth by real time imaging detection. Similar to B16-GMCSF, while inoculation of GL261-luc cells into syngeneic C57BL/6 mice induced rapid growth of tumors, S15KO mice developed significantly slower tumor growth as indicated by the detection of bioluminescence radiance (Extended Data Fig.9a). Similarly, there was no difference in tumor growth between S15KO and LysM-Cre S15KO (Extended Data Fig. 9b). Our results support that Siglec-15 on host-derived macrophages promotes the growth of GL261 tumors. Fourteen days after tumor inoculation, significantly more CD8+ T-cells, macrophages and DCs, but not CD4+ T-cells were detected in the brain of S15KO mice compared to WT mice whereas no change was detected in the spleen (Extended Data Fig. 9c and d). Upon ex vivo re-stimulation with irradiated GL261 cells, significantly increased IFN-γ+CD8+ T-cells, but not IFN-γ+CD4+ T-cells, were found in S15KO mice compared to WT mice (Extended Data Fig. 9e), indicating that Siglec-15 predominantly suppresses tumor-specific CD8+ T-cell responses in this model. Taken together, our data support a role for Siglec-15 in macrophage-mediated suppression of tumor immunity.
Siglec-15 mAb inhibited the growth of established tumors in murine models
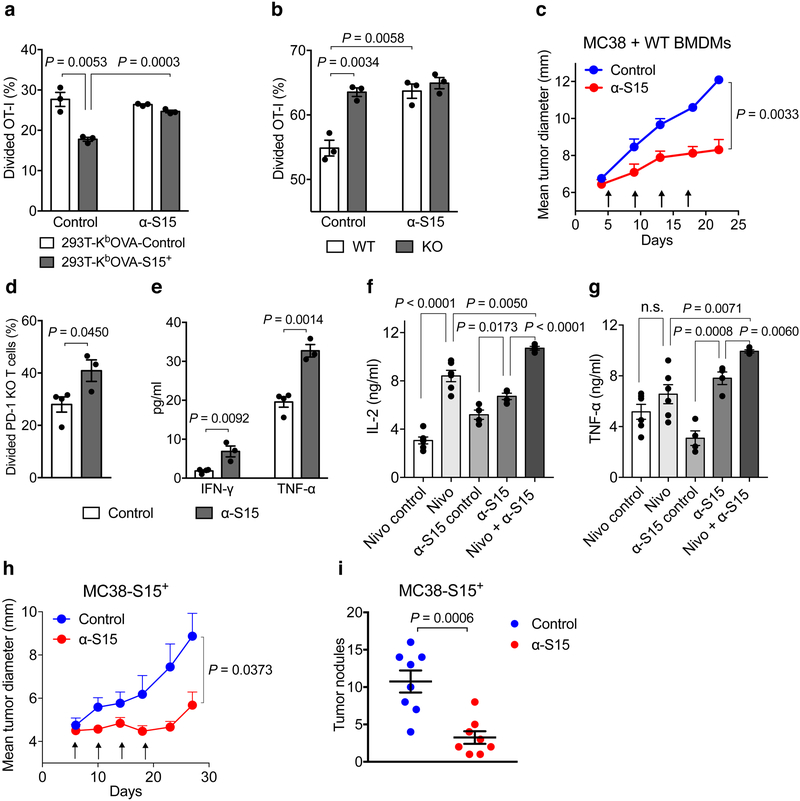
A Siglec-15 specific mAb (α-S15, clone 5G12) was generated using hybridoma technology with specific binding to both human and mouse Siglec-15 (Extended Data Fig. 10a). α-S15 blocked Siglec-15-mediated suppression of murine OT-I responses to 293T-KbOVA-S15+ or OVA257-264-pulsed mouse primary macrophages, as described above (Fig. 6a and b), as well as of human T-cell proliferative responses to anti-CD3 stimulation (Extended Data Fig. 10b and c). These results support that α-S15 is a blocking mAb that acts to block Siglec-15 from interacting with a putative suppressive receptor on T-cells.
Figure 6. Effect of Siglec-15 mAb on established tumors in syngeneic mice.
(a) The % of divided OT-I T-cells (1×10⁵/well) was analyzed by CFSE dilution after co-culture with irradiated 293T-KbOVA-S15+ or control cells (2×10⁴/well) in a 96-well plate for 5 days with 10 μg/ml Siglec-15 antibody (α-S15) or isotype control mAb (Control).
(b) The % of divided OT-I T-cells (2×10⁵/well) was analyzed by CFSE dilution after co-culture for 3 days with S15KO or WT BMDMs (2×10⁴/well) pulsed with 0.1ng/ml OVA257-264 in the presence of 10 μg/ml α-S15 or isotype control antibody. In a and b, data are mean ± s.e.m. (n = 3 cell cultures). P values by two-tailed unpaired t-test.
(c) MC38 tumor cells (3×10⁵) mixed with WT BMDMs (2×10⁵) were s.c. injected into WT C57BL/6 mice. Mice were treated with 200μg α-S15 or control antibody from day 5, every 4 days for 4 doses in total. Data are mean ± s.e.m. (n = 5 mice per group). P values by two-way ANOVA.
(d, e) Naïve splenic CD8+ T-cells isolated from PD-1 KO mice were labeled with CFSE and co-cultured with WT BMDMs in the presence of anti-CD3 and α-S15 or control antibody. T-cell proliferation (d) and cytokine production (e) was analyzed at 72 hrs. Data are mean ± s.e.m. (n = 3 or 4 cell cultures). P values by two-tailed unpaired t-test.
(f, g) IL-2 (f) and TNF-α (g) production from human PBMCs after stimulation with anti-CD3 and SEB in the presence of α-S15, α-PD-1 (Nivolumab) or their control antibodies for 72hrs. Data are mean ± s.e.m. (n = 5 cell cultures). P values by two-tailed unpaired t-test (n.s., not significant; P = 0.1759).
(h) MC38-S15+ cells were s.c. injected into WT C57BL/6 mice (4×10⁵/mouse). Mice were treated with 200μg α-S15 or control antibody from day 6, every 4 days for 4 doses in total. Data are mean ± s.e.m. (n = 5 mice per group). P values by two-way ANOVA.
(i) MC38-S15+ cells were i.v. injected into WT C57BL/6 mice (1×10⁵/mouse). Mice were treated with 400 μg α-S15 or control antibody from day 2, every 4 days for 6 doses in total. Lungs were harvested on day 28 and tumor nodules were counted. Data are mean ± s.e.m. (n = 8 mice per group). P values by two-tailed unpaired t-test.
All data are representative of two or three independent experiments. See also Extended Data Fig. 10.
We first tested the effect of α-S15 on an established B16-GMCSF mouse model. Five days after tumor cell inoculation, tumors were well established in syngeneic mice, as indicated by increased volumes, having the majority of tumor cells in the mitotic phase, and active angiogenesis around tumors. Treatment by α-S15 induced a significant, while modest effect, on the growth of B16-GMCSF tumors (Extended Data Fig. 10d).
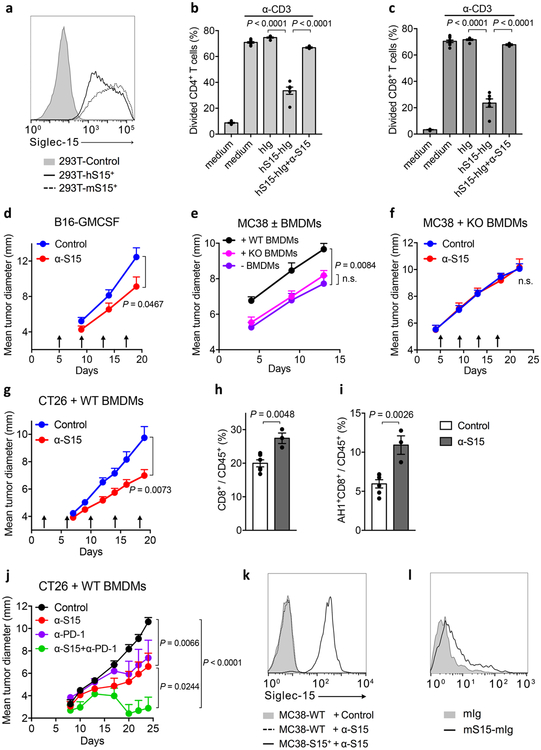
MC38 is a carcinogen-induced murine colon cancer line and the growth of MC38 tumors in syngeneic mice is accompanied by significant infiltration of CD4+ and CD8+ T-cells30 but limited Siglec-15 expression (Extended Data Fig. 7a). Treatment of established MC38 tumors by α-S15 did not have a significant effect on tumor growth (data not shown). To model human cancers with Siglec-15 positive TAMs, we tested the effect of BMDMs, which constitutively expresses Siglec-15 (Fig. 2b and c), on the growth of MC38 tumor cells. In this setting, MC38 tumor cells were mixed with BMDMs prior to inoculation. BMDMs from WT mice significantly promoted MC38 tumor growth whereas BMDMs from S15KO mice did not (Extended Data Fig. 10e), indicating a role for Siglec-15 on BMDMs in the suppression of T-cell mediated tumor immunity. The α-S15 treatment of 5-day established MC38 tumors induced significantly retarded tumor growth when tumors were mixed with BMDMs from WT (Fig. 6c) but not from S15KO mice (Extended Data Fig. 10f), indicating an effect of α-S15 on macrophage-associated Siglec-15. Treatment with α-S15 also similarly inhibited the growth of CT26 colon cancer when mixed with BMDMs (Extended Data Fig. 10g). α-S15 treatment significantly increased CD8+ T-cells in tumors (Extended Data Fig. 10h). Moreover, CD8+ T-cells specific for AH1, a CT26 tumor antigen epitope36, also significantly increased as indicated by MHC-I dextramer staining, during α-S15 treatment (Extended Data Fig. 10i). Our findings further support that the effect of α-S15 in these models is dependent on Siglec-15 on macrophages.
Due to its distinct regulation mechanism and expression pattern in human cancers, Siglec-15 may be non-redundant to the B7-H1/PD-1 pathway in immune regulation. We found α-S15 promoted the response of PD-1 KO T-cells when co-cultured with WT BMDMs (Fig. 6d and e). In line with this finding, α-S15 was effective in promoting cytokine production from human peripheral blood T-cells, either in the presence or absence of PD-1 blocking antibody (Nivolumab) (Fig. 6f and g). Moreover, while α-S15 and anti-PD-1 mAb37 modestly inhibited tumor growth as a single agent, the treatment with both mAbs achieved much better efficacy, leading to complete tumor regression in some mice (Extended Data Fig. 10j). This observation further supports that Siglec-15 works independently from the B7-H1/PD-1 pathway to suppress immune responses; further, blockade of Siglec-15 may be applied together with anti-PD therapy for cancer treatment.
In addition to macrophages, Siglec-15 was also found on human cancer cells (Fig. 4). To establish a model to study the effect of tumor-derived Siglec-15 in anti-tumor immunity, a MC38 subline over-expressing murine Siglec-15 (MC38-S15+) was generated by lentiviral transduction (Extended Data Fig. 10k). Treatment with α-S15 significantly suppressed subcutaneous MC38-S15+ tumor growth (Fig. 6h), and reduced metastatic tumor nodules in the lung when tumor cells were injected intravenously (Fig. 6i). Collectively, our results indicate that either macrophage- or tumor-derived Siglec-15 can impair anti-tumor immunity, which represents a novel immune evasion mechanism in the TME, and that blockade of Siglec-15’s suppressive function by specific mAb could be therapeutic for established tumors.
Discussion
Cancer immunotherapy has undergone a paradigm shift from systemic activation of immune responses by immune enhancement to selective correction of defective immunity in the TME by immune normalization14. This strategy of normalization cancer immunotherapy will require a target to be 1) induced due to tumor growth and/or the subsequent immune surveillance; 2) preferentially expressed in the TME with minimal expression in normal tissues and 3) able to elicit immune evasion and manipulation of which can reset or reprogram anti-tumor immunity in the TME14. With these features, cancer immunotherapy could achieve considerable therapeutic efficacy without excessive autoimmune toxicities. We have used these stringent criteria to identify new immune modulatory molecules, especially in B7-H1 negative human cancers. Siglec-15 was identified as a lead molecule in our TCAA platform and its T-cell suppressive function was validated in various in vivo and in vitro systems in our studies. In addition, Siglec-15 is found upregulated on human cancer cells and/or tumor-infiltrating macrophages/myeloid cells in contrast to its minimal expression level on macrophages in normal tissues. Finally, gene-ablation or antibody blockade of Siglec-15 can convert an immune suppressive TME to an inflammatory site in some tumor models. Collectively, our results support that Siglec-15 is a potential candidate for normalization cancer immunotherapy. Currently, a first-in-human phase I clinical trials is ongoing to test the effect of a humanized mAb (NC318) to Siglec-15 in solid tumors ( NCT03665285).
Siglec-15, originally categorized into the Siglec family, is distinct from other family members upon phylogenetic analysis21. It shows similar domain composition and high homology with B7-H1, along with many other B7 family members. Importantly, the expression of Siglec-15 and B7-H1 are mutually exclusive in human lung cancer tissues (Fig. 4f), suggesting a distinct regulatory mechanism. Siglec-15 appears to regulate differentiation and functions of other myeloid lineage cells in addition to macrophages. Siglec-15 deficient mice have increased mass in certain bones, leading to mild osteopetrosis23, which may be due to partial impairment of the differentiation of osteoclasts, a tissue specific myeloid lineage cell in bone38,39. In our study, Siglec-15 deficient mice did not develop obvious physical abnormalities as previously reported23 and had normal hematopoietic/immune systems up to 18 months of age (Wang et al, unpublished observation). These observations are consistent with constitutively low levels of Siglec-15 expression on a subset of macrophages but not on other cells under physiological conditions (Fig. 2c and Extended Data Fig. 2 and 3b). Inversely, cell surface expression of B7-H1 is not usually detectable but can be induced on the majority of nucleated cells7-10. Siglec-15 also has a distinct expression pattern upon induction and M-CSF may be a major factor in inducing Siglec-15 expression on macrophages. M-CSF-induced M2-like macrophages were found to express Siglec-15 and, upon interaction with Sialyl-Tn carbohydrate ligand on tumor cells, produced transforming growth factor-β40. Siglec-15 induction on macrophages by M-CSF, however, can be down-regulated by IFN-γ (Fig. 2d and Extended Data Fig. 3c, d) which is a major positive regulator for B7-H1. This finding is consistent with the clinical observations that the expression of Siglec-15 is mutually exclusive from B7-H1 expression in human NSCLC specimens (Fig. 4f). Finally, the work presented here reveals a previously unrecognized function for Siglec-15 on macrophages/myeloid cells to negatively regulate immunity, as shown by in vitro studies involving recombinant Siglec-15 protein or cell surface Siglec-15. Siglec-15’s T-cell suppressive function was further validated in vivo with either Siglec-15 deficient mice or anti-Siglec-15 mAb. Conditional ablation of Siglec-15 supports a major contribution of macrophage-associated Siglec-15 in the suppression of naïve T-cell proliferative responses to antigen and a potential role in T-cell contraction (Fig. 3). Interestingly, Siglec-15’s immune suppressive function is independent from the B7-H1/PD-1 axis (Fig. 6d-g), further suggesting the different mechanisms of action for these pathways in immune regulation.
Selective upregulation of Siglec-15 in human TME is a major finding in this report. Our quantitative immunofluorescence analysis detected Siglec-15 on both human cancer cells and tumor-infiltrating myeloid cells/macrophages. In human NSCLC patients with positive Siglec-15 staining, nearly 90% of them are positive on tumor cells while more than 50% of them are positive on myeloid cells/macrophages (Fig. 4). In mouse tumor models tested so far, however, expression of Siglec-15 on tumor cells or tumor-associated myeloid cells/macrophages is rare. Furthermore, mouse tumor models with more infiltrating myeloid cells/macrophages do not always associate with higher levels of Siglec-15 expression (Extended Data Fig. 7a and b). This observation warns cautious interpretation of the data in mouse tumor models for their biological significance in human cancers. For example, the models by pre-mixing Siglec-15 positive macrophages with mouse tumor cells, although modeling Siglec-15 upregulation on myeloid cells/macrophages, may represent a rather artificial TME.
Our findings also reveal potentially important roles of Siglec-15 in the control of inflammatory responses at both the initiation and effector phases of chronic inflammation and tumor growth. Because M-CSF is broadly inducible from various stromal and hematopoietic cells by early inflammatory mediators such as TNF-α and IL-141, upregulation of Siglec-15 on macrophages by M-CSF and possibly other innate inflammatory mediators may represent an initial negative regulation of macrophages/myeloid cells on the initiation of innate and adaptive immunity. Siglec-15 appears to engage a putative receptor on T-cells to transmit a suppressive signal for T-cell response, as indicated by the direct binding of Siglec-15 Fc to T-cells (Extended Data Fig. 10l). Siglec-15 does not bind to currently known immune suppressive receptors and does not interact with B7-H1, PD-1, B7–1, or any other known B7 family ligands or receptors, as determined using our genome-scale receptor array analysis (Wang et al., unpublished observation). Notably, Siglec-15 does bind Sialyl-Tn antigen, which is over-expressed in many human cancer cells40. In addition, several binding partners for Siglec-15 other than Sialyl-Tn antigen have also been identified42,43 while their functions in Siglec-15 mediated immune suppression are unknown.
Our study also supports Siglec-15 as an attractive cell surface target for cancer immunotherapy. First, Siglec-15 has limited expression in normal tissues and there is minimal fluctuation in the normal physiology of Siglec-15 deficient mice (Extended Data Fig.2 and Extended Data Fig. 5a-f), indicating that Siglec-15 is not an essential molecule for the survival and development of normal organs and tissues, which may offer a safer profile for Siglec-15 blockade therapy. Second, Siglec-15 upregulation on TAMs and on tumor cells, but not in normal tissues (Fig. 4) indicates that the role for Siglec-15 may be relatively limited in the TME. This may allow tumor-selective, targeted antibody therapy. Third, tumor model studies using Siglec-15 deficient mice demonstrate that Siglec-15 has a potent immune suppressive effect on T-cell responses at the tumor-site and this effect could be mediated via TAM-associated Siglec-15 (Fig. 5 and Extended Data Fig. 9). Finally, Siglec-15 specific mAb reversed T-cell suppression, promoted tumor immunity and inhibited the growth of established tumors in multiple tumor models (Fig. 6 and Extended Data Fig. 10d, g-j). Taken together, the studies presented here identify and characterize the Siglec-15 molecule as a potent immune suppressive molecule. With these unique features of Siglec-15, the anti-Siglec-15 mAb may add to the therapeutic tools for cancer patients resistant to current anti-PD therapy.
Methods
Mice and cell lines
C57BL/6 or BALB/c mice at 6~8 weeks old were purchased from Charles River (Wilmington, MA). OT-I/Rag-1 KO and NZB/NZW F1 mice were purchased from Taconic Biosciences (Hudson, NY) and the Jackson Laboratory (Bar Harbor, ME), respectively. The Siglec-15 conditional knockout mouse strain on a C57BL/6 background was obtained from the Mutant Mouse Regional Resource Center (MMRRC, CA) and was bred with CMV-Cre or LysM-Cre mice from the Jackson Laboratory (Bar Harbor, ME) to generate the whole-body knockout (KO) or myeloid lineage specific KO mice (LysM-Cre KO). The littermates generated from Siglec-15 heterozygotes were bred and maintained in conditions identical to those of Siglec-15 KO mice as the controls. All mouse protocols were in accordance with NIH guidelines and were approved by the Institutional Animal Care and Use Committee of Yale University School of Medicine. LOX IMVI and U87 cells were obtained from NCI (Rockville, MD) and ATCC (Manassas, VA), respectively.
Plasmids, recombinant proteins and gene cloning
The human cDNA library coding ~6500 full-length plasma membrane genes were purchased from GeneCopoeia (Rockville, MD), Open Biosystems (Huntsville, AL), or individually cloned in our lab. All genes were cloned into mammalian expression vectors as previously described26,27. Gene fragments encoding membrane associated anti-human CD3 (OKT3) single-chain variable fragment (scFv), as well as multiple immune adaptors (DAP10-F2A-DAP12-E2A-FCER1G-T2A-CD3Z) were synthesized by GeneScript (Nanjing, China) and cloned into PCEP4 or lentiviral plasmids (Thermo Fisher Scientific, Waltham, MA). Human or mouse Siglec-15 full length genes were cloned from tissue cDNA libraries (Clontech Laboratories, Mountain View, CA). A human Siglec-15 artificial transmembrane chimeric gene construct (S15ATM) was cloned by fusing the human ectodomain of Siglec-15 with the B7-H6 transmembrane domain. The human and mouse Siglec-15 fusion proteins were generated by tagging the extracellular domain fragments with human IgG1 Fc or mouse IgG2a Fc, expressed in 293T-cells by the PEI transfection method (PolySciences, Warrington, PA) and purified using a Protein A affinity column (GE Healthcare, Chicago, IL). Commercial antibodies used in flow cytometry and in vitro cultures were purchased from BD Biosciences (San Jose, CA), BioLegend (San Diego, CA), Thermo Fisher Scientific or R&D systems (Minneapolis, MN).
For gene cloning of mouse and human Siglec-15, cDNAs were prepared from mouse BMDMs and BMDCs and human macrophages and genes were obtained by RT-PCR using RNeasy Mini Kit (Qiagen, Hilden, Germany) and reverse transcription Kit (Thermo Fisher Scientific) or One Taq RT-PCR Kit (New England Biolabs, Ipswich, MA). For analysis of murine Siglec-15 gene expression, cDNA was determined by quantitative PCR using the following primers: forward 5’-CAGCACCGAGATGTTGACGA-3’; reverse 5’-ACGATCGCTATGAGAGTCGC-3’. The mouse tissue cDNA panels were purchase from Clontech (Mountain View, CA).
Genome-scale T-cell activity array
The 6,500 plasmids encoding the cDNA of human transmembrane proteins were diluted individually at 8ng/well into 1536-well plates (Greiner) using a PlateMate robotic liquid handling system (Thermo Fisher Scientific) and stored at −80°C. For the TCAA, the plates were prepared with 2 μl/well of diluted lipofectamine 3000 transfection reagent (Thermo Fisher Scientific) using a Multidrop Combi robotic dispenser (Thermo Fisher Scientific) and subsequently adding 2×10³ aAPC cells in 4 μl. The aAPC is a subline of a 293T line expressing the aforementioned membrane-associated OKT3 scFv fragment and adaptors. After incubation for 18 hrs, 4×10³ Jurkat-NF-κB or a Jurkat-NFAT reporter cell line developed through infection of Jurkat cell with lentiviral reporter plasmids (System Biosciences, Palo Alto, CA) were added into each well. The plates were read 6~8 hrs later by an Incell imaging system (GE Healthcare) or Mirrorball (TTP Labtech, Melbourn, UK) for GFP fluorescence. The data were analyzed by Cellprofiler software (Broad Institute, Boston, MA). For some experiments, Jurkat-NFAT-Luc reporter cell line (Signosis, Santa Clara, CA) was also used and the luciferase activity was monitored by an IVIS imaging system (Perkin Elmer, Waltham, MA).
Bioinformatics
The protein family and homology analysis was conducted using the Uniprot, NCBI Blast and UCSC genome browser. The expression pattern of individual genes in normal human tissues and the cancer lesions were analyzed in BioGPS, as well as by R program using TCGA databases normalized by the cancer browser (https://genome-cancer.ucsc.edu/). The gene expression in mouse tumors was analyzed using the CrownBio MuBase database.
Generation of mAbs, mouse histology and serology analysis
To generate the mAbs, NZB/NZW F1 mice were immunized with mouse Siglec-15 Fc fusion protein in Freund’s adjuvants (Sigma-Aldrich, St Louis, MO) using protocols as previously described44,45. Hybridoma clones (m01 and m03) were screened by mouse Siglec-15 Fc specific ELISA as well as flow cytometry using 293T-S15+ cells. A different panel of Siglec-15 hybridomas were also generated by the immunization of Siglec-15 KO mice with human Siglec-15 Fc in complete Freund’s adjuvant followed by i.p. injection of anti-CD40/GM-CSF (BioLegend), and then boosted with Sigelc15 Fc in incomplete Freund’s adjuvant. Hybridoma clones (5G12 and IH3) were selected based on their specificity to both mouse and human Siglec-15.
Mouse tissues and tumors were excised, fixed with formalin, embedded with paraffin, and stained with hematoxylin and eosin. Tissue inflammatory status was evaluated in a blind manner by pathologists. Anti-nuclear antigens Ig and anti-double stranded DNA IgG in the serum of mice were analyzed by specific ELISA (Alpha Diagnostic International, San Antonio, TX).
Preparation of macrophages
Mouse peritoneal macrophages were collected by washing the peritoneum with cold PBS followed by attachment to flat-bottom plates. To generate BMDMs and BMDCs, single cell suspension of bone marrow aspiration was obtained and placed in RPMI-1640 medium with 10% fetal bovine serum supplemented with 20 ng/ml M-CSF (for BMDMs) or GM-CSF and IL-4 (for BMDCs) for 7 days as previously described46. Recombinant mouse IFN-γ, M-CSF, GM-CSF (R&D Systems), IL-4 (BioLegend) and LPS (Invitrogen, Carlsbad, CA) were used for the culture of BMDMs and BMDCs. Recombinant human M-CSF and IFN-γ were purchased from BioLegend.
T-cell response assays
The assays for costimulation and coinhibition of human and mouse T-cells were previously described44-47. Briefly, human peripheral blood mononuclear cells (PBMCs) were stimulated by a suboptimal dose of immobilized anti-CD3 mAb (OKT3, BioLegend) in the presence of recombinant human Siglec-15 or control Fc proteins. In some experiments, PBMCs were stimulated by OKT3 together with 100ng/ml SEB (Toxin Technology, Sarasota, FL), and Nivolumab15 were used for the PD-1 blockade. Purified mouse T-cells were stimulated by plate-coated anti-mouse CD3 mAb at the indicated concentrations in the presence of Siglec-15 Fc or control Ig. T-cell proliferation was indicated by CFSE (Thermo Fisher Scientific) dilution or 3H-thymidine (Perkin Elmer) incorporation. Human IFN-γ and TNF-α levels in the supernatant were measured at 72 hrs by U-PLEX Array (MSD, Rockville, MD).
Antigen-specific T-cell responses in vitro and in vivo were basically conducted as described previously33,48 using OT-I TCR transgenic T-cells which recognizes a H-2Kb restricted peptide epitope (aa257–264, SIINFEKL) of chicken ovalbumin (OVA). OT-I were purified from spleen of OT-I/Rag-1 KO mice using a CD8+ T-cell isolation kit (StemCell, Vancouver, Canada) by negative selection. Antigen presenting cells for OT-I stimulation were peritoneal macrophages or BMDMs pulsed with OVA257-264 peptide (Genscript) or irradiated 293T-KbOVA cells, a subline of 293T cells transfected with plasmids encoding H-2Kb fused with OVA257-264 peptide. T-cell proliferation was indicated by CFSE dilution or 3H-thymidine incorporation. The cytokines levels were analyzed by mouse Th½/17 cytokine beads array (BD Biosciences). The real-time killing of target cells by OT-I was monitored by xCELLigence RTCA impedance assay (ACEA Biosciences, San Diego, CA). The target cell survival is shown as normalized cell index (normalized to the score at 24 hrs right before the addition of OT-I).
For the in vivo assay, purified OT-I were transferred i.v. into mice on day −1. On day 0, the mice were immunized i.p. with 100 μg OVA257-264 plus 100 μg poly(I:C) (Invitrogen). OT-I in blood and spleen was analyzed by flow cytometry with PE-labeled H-2KbOVA257-264 tetramer (OT-I tetramer, MBL, Woburn, MA) and APC-labeled anti-CD8 antibody (BioLegend) at the indicated time points. Alternatively, mice were fed with EdU (Thermo Fisher Scientific) at 0.8mg/ml in drinking water starting at day 0. OT-I proliferation in blood was analyzed with Click-iT EdU Flow Cytometry Assay Kit (Thermo Fisher Scientific). For the assessment of T-cell apoptosis, splenocytes were isolated and cultured overnight in medium and analyzed by flow cytometry with Annexin V detection kit (BioLegend). For the BMDCs co-transfer experiment, BMDCs pulsed with 2.5 μg/ml OVA257-264 peptide plus 100 ng/ml LPS were injected i.p. into mice at 5×10⁵/mouse followed by i.p. transfer of 2×10⁶ OT-I 6 hrs later. For the IL-10 neutralizing experiment, 200 μg anti-mouse IL-10 antibody (BioXCell, West Lebanon, NH) or isotype control antibody (Sigma-Aldrich) were injected i.p. daily from the day of immunization.
Mouse models and tumor studies
The GL261 glioma brain tumor model was described previously33. Briefly, 4×10⁵ GL261-luc cells (Perkin Elmer) in 20 μl PBS were injected intracranially (i.c.) into the left frontal lobe of mouse brain using a PB-600–1 Repeatable Dispenser (Hamilton, Reno, NV). The brains of mice were irradiated (4Gy) on day 4 using an XRAD 320 irradiator. Tumor growth was monitored by bioluminescence with a Lumina XR in vivo imaging system (Perkin Elmer). Survival of the mice was monitored daily. For immune response analysis, spleens and whole brains were excised at day 14 after tumor inoculation. Brain tissues were digested with 200 μg/ml collagenase IV and 20 μg/ml DNase1 (Sigma-Aldrich) and brain infiltrating immune cells were separated with Percoll (Sigma-Aldrich) followed by flow cytometry analysis. Alternatively, brain lymphocytes were re-stimulated by irradiated GL261-luc cells for 5 days. IFN-γ-producing CD4+ T-cells or CD8+ T-cells were detected by intracellular staining. B16-GMCSF cells were s.c. injected into the flank of mice at 1-1.5×10⁶. Mouse survival was analyzed with the endpoint of 15 mm in mean tumor diameter. On the indicated days, tumors were excised, digested with 200 μg/ml collagenase IV and 20 μg/ml DNase1 (Sigma-Aldrich) for 30 min and mechanically dissociated with the GentleMACS Dissociator (Miltenyi Biotec, Bergisch Gladbach, Germany), and tumor infiltrating immune cells were analyzed by flow cytometry. B16, B16-GMCSF melanoma31, MC38 colon cancer30, and CT26 colon cancer36 were all described previously. MC38 or MC38-S15+ cells were injected either s.c. at 4×10⁵/mouse or i.v. at 1×10⁵/mouse into syngeneic C57BL/6 mice to induce tumors. To examine the role of BMDMs, BMDMs were treated with 20ng/ml M-CSF and IL-10 for 4 days and then detached from plates with cold PBS containing 2.5 μM EDTA. MC38 or CT26 tumor cells were pre-mixed with BMDMs at indicated cell numbers and s.c. injected into syngeneic C57BL/6 or Balb/c mice, respectively. When indicated, mice were treated i.p. with anti-Siglec-15 mAbs (5G12 or m01) and isotype control antibody after tumor inoculation. The AH1 MHC-I dextramer and control dextramer (Immudex, Copenhagen, Denmark) were used to detect CT26-specific CD8+ T-cells. For the combination therapy with anti-PD-1 mAb, mice were treated with 200 μg 5G12 and/or 100 μg RMPI-14 (anti-murine PD-1) or isotype control mAb. Tumor growth was monitored by an electronic caliper regularly and presented as the mean tumor diameter (length + width)/2 in millimeters as described previously49.
Mass cytometry
Mouse tumor tissues were digested as described above. Upon filtration in a 70-μm cell strainer (BD Falcon), cells were first incubated with anti-mouse CD16/32 mAb for 10 min at room temperature to block Fc receptors and subsequently stained with the metal-labeled mAb cocktail against cell surface molecules. After the treatment with the Fixation/Permeabilization Buffer (ebioscience), cells were further incubated with mAb cocktails against intracellular proteins. Antibodies used in the mass cytometry analysis were purchased from Fluidigm. Cell samples were diluted in ddH2O containing bead standards to approximately 106 cells/ml, and then analyzed by a mass cytometer (CyTOF, Fluidigm) equilibrated with ddH2O.
Mass cytometry data analysis
All mass cytometry files were normalized, and manually gated in Cytobank software (Santa Clara, CA) by DNA, event length, live/dead discrimination, CD45, and 4 bead channels to exclude dead, debris, doublets, and non-immune cells and beads. Data were cytofAsinh transformed before applying to the downstream analysis. Phenograph clustering analysis in R cytofkit package50 was performed to pooled samples to automatically identify underlying immune subsets. Heat-maps were generated based on the mean value for each marker in clusters. Cell frequency in each cluster was calculated as the assigned cell events dividing the total CD45+cell events in the same sample.
Immunofluorescence staining
Tissue specimens were prepared in a tissue microarray (TMA) format as previously described51. Representative tumor areas were obtained from formalin-fixed, paraffin-embedded (FFPE) specimens of the primary tumor, and 0.6mm cores from each tumor block were arrayed in a recipient block. A previously described cohort52, YTMA 250, represented in tissue microarray was used to assess Siglec-15 and B7-H1 expression. Detailed characteristics of the patients are presented in Supplementary Table 2. For Siglec-15 measurements, fresh TMA sections were deparaffinized and subjected to antigen retrieval using Citrate buffer (Sigma-Aldrich) pH 6.0 for 20 minutes at 97° C in a pressure-boiling container (PT module, Lab Vision, Fremont, CA). Slides were then incubated in 30% hydrogen peroxide in methanol for 30 minutes at room temperature and subsequently with a blocking solution containing 0.3% bovine serum albumin in 0.05% Tween solution for 30 minutes. Then, slides were incubated overnight with a cocktail of the primary antibody for Siglec-15 (PA5–48221, rabbit polyclonal antibody, Thermo Fisher Scientific) and a mouse monoclonal cytokeratin antibody clone AE1/AE3 (M3515, Agilent, Santa Clara, CA). Next, a mixture of Alexa 546 conjugated goat anti-mouse secondary antibody (Molecular Probes, Eugene, OR) diluted in rabbit EnVision reagent (K4003, Agilent) was applied to the slides for 60 minutes at room temperature. Cyanine 5 directly conjugated to tyramide (FP1117, Perkin Elmer) at a 1:50 dilution for 10 minutes was used for target detection and ProLong mounting medium (ProLong Gold, Molecular Probes) containing 4’,6-Diamidino-2-Phenylindole (DAPI) was used to stain nuclei. A similar protocol was used for B7-H1(E1L3N, rabbit monoclonal, Cell Signaling, Danvers, MA). Quantitative immunofluorescence (QIF) measurement of Siglec-15 and B7-H1 was performed using AQUA (Automated Quantitative Analysis) method (Genoptix Medical Laboratory), quantifying fluorescent signal within subcellular compartments (tumor and stroma), as previously described53. Each patient case was represented by two non-adjacent sampled cores and the maximal marker score obtained from the two cores of each case was used for statistical analysis.
Multiplexed Siglec-15 and CD68 staining
The multiplexing protocol has been presented before54. Briefly, tissue sections were subjected to the same deparaffinization, antigen retrieval and blocking protocol mentioned above. Staining for pan-cytokeratin, Siglec-15 and CD68 was performed using a sequential multiplexed immunofluorescence protocol with isotype-specific primary antibodies to detect epithelial tumor cells (cytokeratin: clone Z0622, Agilent), Siglec-15 and CD68 (PG-M1, mouse IgG3, Agilent). Nuclei were highlighted using DAPI. Secondary antibodies and fluorescent reagents used were goat anti-rabbit Alexa546 (Molecular Probes) for cytokeratin detection, anti-rabbit Envision (K4009, Agilent) with Cy5-tyramide (Perkin Elmer) for Siglec-15 detection and anti-mouse IgG3 antibody (1:1000, Abcam, Cambridge, MA) with fluorescein-tyramide (Perkin Elmer) for CD68 detection. Residual horseradish peroxidase activity between incubations with secondary antibodies was eliminated by exposing the slides twice for seven minutes to a solution containing benzoic hydrazide and hydrogen peroxide.
In situ mRNA hybridization
In situ detection of Siglec-15 transcripts in FFPE TMA samples was performed using the RNAscope assay with custom-designed in situ hybridization probes (Advanced Cell Diagnostics) coupled to automated QIF detection as described55,56. Briefly, 5μm sections were deparaffinized, boiled with RNAscope retrieval reagent for 15 minutes, and submitted to protease digestion for 30 minutes followed by hybridization for 2 hours at 40° C with target probes to human Siglec-15 mRNA, Cyclophilin B as a positive control, or the bacterial gene dapB mRNA as a negative control. Hybridization signals were detected with Cy5-tyramide. Preparations were then incubated with rabbit polyclonal cytokeratin antibody (Z0622, Agilent) for 1 hour followed by detection with Alexa 546-conjugated goat anti-rabbit secondary antibody (Molecular Probes). Slides were mounted using ProLong Gold plus DAPI to highlight nuclei. Assay specificity was assessed by measuring the signal in positive and negative control cell line samples.
Statistical analysis
Prism 7.0 software (GraphPad) was used for statistical analysis. Figure legends specify the statistical analysis method performed. P values were considered statistically significant if P < 0.05. The error bars in the figures represent the standard error of the mean (s.e.m.) or the standard deviation (s.d.).
Data availability
All data generated or analyzed during this study are included in this published article (and its supplementary information files). Please contact the corresponding author for unique material requests. Some material used in the reported research may require requests to collaborators and agreements with both commercial and non-profit institutions, as specified in the paper. Requests are reviewed by Yale University to verify whether the request is subject to any intellectual property or confidentiality obligations. Any material that can be shared will be released via a Material Transfer Agreement.
Extended Data
Extended Data Figure 1. Schematic representation of the outcome from the TCAA screening.
The 293T cells stably expressing membrane associated anti-human CD3 antibody (OKT3) scFv were used to stimulate the activation of Jurkat-NF-κB-reporter cells to generate GFP signals. Expression of an individual plasmid encoding human transmembrane gene would engage a potential receptor on Jurkat T-cells to co-stimulate or co-inhibit OKT3-induced T-cell activation. Unchanged GFP signal upon the transfection of 293T cells indicates the lack of costimulatory or coinhibitory activity.
Extended Data Figure 2. Siglec-15 mRNA expression in normal tissues of human and mouse origin.
(a) Siglec-15 mRNA relative levels in human tissues and immune cell subsets from BioGPS database. A dash line was added to indicate the flow cytometry detection threshold (verified by Siglec-15 negative staining on CD8 T cells). Data are mean ± s.e.m. (tissues, n = 2; monocyte, n = 6; macrophage, n = 10; other immune subsets, n = 4 samples).
(b) Siglec-15 mRNA expression in mouse tissues was tested by RT-PCR, quantified by ImageJ software (NIH) and normalized to the levels of reference gene GAPDH. The 293T-cells overexpressing Siglec-15 were used as a positive control. E7, day 7 embryos.
Extended Data Figure 3: Siglec-15 protein expression on human and mouse immune cells.
(a) Flow cytometry analysis of 293T-cells transfected with empty vector (pcDNA) or plasmid with full length Siglec-15 gene and stained by m03 (anti-Siglec-15 mAb).
(b) Siglec-15 expression on lymphocytes and neutrophils from S15KO and WT mice by flow cytometry analysis with m03. In a and b, data are representative of three independent experiments.
(c) Flow cytometry analysis of Siglec-15 expression on the RAW264.7 macrophage line treated with or without 20 ng/ml recombinant murine IFN-γ for 48 hrs.
(d) Human CD14+ monocytes from peripheral blood were incubated for 7 days in the presence of 100 ng/ml M-CSF (M-CSF group) or M-CSF for 4 days followed by M-CSF plus 50 ng/ml IFN-γ for 3 more days (M-CSF + IFN-γ group) or medium only as control (Medium). Siglec-15 mRNA levels was determined by RT-PCR. Data are presented as mean ± s.e.m. after intra-sample normalization to the reference gene GAPDH (n = 4 cell cultures). P values by two-tailed unpaired t-test. In c and d, data are representative of two independent experiments.
Extended Data Figure 4. Effect of Siglec-15 as recombinant protein or cell surface protein on human and mouse T-cell functions.
(a) The effect of plate-coated hSiglec-15-hIg or control hIg (5 μg/ml) on human T-cell proliferation in the presence of plate-coated anti-human CD3 mAb at the indicated concentrations. Proliferation of T-cells was indicated by 3H-thymidine incorporation at 72 hrs.
(b) The effect of plate-coated mSiglec-15-mIg or control mIg (5 μg/ml) on mouse splenic T-cell proliferation in the presence of plate-coated anti-mouse CD3 mAb (1 μg/ml). Proliferation of T-cells was indicated by 3H-thymidine incorporation at 72 hrs.
(c, d) The effect of soluble mSiglec-15-mIg or control mIg (5 μg/ml) on mouse splenic CD8+ T-cells in the presence of coated anti-mouse CD3 mAb (1 μg/ml). The cell proliferation as indicated by CSFE dilution (c) and IFN-γ in the culture medium (d) at 72 hrs are shown.
(e) The 293T-KbOVA-S15+ or S15 negative control cells were placed in a 384-well plate at 1×10⁴/well for 24 hrs, followed by the addition of OT-I (1×10⁴/well) pre-activated with OVA257-264. Real-time survival of target cells was monitored by the xCELLigence cellular impedance assay (left panel) and normalized by the value right before adding OT-I cells (normalized cell index). Data at 72 hrs are shown as a bar in the right panel.
All data above are mean ± s.e.m. (n = 3 or 4 cell cultures) and representative of two independent experiments. P values by two-tailed unpaired t-test.
Extended Data Figure 5. Normal phenotype of Siglec-15 deficient mice.
(a) Tissue histological analysis was performed on 18-month-old Siglec-15 KO mice and WT littermate and is shown as the pathological score (see Materials and Methods). The indicated tissues were fixed in formalin, embedded with paraffin, and stained with hematoxylin and eosin. The inflammatory status of tissues was evaluated based on a semi-quantitative method that describes the level of immune infiltration. Data are presented as mean.
(b-d) The body (b), spleen (c) and liver (d) weight of Siglec-15 KO and WT mice. Data are presented as mean ± s.d.
(e, f) The levels of anti-dsDNA IgG antibodies (e) and anti-nuclear antibodies (ANA) (f) in sera of 18-month-old Siglec-15 KO and WT mice were quantified by specific sandwich ELISA. Data are presented as mean ± s.e.m. In a-f, data are analyzed by two-tailed unpaired t-test (WT n = 27 mice; KO n = 34 mice; n.s., not significant).
(g) Gating strategy for OT-I T-cell EdU incorporation and apoptosis analysis by flow cytometry.
(h) Siglec-15 KO or WT BMDCs pulsed with OVA257-264 peptide were injected i.p. into WT mice at 5×10⁵/mouse followed by i.p. injection of OT-I T-cells at 2×10⁶/mouse 6 hrs later. The OT-I in the blood at the indicated time-points were analyzed by flow cytometry. The results are shown as the percentage of OT-I among total CD8+ T-cells. Data are mean ± s.e.m. (n= 5 mice per group). Data are analyzed by two-way ANOVA.
Extended Data Figure 6. Analysis of Siglec-15 mRNA expression in human cancers.
(a) The inverse correlation of mRNA expression levels between Siglec-15 and T-cell signature genes (CD3E, IFNG, GZMA and GZMB) in bladder cancer by meta-analysis of TCGA databases. Pearson r score and P value are shown (n=407 human samples).
(b-d) Validation of anti-Siglec-15 antibody clone PA5-48221. Representative quantitative immunofluorescence images of positive staining on 293T cells overexpressing Siglec-15 (293T-S15+, left panel) compared to mock transfected 293T cells (293T-S15-, right panel) (DAPI [blue] and S15 [red]) (b) Data are representative of four independent experiments. QIF scores of 293T-S15+ and 293T-S15- cell lines (c). Data are mean ± s.e.m. (n= 4 independent experiments). P values by two-tailed unpaired t-test. Comparison of Siglec-15 protein and RNA expression using RNAscope in situ detection by QIF (d). Pearson r score and P value are shown (n = 27 human samples).
(e) The relative levels of Siglec-15 mRNA in human cancer cell lines from the BioGPS database.
(f) Cell surface expression of Siglec-15 on LOX IMVI and U87 human cancer lines by staining with anti-Siglec-15 and control mAb and analyzed with flow cytometry. Data are representative of three independent experiments.
Extended Data Figure 7. Expression and function of Siglec-15 in mouse tumors.
(a) Siglec-15 mRNA expression in tumors from indicated mouse models by comparison to B7-H1, analyzed from the CrownBio MuBase database.
(b) Siglec-15 mRNA levels in tumors of B16-GMCSF and GL261 model was determined by RT-PCR on day14 after inoculation. Spleen from a S15KO mouse was used as negative control. Data are relative levels to reference gene RPL13a.
(c) Flow cytometric analysis of Siglec-15 expression on infiltrating immune cell subsets of B16-GMCSF tumors from Siglec-15 WT and KO mice on day 14 after inoculation. Data are representative of two independent experiments.
(d, e) B16-GMCSF tumor cells at 1.5×10⁶/mouse or wild type B16 tumor cells at 1×10⁶/mouse were injected s.c. into Siglec-15 WT, KO or LysM-Cre KO as indicated. Tumor growth was measured regularly and is shown as the mean tumor diameter ± s.e.m. (n=6 mice per group). P values by two-way ANOVA (n.s., not significant; P = 0.3180).
Extended Data Figure 8. Immunophenotyping of B16-GMCSF tumors.
(a-c) Mass cytometry analysis of tumor-infiltrating leukocytes isolated at day 14 after B16-GMCSF tumor cell inoculation as described in Figure 5 (n = 3 mice per group). t-SNE plot of tumor infiltrating leukocytes overlaid with the expression of indicated markers (a). Density t-SNE plots of an equal number of CD45+ tumor-infiltrating leukocytes in Siglec-15 KO and WT mice (b). The normalized expression value (mean mass intensity) of checkpoint receptors on tumor-infiltrating CD8+ T-cells (c).
(d, e) On day 14 after B16-GMCSF tumor cell inoculation, spleens and lymph nodes (LN) from WT and KO mice were dissected (d). The percentage of CD4+ and CD8+ T-cells in the draining and non-draining lymph nodes (LN) was analyzed by flow cytometry (e). Data are mean ± s.e.m. (n = 4 mice per group). P values by two-tailed unpaired t-test.
(f) B16-GMCSF tumor cells were injected s.c. into Siglec-15 WT and KO at 1.5×10⁶/mouse. Mice were treated with 200μg anti-CD8 antibody every 3 to 4 days since 3 days before tumor inoculation. Tumor growth was measured regularly and is shown as the mean tumor diameter ± s.e.m. (n=5 mice per group). P values by two-way ANOVA (n.s., not significant; P = 0.9372).
Extended Data Figure 9. Growth of GL261 Glioblastoma in Siglec-15 deficient mice and analysis of immune infiltration.
(a, b) GL261-luc cells were injected i.c. into Siglec-15 WT, KO or LysM-Cre KO mice at 4×10⁵/mouse. Mice were subsequently treated with a 4Gy whole brain radiation on day 4. Tumor volume in mice was measured by the IVIS imaging system every 4 to 5 days. Tumor growth in individual Siglec-15 WT or KO mice (left) and imaging at day 13 and 18 after tumor inoculation (right) are shown in (a) (n=10 mice per group). Data are representative of two independent experiments. The GL261-luc tumor growth in Siglec-15 WT, KO and LysM-Cre KO mice is mean bioluminescence in radiance ± s.e.m. over time (b) (WT, n = 10 mice; KO, n = 10 mice; LysM-Cre KO, n=8 mice). P values by two-tailed Mann-Whitney test.
(c-e) Flow cytometry analysis of tumor-infiltrating immune cells at day 14 after GL261 tumor inoculation (n=4 per group). CD8+ T-cells, CD4+ T-cells, CD11b+ CD45high macrophages (MØ), CD11b+ CD45low microglia, and CD11c+ dendritic cells (DC) in brain (c) or spleen (d) were quantified by flow cytometry. Brain mononuclear cells were further re-stimulated with irradiated GL261-luc cells for 5 days. Total number of IFN-γ-producing CD8+ T-cells and CD4+ T-cells was determined by live cell counting and intracellular staining (e). Data are mean ± s.e.m. (n = 4 mice per group) and representative of two independent experiments. P values by two-tailed unpaired t-test (n.s., not significant; c, P = 0.1937; d, P = 0.0916 and 0.0624; e, P = 0.4820).
Extended Data Figure 10. Effect of α-S15 on established mouse tumors with tumor-associated macrophages.
(a) Binding of PE-labeled α-S15 (5G12) to 293T cells overexpressing human or mouse Siglec-15. 293T parental cells served as controls. Data are representative of three independent experiments.
(b, c) Human PBMCs were stimulated by coated OKT3 (0.1 μg/mL) in 96-well plates for 3 days in the presence of 5 μg/ml hS15-hIg or control hIg with or without α-S15 at 12 μg/ml. The proliferation of CD4+ T-cell (b) and CD8+ T-cell (c) was indicated by CFSE dilution. Data are mean ± s.e.m. (n = 6 cell cultures) and representative of three independent experiments. P values by two-tailed unpaired t-test.
(d) B16-GMCSF tumor cells were s.c. injected into WT C57BL/6 mice at 1.5×10⁶/mouse and subsequently treated with 200 μg α-S15 or isotype control mAb at day 5, 9, 13 and 17 (n= 7 mice per group). P values by two-tailed unpaired t-test.
(e) MC38 tumor cells (3×10⁵) mixed with or without WT or KO BMDMs (2×10⁵) were s.c. injected into C57BL/6 mice (n= 5 mice per group). P values by two-way ANOVA (n.s., not significant; P = 0.4920).
(f) MC38 tumor cells (3×10⁵) mixed with Siglec-15 KO BMDMs (2×10⁵) were s.c. injected into C57BL/6 mice and subsequently treated with 200 μg α-S15 or isotype control mAb at day 5, 9, 13 and 17 (n= 7 mice per group). P values by two-way ANOVA (n.s.; P = 0.9727).
(g) CT26 tumor cells (1.5×10⁵) mixed with Balb/c BMDMs (1.5×10⁵) were s.c. injected into Balb/c mice and subsequently treated with 200 μg α-S15 or isotype control mAb as described in the methods (n= 10 mice per group). Data are representative of two independent experiments. P values by two-way ANOVA.
(h, i) On day 15 after CT26 tumor inoculation as described in (g), tumor infiltrating CD8+ T-cells (h) and CT26 tumor-specific CD8+ T-cells (i) were stained with anti-CD8 mAb and AH1 dextramer+ and analyzed by flow cytometry (control, n = 5 mice; α-S15, n = 3 mice). P values by two-tailed unpaired t-test.
(j) CT26 tumor cells (1.5×10⁵) mixed with Balb/c BMDMs (1.5×10⁵) were s.c. injected into Balb/c mice. Mice were treated with 200 μg α-S15 or isotype control mAb and/or 100 μg anti-PD-1 mAb as described in the methods (n= 10 mice per group). P values by two-way ANOVA.
In d-j, data are presented as mean ± s.e.m.
(k) Expression of Siglec-15 on transduced MC38 cells (MC38-S15+) or parental cells (MC38-WT) as determined by staining with m03 mAb or control antibody and flow cytometry analysis. Data are representative of three independent experiments.
(l) OT-I T-cells from OT-I/Rag-1 KO mice were injected i.v. into C57BL/6 mice that are subsequently immunized with OVA257-264 peptide and adjuvant as described in Fig. 3. Spleen cells were isolated on day 5 and stained by mouse Siglec-15 recombinant fusion protein or by control Ig for flow cytometry analysis. Data are shown in a histogram as specific binding to OT-I T-cells gated by anti-CD8 mAb and OT-I tetramer positive staining. Data are representative of two independent experiments.
Supplementary Material
Acknowledgements
We thank Beth Cadugan for editing the manuscript; other members in the laboratories of Dr. Chen-Yale and NextCure for helpful discussions and technical assistance; and Dr. Drew Pardoll and Dr. Juan Fu at Johns Hopkins University for the B16-GMCSF cell line. This research was supported partially by the National Institutes of Health grants P30 CA16359, P50 CA196530, sponsored research funding from NextCure Inc. and the United Technologies Corporation Endowed Chair.
Footnotes
Disclosures
In the past 12 months, LC is a consultant/advisory board member for NextCure, AstraZenca, Pfizer, Junshi, Vcanbio and GenomiCare; is a scientific founder of NextCure and Tayu Biotech Group and has sponsored research grants from NextCure, Pfizer and Boehringer Ingelheim, DR is a consultant/advisory board member for Amgen, Astra Zeneca, Agendia, Biocept, Bristol-Myers Squibb, Cell Signaling Technology, Cepheid, Daiichi Sankyo, Merck, NanoString, Perkin Elmer, PAIGE, and Ultivue and has sponsored research grants from AstraZeneca, Cepheid, Navigate/Novartis, NextCure, Lilly, Ultivue, and Perkin Elmer, RH is a consultant/advisory board member for Abbvie Pharmaceuticals, AstraZeneca, Biodesix, Bristol-Myers Squibb, Eli Lilly and Company, EMD Serrano, Genentech/Roche, Heat Biologics, Infinity Pharmaceuticals, Junshi Pharmaceuticals, Loxo Oncology, Merck and Company, Nektar, Neon Therapeutics, NextCure, Novartis, Pfizer, Sanofi, Seattle Genetics, Shire PLC, Spectrum Pharmaceuticals, Symphogen, TESARO and has sponsored research grants from AstraZeneca, Eli Lilly and Company, Merck and Company, and a board member (non-executive/ independent) for Junshi Pharmaceuticals. There are patent applications pending related to this work.
References
- 1.Chen L & Flies DB Molecular mechanisms of T cell co-stimulation and co-inhibition. Nat Rev Immunol 13, 227–242 (2013). [DOI] [PMC free article] [PubMed] [Google Scholar]
- 2.Chen L Co-inhibitory molecules of the B7-CD28 family in the control of T-cell immunity. Nat Rev Immunol 4, 336–347 (2004). [DOI] [PubMed] [Google Scholar]
- 3.Greenwald RJ, Freeman GJ & Sharpe AH The B7 family revisited. Annu Rev Immunol 23, 515–548 (2005). [DOI] [PubMed] [Google Scholar]
- 4.Chen L, et al. Costimulation of antitumor immunity by the B7 counterreceptor for the T lymphocyte molecules CD28 and CTLA-4. Cell 71, 1093–1102 (1992). [DOI] [PubMed] [Google Scholar]
- 5.Leach DR, Krummel MF & Allison JP Enhancement of antitumor immunity by CTLA-4 blockade. Science 271, 1734–1736 (1996). [DOI] [PubMed] [Google Scholar]
- 6.Melero I, et al. Monoclonal antibodies against the 4–1BB T-cell activation molecule eradicate established tumors. Nat Med 3, 682–685 (1997). [DOI] [PubMed] [Google Scholar]
- 7.Dong H, et al. Tumor-associated B7-H1 promotes T-cell apoptosis: a potential mechanism of immune evasion. Nat Med 8, 793–800 (2002). [DOI] [PubMed] [Google Scholar]
- 8.Chen L & Han X Anti-PD-1/PD-L1 therapy of human cancer: past, present, and future. J Clin Invest 125, 3384–3391 (2015). [DOI] [PMC free article] [PubMed] [Google Scholar]
- 9.Zou W, Wolchok JD & Chen L PD-L1 (B7-H1) and PD-1 pathway blockade for cancer therapy: Mechanisms, response biomarkers, and combinations. Sci Transl Med 8, 328rv324 (2016). [DOI] [PMC free article] [PubMed] [Google Scholar]
- 10.Dong H, Zhu G, Tamada K & Chen L B7-H1, a third member of the B7 family, co-stimulates T-cell proliferation and interleukin-10 secretion. Nat Med 5, 1365–1369 (1999). [DOI] [PubMed] [Google Scholar]
- 11.Freeman GJ, et al. Engagement of the PD-1 immunoinhibitory receptor by a novel B7 family member leads to negative regulation of lymphocyte activation. J Exp Med 192, 1027–1034 (2000). [DOI] [PMC free article] [PubMed] [Google Scholar]
- 12.Taube JM, et al. Colocalization of inflammatory response with B7-h1 expression in human melanocytic lesions supports an adaptive resistance mechanism of immune escape. Sci Transl Med 4, 127ra137 (2012). [DOI] [PMC free article] [PubMed] [Google Scholar]
- 13.Kim TK, Herbst RS & Chen L Defining and Understanding Adaptive Resistance in Cancer Immunotherapy. Trends Immunol 39, 624–631 (2018) [DOI] [PMC free article] [PubMed] [Google Scholar]
- 14.Sanmamed MF & Chen L A Paradigm shift in cancer immunotherapy: From enhancement to normalization. Cell 175, 313–326 (2018). [DOI] [PMC free article] [PubMed] [Google Scholar]
- 15.Sznol M & Chen L Antagonist antibodies to PD-1 and B7-H1 (PD-L1) in the treatment of advanced human cancer--response. Clin Cancer Res 19, 5542 (2013). [DOI] [PMC free article] [PubMed] [Google Scholar]
- 16.Lipson EJ, et al. Antagonists of PD-1 and PD-L1 in Cancer Treatment. Semin Oncol 42, 587–600 (2015). [DOI] [PMC free article] [PubMed] [Google Scholar]
- 17.Zhang Y & Chen L Classification of Advanced Human Cancers Based on Tumor Immunity in the MicroEnvironment (TIME) for Cancer Immunotherapy. JAMA Oncol 2, 1403–1404 (2016). [DOI] [PMC free article] [PubMed] [Google Scholar]
- 18.Gajewski TF, Schreiber H & Fu YX Innate and adaptive immune cells in the tumor microenvironment. Nat Immunol 14, 1014–1022 (2013). [DOI] [PMC free article] [PubMed] [Google Scholar]
- 19.Mittal D, Gubin MM, Schreiber RD & Smyth MJ New insights into cancer immunoediting and its three component phases--elimination, equilibrium and escape. Curr Opin Immunol 27, 16–25 (2014). [DOI] [PMC free article] [PubMed] [Google Scholar]
- 20.Gangadhar TC & Vonderheide RH Mitigating the toxic effects of anticancer immunotherapy. Nat Rev Clin Oncol 11, 91–99 (2014). [DOI] [PubMed] [Google Scholar]
- 21.Angata T, Tabuchi Y, Nakamura K & Nakamura M Siglec-15: an immune system Siglec conserved throughout vertebrate evolution. Glycobiology 17, 838–846 (2007). [DOI] [PubMed] [Google Scholar]
- 22.Hiruma Y, Hirai T & Tsuda E Siglec-15, a member of the sialic acid-binding lectin, is a novel regulator for osteoclast differentiation. Biochem Biophys Res Commun 409, 424–429 (2011). [DOI] [PubMed] [Google Scholar]
- 23.Hiruma Y, et al. Impaired osteoclast differentiation and function and mild osteopetrosis development in Siglec-15-deficient mice. Bone 53, 87–93 (2013). [DOI] [PubMed] [Google Scholar]
- 24.Stuible M, et al. Mechanism and function of monoclonal antibodies targeting siglec-15 for therapeutic inhibition of osteoclastic bone resorption. J Biol Chem 289, 6498–6512 (2014). [DOI] [PMC free article] [PubMed] [Google Scholar]
- 25.Shimizu T, et al. Sialic acid-binding immunoglobulin-like lectin 15 (Siglec-15) mediates periarticular bone loss, but not joint destruction, in murine antigen-induced arthritis. Bone 79, 65–70 (2015). [DOI] [PubMed] [Google Scholar]
- 26.Yao S, et al. B7-H2 is a costimulatory ligand for CD28 in human. Immunity 34, 729–740 (2011). [DOI] [PMC free article] [PubMed] [Google Scholar]
- 27.Wang J, et al. Fibrinogen-like protein 1 is a major immune inhibitory ligand of LAG-3. Cell 176, 334–347 e312 (2019). [DOI] [PMC free article] [PubMed] [Google Scholar]
- 28.Peper JK, et al. An impedance-based cytotoxicity assay for real-time and label-free assessment of T-cell-mediated killing of adherent cells. J Immunol Methods 405, 192–198 (2014). [DOI] [PubMed] [Google Scholar]
- 29.Clausen BE, Burkhardt C, Reith W, Renkawitz R & Forster I Conditional gene targeting in macrophages and granulocytes using LysMcre mice. Transgenic Res 8, 265–277 (1999). [DOI] [PubMed] [Google Scholar]
- 30.Mosely SI, et al. Rational Selection of Syngeneic Preclinical Tumor Models for Immunotherapeutic Drug Discovery. Cancer Immunol Res 5, 29–41 (2017). [DOI] [PubMed] [Google Scholar]
- 31.Dranoff G, et al. Vaccination with irradiated tumor cells engineered to secrete murine granulocyte-macrophage colony-stimulating factor stimulates potent, specific, and long-lasting anti-tumor immunity. Proc Natl Acad Sci U S A 90, 3539–3543 (1993). [DOI] [PMC free article] [PubMed] [Google Scholar]
- 32.De Henau O, et al. Overcoming resistance to checkpoint blockade therapy by targeting PI3Kgamma in myeloid cells. Nature 539, 443–447 (2016). [DOI] [PMC free article] [PubMed] [Google Scholar]
- 33.Flies DB, et al. Coinhibitory receptor PD-1H preferentially suppresses CD4(+) T cell -mediated immunity. J Clin Invest 124, 1966–1975 (2014). [DOI] [PMC free article] [PubMed] [Google Scholar]
- 34.Levine JH, et al. Data-Driven Phenotypic Dissection of AML Reveals Progenitor-like Cells that Correlate with Prognosis. Cell 162, 184–197 (2015). [DOI] [PMC free article] [PubMed] [Google Scholar]
- 35.Ricard C, et al. Phenotypic dynamics of microglial and monocyte-derived cells in glioblastoma-bearing mice. Sci Rep 6, 26381 (2016). [DOI] [PMC free article] [PubMed] [Google Scholar]
- 36.Slansky JE, et al. Enhanced antigen-specific antitumor immunity with altered peptide ligands that stabilize the MHC-peptide-TCR complex. Immunity 13, 529–538 (2000). [DOI] [PubMed] [Google Scholar]
- 37.Hirano F, et al. Blockade of B7-H1 and PD-1 by monoclonal antibodies potentiates cancer therapeutic immunity. Cancer Res 65, 1089–1096 (2005). [PubMed] [Google Scholar]
- 38.Ishida-Kitagawa N, et al. Siglec-15 protein regulates formation of functional osteoclasts in concert with DNAX-activating protein of 12 kDa (DAP12). J Biol Chem 287, 17493–17502 (2012). [DOI] [PMC free article] [PubMed] [Google Scholar]
- 39.Kameda Y, et al. Siglec-15 regulates osteoclast differentiation by modulating RANKL-induced phosphatidylinositol 3-kinase/Akt and Erk pathways in association with signaling Adaptor DAP12. J Bone Miner Res 28, 2463–2475 (2013). [DOI] [PubMed] [Google Scholar]
- 40.Takamiya R, Ohtsubo K, Takamatsu S, Taniguchi N & Angata T The interaction between Siglec-15 and tumor-associated sialyl-Tn antigen enhances TGF-beta secretion from monocytes/macrophages through the DAP12-Syk pathway. Glycobiology 23, 178–187 (2013). [DOI] [PubMed] [Google Scholar]
- 41.Hamilton JA Colony-stimulating factors in inflammation and autoimmunity. Nat Rev Immunol 8, 533–544 (2008). [DOI] [PubMed] [Google Scholar]
- 42.Chang L, et al. Identification of Siglec Ligands Using a Proximity Labeling Method. J Proteome Res 16, 3929–3941 (2017). [DOI] [PubMed] [Google Scholar]
- 43.Briard JG, Jiang H, Moremen KW, Macauley MS & Wu P Cell-based glycan arrays for probing glycan-glycan binding protein interactions. Nat Commun 9, 880 (2018). [DOI] [PMC free article] [PubMed] [Google Scholar]
- 44.Chapoval AI, et al. B7-H3: a costimulatory molecule for T cell activation and IFN-gamma production. Nat Immunol 2, 269–274 (2001). [DOI] [PubMed] [Google Scholar]
- 45.Sica GL, et al. B7-H4, a molecule of the B7 family, negatively regulates T cell immunity. Immunity 18, 849–861 (2003). [DOI] [PubMed] [Google Scholar]
- 46.Yao S, et al. PD-1 on dendritic cells impedes innate immunity against bacterial infection. Blood 113, 5811–5818 (2009). [DOI] [PMC free article] [PubMed] [Google Scholar]
- 47.Zhu Y, et al. B7-H5 costimulates human T cells via CD28H. Nat Commun 4, 2043 (2013). [DOI] [PMC free article] [PubMed] [Google Scholar]
- 48.Tsushima F, et al. Interaction between B7-H1 and PD-1 determines initiation and reversal of T-cell anergy. Blood 110, 180–185 (2007). [DOI] [PMC free article] [PubMed] [Google Scholar]
- 49.Chen L, et al. Tumor immunogenicity determines the effect of B7 costimulation on T cell-mediated tumor immunity. J Exp Med 179, 523–532 (1994). [DOI] [PMC free article] [PubMed] [Google Scholar]
- 50.Chen H, et al. Cytofkit: A Bioconductor Package for an Integrated Mass Cytometry Data Analysis Pipeline. PLoS Comput Biol 12, e1005112 (2016). [DOI] [PMC free article] [PubMed] [Google Scholar]
- 51.McCabe A, Dolled-Filhart M, Camp RL & Rimm DL Automated quantitative analysis (AQUA) of in situ protein expression, antibody concentration, and prognosis. J Natl Cancer Inst 97, 1808–1815 (2005). [DOI] [PubMed] [Google Scholar]
- 52.Altan M, et al. B7-H3 Expression in NSCLC and Its Association with B7-H4, PD-L1 and Tumor-Infiltrating Lymphocytes. Clin Cancer Res 23, 5202–5209 (2017). [DOI] [PMC free article] [PubMed] [Google Scholar]
- 53.Schalper KA, et al. In situ tumor PD-L1 mRNA expression is associated with increased TILs and better outcome in breast carcinomas. Clin Cancer Res 20, 2773–2782 (2014). [DOI] [PubMed] [Google Scholar]
- 54.Camp RL, Chung GG & Rimm DL Automated subcellular localization and quantification of protein expression in tissue microarrays. Nat Med 8, 1323–1327 (2002). [DOI] [PubMed] [Google Scholar]
- 55.Brown JR, et al. Multiplexed quantitative analysis of CD3, CD8, and CD20 predicts response to neoadjuvant chemotherapy in breast cancer. Clin Cancer Res 20, 5995–6005 (2014). [DOI] [PMC free article] [PubMed] [Google Scholar]
- 56.Bordeaux JM, et al. Quantitative in situ measurement of estrogen receptor mRNA predicts response to tamoxifen. PLoS One 7, e36559 (2012). [DOI] [PMC free article] [PubMed] [Google Scholar]
Associated Data
This section collects any data citations, data availability statements, or supplementary materials included in this article.
Supplementary Materials
Data Availability Statement
All data generated or analyzed during this study are included in this published article (and its supplementary information files). Please contact the corresponding author for unique material requests. Some material used in the reported research may require requests to collaborators and agreements with both commercial and non-profit institutions, as specified in the paper. Requests are reviewed by Yale University to verify whether the request is subject to any intellectual property or confidentiality obligations. Any material that can be shared will be released via a Material Transfer Agreement.


