

Abstract
Abstract As urban areas continue to expand and replace natural and agricultural landscapes, the ability to manage and conserve native wildlife within urban environments is becoming increasingly important. To do so we first need to understand species' responses to local‐level habitat attributes in order to inform the decision‐making process and on‐ground conservation actions. Patterns in the occurrence of native terrestrial reptile and small mammal species in 59 sites located in remnant urban habitat fragments of Brisbane City were assessed against local‐level environmental characteristics of each site. Cluster analysis, multidimensional scaling ordination, and principal axis correlation were used to investigate relationships between species' occurrences and environmental characteristics. Native reptiles were most strongly associated with the presence of termite mounds, a high amount of fallen woody material, and a moderate amount of weed cover. Native small mammals were most strongly associated with the presence of grass trees (Xanthorrhoea spp.), and both reptiles and small mammals were negatively influenced by increased soil compaction. Significant floristic characteristics were considered to be important as structural, rather than compositional, habitat elements. Therefore, habitat structure, rather than vegetation composition, appears to be most important for determining native, terrestrial reptile and small mammal species assemblages in urban forest fragments. We discuss the management implications in relation to human disturbances and local‐level management of urban remnants.
Keywords: fallen wood, grass tree, soil compaction, termite mound, weeds
INTRODUCTION
Over the past 50 years, habitat loss and fragmentation have had the greatest influence on terrestrial ecosystems and biodiversity worldwide (Sala et al. 2000;Millennium Ecosystem Assessment 2005). Agricultural land use has previously been regarded as the primary cause of habitat loss and fragmentation, yet as areas of suitable arable land are exhausted, agricultural expansion is declining (Millennium Ecosystem Assessment 2005). Comparatively, urban development is expanding rapidly, encroaching on agricultural and natural, non‐arable, landscapes (Levia & Page 2000; Lugo 2002). It therefore seems likely that urban development will surpass agricultural land use as the primary anthropogenic driver of land use change and habitat loss and fragmentation.
Areas deemed suitable for urban development often coincide with those areas that also support high native species richness and endemism (Lugo 2002). The impacts of urbanization on fauna populations are multicausal and multiscaled, altering the in situ structure and composition of habitat fragments, as well as their spatial patterning within the landscape context. These habitat modifications potentially have important consequences for concomitant fauna assemblages, with significant differences being apparent between urban and preurban assemblages (Jones & Wieneke 2000; van der Ree 2004; Tait et al. 2005). Within the urban matrix, introduced species and a handful of native generalist species tend to dominate, while habitat and dietary specialists and migratory species tend to decline in numbers or become locally extinct (How & Dell 1993, 2000; White & Burgin 2004; Tait et al. 2005).
This problem is particularly pertinent to Australia, where more than 92% of the human population currently resides in urban areas (United Nations 2005). For native fauna assemblages, native terrestrial reptile and small mammal species are considered to be the fauna groups most sensitive to urbanization and its associated disturbances (How & Dell 1993, 1994, 2000; van der Ree 2004; White & Burgin 2004; Tait et al. 2005). Although many native mammals and reptiles are negatively influenced by urban development, some native mammal and reptile species, such as the common brush‐tail possum (Trichosurus vulpecula), blue‐tongue lizard (Tiliqua scincoides), and fence skink (Cryptoblepharus virgatus) may adapt, and even thrive, within the built environment (Koenig et al. 2002;Matthews et al. 2004; Garden et al. 2006). In contrast, urban‐sensitive species (e.g. dunnarts, Sminthopsis spp., antechinus, Antechinus spp., geckos, and large reptiles) face significant dispersal, predator avoidance and, resource adaptation challenges within the human‐dominated urban matrix. Consequently, these urban‐sensitive species are restricted to the often isolated, remnant native vegetation patches that occur within the urban matrix or in the fringing peri‐urban landscapes (How & Dell 1993, 1994; Tait et al. 2005; Garden et al. 2006).
Effective conservation in urban remnants requires scientific knowledge underpinning management decisions and on‐ground actions. Much of the current available scientific knowledge is based on non‐urban ecological research (Garden et al. 2006). In non‐urban environments there is a strong global consensus that, regardless of the disturbance pressure, many native reptile and small mammal species depend more on structurally complex habitats, than compositionally diverse floristics (e.g. Bennett 1993; Southgate et al. 1996; Flemming & Loveridge 2003; Lenders & Daamen 2004; Spencer et al. 2005; Kanowski et al. 2006). Similar findings have also been reported for native species within Australian urban landscapes (e.g. Dufty 1994; Jellinek et al. 2004; White & Burgin 2004). Although, Fischer et al. (2003) and Jellinek et al. (2004) found that vegetation composition, in addition to structure, was important for reptile species in grazed and urban affected habitats. In contrast, Wilson et al. (1986) reported that within coastal heathlands of Victoria, several native rodent and dasyurid species displayed no floristic or vegetation structural preferences.
Such discrepancies in research findings, coupled with the distinct lack of urban‐based ecological research (Garden et al. 2006), limit our ability to make generalizations about the habitat requirements of urban reptiles and small mammals, and hence management recommendations. This limitation is further compounded by differences in the type, rate and intensity of disturbances within urban landscapes compared with non‐urban landscapes. A further complication is the large variation in habitat requirements among species (e.g. Jellinek et al. 2004; Monamy & Fox 2005), but also within species according to age. For example, although Fischer et al. (2003) found that four‐fingered skinks (Carlia tetradactyla) responded to habitat structure and composition in grazing‐affected landscapes, they also found that the relative importance of different attributes varied between juveniles and adults. Consequently, Australian urban conservation managers face significant uncertainty regarding the most appropriate management strategies for achieving long‐term conservation outcomes for a diversity of native fauna species.
If native fauna diversity is to be conserved in the face of rapid urban expansion, it is vital that we understand the habitat requirements and sensitivities of species living within urban remnants. This requires understanding how both species' composition and species' richness are influenced by local‐level habitat factors. However, local‐level habitat management is often focused on maintaining overall species' diversity within the landscape by managing habitat patches so that current concomitant assemblages of native fauna are conserved before they become locally extinct, thereby avoiding the need for expensive reintroduction programs. Conserving native fauna in urban landscapes first requires understanding what local or in situ factors are important for maintaining diverse assemblages of native fauna. This knowledge may then by used to inform urban conservation managers and planners about priority habitat management decisions and activities so that native fauna occupying urban habitat fragments are adequately conserved. This was the focus of our study.
This paper investigated correlations between the composition of native terrestrial reptile and small mammal fauna within urban habitat fragments and local‐level (<1 ha) habitat factors such as habitat structure, vegetation composition, fire and human disturbances. These habitat factors were considered ecologically important for the target species and also can be manipulated and managed by conservation managers. Investigations were based in urban habitat fragments located within the Brisbane City Council (BCC) local government area, where local government is responsible for setting within‐patch management priorities and actions. We applied cluster analysis, multidimensional scaling and principal axis correlation to identify significant habitat attributes and examine their importance for reptile and small mammal assemblages. Mammal and reptile assemblages were analysed separately. Based on our findings, we discuss the implications for conservation management within Brisbane City.
METHODS
Study area
The study focused on Queensland's capital city, Brisbane (153°2′S, 27°E; area 1220 km2, population approximately 1 million) (Fig. 1). Brisbane has a subtropical climate and is Australia's third largest and most rapidly growing capital city (Commonwealth of Australia 2003). As European settlement in the early 1800s approximately two‐thirds of the original woody vegetation has been cleared for agricultural, industrial and/or urban development purposes (Brisbane City Council 2001). More than 80% of this clearing was of lowland forests (<100 m from sea level) resulting in the current, highly fragmented and isolated lowland remnant vegetation patches that vary in their internal condition and disturbance and management histories (Catterall & Kingston 1993; Brisbane City Council 2001). Of the remaining 33% remnant vegetation cover, about 20% is protected for conservation purposes, yet much of this area is concentrated in contiguous forest on the city's outskirts, particularly in the D'Aguilar ranges to the west (Brisbane City Council 2001).
Figure 1.

(a) Location of Brisbane City Council (BCC) local government area (LGA) on Queensland's south‐east coast. (b) Map of BCC LGA showing the location of the survey areas in relation to the CBD. Remnant vegetation and major roads are also shown (Source data provided by Brisbane City Council).
Contemporary urban growth has concentrated along major transport networks to the north, south and south‐west, with coastal wetlands and Moreton Bay to the east and mountain ranges to the west constraining urban expansion in these directions. Accordingly, the highest concentration of urban development pressure currently occurs in the lowland outer suburbs to Brisbane's south and south‐east (Brisbane City Council 2001). Despite recent rapid urban expansion and subsequent habitat destruction and modification, Brisbane still supports high floristic and faunal diversity and endemism, boasting the highest diversity of native vertebrate species of any of Australia's capital cities (Queensland Museum 1995). However, in the face of rapid urbanization, the continued persistence of this species' diversity is uncertain. Our study focused on lowland remnant habitat fragments situated within 10–20 km of Brisbane's central business district, in the southern (Karawatha) and south‐eastern (Burbank) suburbs (Fig. 1).
Site selection
We selected 59 sites located within Regional Ecosystem (RE) type 12.9–10.4, which is dominated by scribbly gum (Eucalyptus racemosa) woodland located on sedimentary rocks and sandy soils (Young & Dillewaard 1999). Although classified as ‘not of concern’ by the Queensland Environmental Protection Agency (Queensland Environmental Protection Agency 2004), this RE is extensively cleared and fragmented within Brisbane City (Young & Dillewaard 1999). BCC spatial data and satellite imagery were used to select sites located on private and council owned land. Potential site locations were ground‐truthed to assess their suitability. Site locations were considered unsuitable if they were: (i) difficult to access; (ii) had been largely cleared or disturbed; (iii) patches were too small to fit a survey site; or, (iv) had a high likelihood of human interference to fauna survey equipment.
Site design
Survey sites measured 45 m × 20 m and consisted of three parallel transects 10 m apart, along which fauna traps were placed and habitat assessments were conducted. Where possible, sites were positioned perpendicular to the landscape slope and a minimum of 10 m from patch edges. This distance was selected to concentrate on interior rather than edge and matrix habitats. Sites were also located at least 20 m from designated walking tracks and recreational areas.
Wildlife surveys
Wildlife surveys were conducted over three consecutive nights, during fine weather conditions in the spring and summer of 2004 and 2005. Initial surveys (2004) were conducted at all 59 sites, yet repeat surveys (2005) occurred at only 51 sites, as nine sites were abandoned owing to recent fire or substantial human interference. Native reptile and small mammal species were identified at each site using a combination of live‐trapping, direct observation and trace survey methods, to maximize the probability of detecting the range of target species. Each site was surveyed using: eight cage traps, 10 Elliott traps (two sizes: 80 × 85 × 220 mm; 80 × 100 × 320 mm), five dry pitfall traps (10 L buckets) and three hair funnels. Opportunistic species identifications from scats, visual observations and vocalizations were also recorded.
Cage traps, Elliott traps and hair funnels were baited with the standard Australian native small mammal bait mixture (Menkhorst & Knight 2001). Pitfall traps were unbaited. The dense vegetation and fallen woody debris at several sites prevented the use of drift‐fences, which have previously been used with pitfall traps to improve capture success (e.g. Mengak & Guynn 1987; Crosswhite et al. 1999; Menkhorst & Knight 2001). Cage and Elliott traps were set and baited each afternoon, checked for captures each morning and closed during the day. Pitfall traps remained open for the entire trap cycle (3 days and nights) and were checked for captures each morning and afternoon. Hair funnels were set at the beginning of a trap cycle and left undisturbed until collection at the end of the trap cycle. Scat collection, direct observations and vocalization records occurred opportunistically throughout each site visit. At the point of capture, animals were identified to species‐level using a relevant field guide (Menkhorst & Knight 2001; Wilson 2005), photographed, weighed, sexed (if possible) and immediately released. Scat and hair samples were identified ex situ by one of two independent experts (initial surveys analysed by Michiala Bowen; repeat survey samples analysed by Barbara Triggs 1996).
Habitat surveys
Habitat assessments were conducted at all sites between the initial and repeat wildlife survey periods. Twenty‐three habitat variables (Table 1) were measured at each site, following a protocol similar to that detailed by Eyre et al. (2000). The number of large trees (d.b.h. ≥ 40 cm) within the site perimeter was visually counted from the centre of each site, and the total basal area was recorded using the Bitterlich variable radius method (sensu Mueller‐Dombois & Ellenberg 1974). A visual appraisal of the total number of termite mounds, approximate weed cover and, the presence or absence of fire (e.g. tree scars, charcoal, ash) and human disturbances (e.g. litter, garden waste, sawn logs) were recorded over the duration of each site assessment.
Table 1.
Habitat variables recorded at each site. Records for each variable are averaged/totalled/calculated to produce a measurement across each site
| Variable | Description | Measurement | ||
|---|---|---|---|---|
| Where | What | How | ||
| Acacia | Number of Acacia | 1 m either side of each transect | Total count | Visual |
| Allocasuarina | Number of Allocasuarina | 1 m either side of each transect | Total count | Visual |
| Banksia | Number of Banksia | 1 m either side of each transect | Total count | Visual |
| Bracken fern | Number of Bracken ferns | 1 m either side of each transect | Total count | Visual |
| Callistemon | Number of Callistemon | 1 m either side of each transect | Total count | Visual |
| Canopy cover | Amount of canopy cover (average of 30 readings) | Presence/absence reading taken every 5 m along each transect | Per cent cover | Gimballed Sighting Tube |
| Fire | Presence/absence of fire | Overall appraisal across site | Category | Visual |
| Ground cover complexity | Number of different types of ground cover (e.g. rocks, wood, coarse leaf litter) | 1 m2 quadrat centred over transect, every 5 m | Total count | Visual |
| Ground cover † coverage | Proportion of ground covered (i.e. not bare ground) | 1 m2 quadrat centred over transect, every 5 m | Per cent cover | Visual |
| Ground cover depth | Depth (up to 40 cm) of ground cover (average of 180 measurements) | 1 m2 quadrat centred over transect, every 5 m (6 measurements) | Average count | Standard 40 cm ruler |
| Grass tree | Number of Xanthorrhoea | 1 m either side of each transect | Total count | Visual |
| Hollows | Number of pieces of fallen woody material with hollows | 1 m either side of each transect | Total count | Visual |
| Human disturbance | Presence/absence of human disturbance (e.g. litter, sawn wood) | Overall appraisal across site | Category | Visual |
| Large trees | Number of large trees (d.b.h. ≥ 40 cm) | Sighted from centre of site | Total count | Visual & tape measure |
| Mid‐storey cover | Amount of mid‐storey cover (average of 30 readings) | Every 5 m along each transect | Per cent cover | Gimballed Sighting Tube |
| Paperbark | Number of Melaleuca | 1 m either side of each transect | Total count | Visual |
| Soil compaction | Number of ‘hits’ (up to 20) (average of 180 measurements) | 1 m2 quadrat centred over transect, every 5 m (6 measurements) | Average count | Soil pen |
| Total basal area | Number of tree trunks >1 cm gap when viewed at eye level, 60 cm from face | Sighted from centre of site | Total count (stems per m2) | Bitterlich gauge |
| Termite mounds | Number of terrestrial termite mounds | Overall appraisal across site | Total count | Visual |
| Understorey cover | Amount of understorey cover (average of 30 readings) | Presence/absence reading every 5 m along each transect | Per cent cover | Visual |
| Understorey density (total) | Total number of cells obscured by vegetation when a gridded canvas is viewed at waist height from a 5 m distance | Every 5 m along each transect | Average count | 1 m2 canvas (gridded into 1 cm2 cells) |
| Understorey † density (maximum) | Height of highest cell obscured by vegetation when a gridded canvas is viewed at waist height from a 5 m distance | Every 5 m along each transect | Average count | 1 m2 canvas (gridded into 1 cm2 cells) |
| Understorey † density (maximum 50%) | Highest cell at least 50% obscured by vegetation when a gridded canvas is viewed at waist height from a 5 m distance | Every 5 m along each transect | Average count | 1 m2 canvas (gridded into 1 cm2 cells) |
| Weed cover | Approximate proportion of site covered by weeds (0%, 25–50%, 50–75%, >75%) | Overall appraisal across site | Per cent cover | Visual |
| Wood Volume | Number, size & state of decay of fallen woody material | 1 m either side of each transect | Average volume (m3) | Visual and calculated |
indicates variables not included in statistical analyses.
The remaining 17 habitat variables were measured along each of the three transects and the measurements either totalled or averaged for the whole site. The total number of Acacia spp., Allocasuarina spp., Banksia spp., Pteridium esculentum, Callistemon spp., Xanthorrhoea spp., and Melaleuca spp. within 1 m of the transect lines were recorded. Similarly, all fallen woody material within 1 m of each transect line was tallied and categorized into five diameter classes (<10 cm, 10–20 cm, 20–30 cm, 30–40 cm, >40 cm), eight decay classes (recently felled, sound, bark peeling off, to 25% decay, 25–50% decay, 50–75% decay, >75% decay, debris), and three complexity classes (simple, complex, stump). These records were later used to calculate the relative volume (m3) of fallen woody material for each site. The total number of pieces of fallen wood that contained hollows was also recorded.
The presence of canopy, mid‐storey, and understorey cover was recorded every 5 m along each transect using a gimballed sighting tube. Understorey density was also measured every 5 m using an adaptation of methods described by MacArthur and MacArthur (1961) and Haering and Fox (1995). This involved a 1 m2 screen, divided into 10 cm2 grid cells, viewed at waist height from a 2‐m distance. Three understorey measurements were recorded: (i) the total number of grid cells obscured by vegetation; (ii) the highest grid row obscured by vegetation (0 cm−100 cm); and (iii) the highest grid row with at least one grid cell ≥50% obscured by vegetation. These six stratum records were later averaged to provide measures of average per cent cover for each stratum and average understorey density at each site.
The per cent of ground cover, number of ground cover types (e.g. coarse leaf litter, Casuarina needles, rocks, herbs), ground cover depth, and soil compaction were recorded every 5 m within a 1 × 1 m quadrat along each transect. Per cent and types of ground cover were assessed visually. A 40‐cm ruler was used to record ground cover depth. Soil compaction was measured using a penetrometer (e.g. Fox et al. 1996) and counting the number of hits taken (up to 20 hits) to drive a weighted probe 20 mm into the soil. For both ground cover depth and soil compaction, six measurements were made every 5 m. The records of per cent ground cover, ground cover depth and soil compaction were later averaged for each site.
Statistical analysis
Analyses were based on the species detected and habitat variables recorded at each site. Total species occurrence data were derived by combining the species detected from each wildlife survey method and during both survey periods. The overall species' occurrence data were divided into two separate data sets: (i) native reptile species; and (ii) native mammal species. Exotic species were not included in the data analysis.
Continuous habitat variables were initially compared using the Spearman rank correlation test in R version 2.1.0 (The The R Development Core Team 2004). A correlation coefficient >0.7 was chosen to identify highly correlated habitat variables. Where variables were highly correlated, one variable was removed from the data set. The remaining variables were used for subsequent statistical analyses.
We applied a multivariate statistical approach using PATN Version 3.0.3 for Windows (Belbin 1994) to examine the relationships between species' occurrence and site habitat characteristics. Similarities between sites in terms of species' composition were first investigated using the Bray & Curtis index (Bray & Curtis 1957). Clusters were derived from the data set using the flexible unweighted pair group using arithmetic averaging method (upgma) with a beta (β) value of −0.1. The upgma clustering method is considered superior as it considers more than one species at any fusion (Wardell‐Johnson & Williams 1996; Podani & Schmera 2006). At a beta value of −0.1, the upgma clustering method is space‐dilating (cf. space‐contracting), thereby creating even‐sized groups and preventing the formation of a single large group (Belbin 1993; Wardell‐Johnson & Williams 1996). We examined the acceptability of the resulting site groups and patterns using semi‐strong hybrid multidimensional scaling ordination. The ordination was considered in conjunction with the minimum spanning tree (MST) and dendogram. The MST represents pairwise associations between group objects. Its use is complementary to ordination and may be used practically to confirm or deny close relationships or identify trends in the data (Belbin 1993). The dendogram schematically displays the hierarchical clustering of groups. The number of site groups was adjusted until maximum congruence was obtained between the ordination, MST and dendogram, thereby indicating that the most robust site groupings had been attained.
Relationships between the intrinsic species occurrence and the ordination groups were examined using Principal Component Correlation (PCC) with 100 permutations. PCC uses multiple linear regression to fit selected variables to the ordination space, showing the direction of best fit and the correlation with that direction (r 2) (Belbin 1994). Monte‐Carlo Attributes in Ordination (MCAO) procedure with 100 iterations was then used to test the reliability of these correlations with the ordination space by calculating the proportion of r 2 values that exceed the true r 2 in a given number of iterations (Belbin 1994). An MCAO value less than 5% was considered significant. Variables identified as having significant correlations with the species groups were then overlaid on the ordination space. This analysis procedure was repeated to investigate relationships between the extrinsic habitat variables and the ordination groups.
Species and habitat variables that were found to be highly correlated with the ordination were examined further using the Kruskal–Wallis statistic function in PATN to determine how well each variable discriminated between the ordination groups. The larger the Kruskal–Wallis statistic for a variable, the more significant that variable's contribution was to the differentiation of ordination groups. Significant variables according to the Kruskal–Wallis statistic (P < 0.05) were compared with MCAO values in order to test the strength of the relationships. We recognize, however, that the reliability of the Kruskal–Wallis statistic is proportional to the number of objects in the smallest group (Belbin 1993). As such, the Kruskal–Wallis statistic results are included, based on expert advice, as a comparative value to investigate the strength of MCAO results, but these values should be treated with caution.
RESULTS
Fauna species assemblages
A total of 27 native species (eight mammals, nineteen reptiles) were identified from 333 trap nights (Table 2). An additional native mammal (Melomys sp.) was identified at two sites from scat and hair samples, but positive identification to the species level was not possible. Instead, the genus was included in the analysis of the mammal data set. In total, these represented 11 native family groups.
Table 2.
Cumulative species list from wildlife surveys. Species are categorized as native/exotic mammals/reptiles and are listed alphabetically by family group and scientific name
| Family group | Scientific name | Common name | Sites | |
|---|---|---|---|---|
| Native mammals | Dasyuridae | Antechinus flavipes | Yellow‐footed antechinus | 4 |
| Antechinus stuartii | Brown antechinus | 2 | ||
| Planigale maculata | Common planigale | 2 | ||
| Sminthopsis murina | Common dunnart | 8 | ||
| Muridae | Melomys spp. | Unknown species | 2 | |
| Rattus fuscipes | Bush rat | 2 | ||
| Rattus lutreolus | Swamp rat | 1 | ||
| Peramelidae | Isoodon macrourus | Northern brown bandicoot | 8 | |
| Perameles nasuta | Long‐nosed bandicoot | 2 | ||
| Native reptiles | Agamidae | Diporiphora australis | Tommy round‐head | 3 |
| Physignathus lesuerii | Eastern water dragon | 1 | ||
| Pogona barbata | Bearded dragon | 3 | ||
| Colubridae | Dendrelaphis punctulata | Common tree snake | 1 | |
| Elapidae | Pseudechis porphyriacus | Red‐bellied black snake | 1 | |
| Gekkonidae | Diplodactylus vittatus | Eastern stone gecko | 5 | |
| Pygopodidae | Lialis burtonis | Burton's snake‐lizard | 1 | |
| Pythonidae | Morelia spilota | Carpet python | 1 | |
| Scincidae | Anamalopus verreauxii | Verreaux's skink | 1 | |
| Calyptotis scutirostrum | Scute‐snouted calyptotis skink | 8 | ||
| Carlia foliorum | Tree‐base litter‐skink | 5 | ||
| Carlia pectoralis | Open‐litter rainbow skink | 4 | ||
| Carlia vivax | Storr's rainbow skink | 7 | ||
| Cryptoblepharus virgatus | Fence skink | 27 | ||
| Ctenotus taeniolatus | Copper‐tailed skink | 1 | ||
| Eulamprus quoyii | Eastern water skink | 1 | ||
| Lampropholis amicula | Secretive skink | 4 | ||
| Lampropholis delicata | Garden skink | 29 | ||
| Varanidae | Varanus varius | Lace monitor | 3 | |
| Exotic mammals | Canidae | Vulpes vulpes | Fox | 3 |
| Leporidae | Lepus capensis | Brown hare | 8 | |
| Oryctolagus cuniculus | European rabbit | 3 | ||
| Muridae | Mus musculus | House mouse | 9 | |
| Rattus rattus | Black rat | 30 | ||
| Exotic reptiles | Gekkonidae | Hemidactylus frenatus | Asian house gecko | 1 |
Each species' common name and the total number of sites at which they were detected are also shown.
The most common mammal species was the common brushtail possum identified in 39 of the 59 sites (66%). However, it was considered a predominantly arboreal species (How & Kerle 1995) and was not included in further analysis. The common dunnart (Sminthopsis murina) and the northern brown bandicoot (Isoodon macrourus) were the most commonly detected terrestrial mammal species (n = 8 sites each). Detections of the common planigale (Planigale maculata), common dunnart, and the yellow‐footed antechinus (Antechinus flavipes) were of particular interest as these dasyurids are relatively uncommon in Brisbane's lowland habitats and are classified as significant species within the local government area (Brisbane City Council 2000). The fence skink (C. virgatus) and garden skink (Lampropholis delicata) were the two most common reptile species (n = 27 and n = 29 sites, respectively). Larger‐bodied and more cryptic reptile species such as snakes, lace monitors (Varanus varius), and dragons (e.g. bearded dragon, Pogona barbata, and eastern water dragon, Physignathus lesuerii) were identified at significantly fewer sites than small‐bodied skink species (Table 2).
Habitat variables co‐linearity
Correlation analysis revealed the three measures of understorey density were strongly correlated (>0.7). We eliminated two variables and retained total understorey density. Although not highly correlated with other variables, average ground cover was also removed from the data set as it showed very little variation between sites with 51 sites having an average cover >90%.
Reptile groups and habitat associations
For reptiles, four groups of sites (Fig. 2a) yielded the lowest ordination stress level (stress = 0.183) and maximum congruence between the ordination, MST and dendogram. The two most commonly captured reptile species, C. virgatus and L. delicata, dominated Group 1 sites (n = 24), being identified at 92% and 67% of sites, respectively (Fig. 3a). This indicates a high degree of overlap in the distribution of these species within Group 1. However, these skink species showed little or no overlap in the 12 and 13 sites that, respectively, comprised Groups 2 and 3. Group 2 sites were characterized by the ubiquitous presence of L. delicata (detected in all sites) and the absence of C. virgatus (Fig. 3a). The presence of C. virgatus rather than L. delicata dominated Group 3 (38% and 8%, respectively) (Fig. 3a). Species' richness also varied between groups, with Group 3 containing the highest overall native species richness (12 species), more than 40% greater species richness than Group 2 (Fig. 3a). Group 4 represented the fewest sites (n = 10) and was characterized by a total absence of native reptile species.
Figure 2.

Semi‐strong hybrid multidimensional scaling ordinations for reptiles (a–c) (stress = 0.1832) and mammals (d–f) (stress = 0.1283). (a,d) show cluster ordination of sites according to similarities in species composition; (b,e) show significant species overlaid; (c,f) show significant explanatory habitat variables overlaid. Group centroids only are shown in (b,c,e,f). For all ordinations: (□) Group 1; (○) Group 2; (▴) Group 3; ( ) Group 4 (reptiles only).
Figure 3.
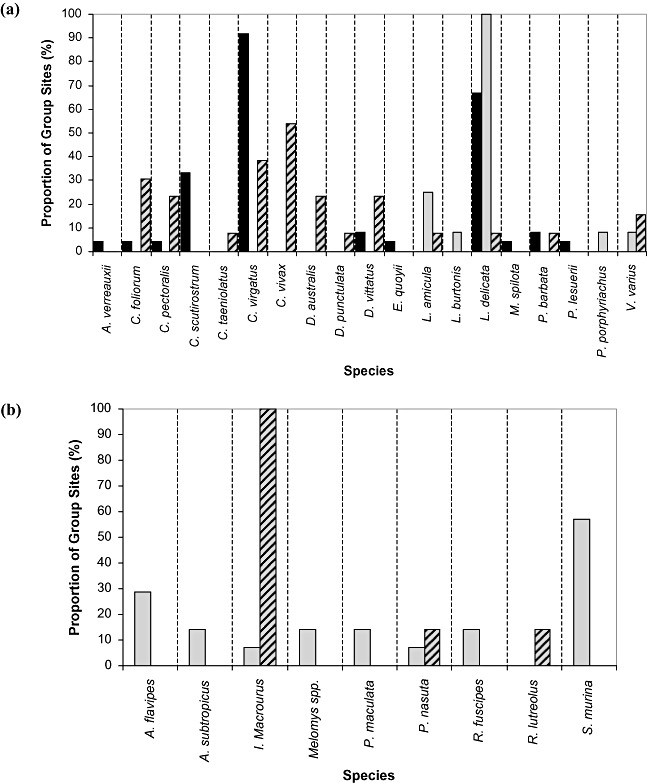
Relative species compositions for each of the reptile and mammal site Groups, showing the proportion of sites within each Group at which species were detected. (a) Reptile species' compositions for Groups 1–3; Group 4 not shown as no native reptile species were detected at sites within this group; (▪) Group 1 = 24 sites, ( ) Group 2 = 12 sites, (
 ) Group 3 = 13 sites, Group 4 = 10 sites. (b) Mammal species compositions for Groups 2 and 3; Group 1 not shown as no native mammal species were detected at sites within this group; (▪) Group 1 = 38 sites, (
 ) Group 2 = 14 sites, Group 3 = 7 sites.
MCAO reported eight native reptile species that were highly correlated with the ordination of reptile groups: Carlia foliorum, Carlia vivax, Cryptoblepharus virgatus, Dendrelaphis punctulata, Diporiphora australis, L. delicata, Carlia pectoralis, and V. varius (Fig. 2b). Of these species, the presence of C. virgatus, L. delicata, and C. vivax explained the largest amount of variation in the ordination (r 2 = 0.52, 0.67 and 0.35, respectively) and were highly significant at P < 0.001 (Table 3). C. foliorum, and D. australis were less significant (P < 0.05). Although C. pectoralis, D. punctulata, and V. varius were highly correlated with the ordination, these species were not found to be statistically significant (Table 3). The results further suggest that Calyptotis scutirostrum and Lampropholis amicula discriminate well between the groups (P < 0.01 and P < 0.05, respectively), yet MCAO indicated these species had a low correlation with the ordination groups (Table 3).
Table 3.
Relative associations between ordination groups and native reptile/mammal species and habitat variables
| Reptile species | PCC (r 2) | MCAO (%) | χ2 | Group | Mammal species | PCC (r 2) | MCAO (%) | χ2 | Group |
|---|---|---|---|---|---|---|---|---|---|
| A. verreauxii | 0.02 | 80 | n/s | 1 | A. flavipes | 0.3 | 1 | ** | 2 |
| C. foliorum | 0.03 | 0 | * | 3 | A. subtropicus | 0.3 | 1 | * | 2 |
| C. pectoralis | 0.19 | 1 | n/s | 3 | I. macrourus | 0.51 | 0 | *** | 3 |
| C. scutirostrum | 0.03 | 72 | ** | 1 | Melomys spp. | 0.2 | 3 | * | 2 |
| C. taeniolatus | 0.15 | 11 | n/s | 3 | P. maculata | 0.29 | 0 | * | 2 |
| C. virgatus | 0.52 | 0 | *** | 1 | P. nasuta | 0.21 | 4 | n/s | 3 |
| C. vivax | 0.35 | 0 | *** | 3 | R. fuscipes | 0.22 | 2 | * | 2 |
| D. australis | 0.32 | 0 | * | 3 | R. lutreolus | 0.17 | 4 | * | 3 |
| D. punctulata | 0.18 | 0 | n/s | 3 | S. murina | 0.18 | 2 | *** | 2 |
| D. vittatus | 0.16 | 9 | n/s | 3 | |||||
| E. quoyii | 0.04 | 54 | n/s | 1 | |||||
| L. amicula | 0.04 | 50 | * | 2 | |||||
| L. burtonis | 0.06 | 19 | n/s | 2 | |||||
| L. delicata | 0.67 | 0 | *** | 2 | |||||
| M. spilota | 0.04 | 46 | n/s | 1 | |||||
| P. barbata | 0.15 | 5 | n/s | 1 | |||||
| P. lesuerii | 0.01 | 90 | n/s | 1 | |||||
| P. porphyriacus | 0.04 | 53 | n/s | 2 | |||||
| V. varius | 0.15 | 1 | n/s | 3 |
| Habitat variable | PCC (r 2) | MCAO (%) | χ2 | Group | Habitat variable | PCC (r 2) | MCAO (%) | χ2 | Group |
|---|---|---|---|---|---|---|---|---|---|
| Acacia | 0.01 | 91 | n/s | 3 | Acacia | 0.03 | 66 | n/s | 1 |
| Allocasuarina | 0.07 | 31 | * | 1 | Allocasuarina | 0.01 | 95 | n/s | 3 |
| Banksia | 0.08 | 18 | n/s | 2 | Banksia | 0.08 | 15 | n/s | 3 |
| Bracken fern | 0.05 | 60 | n/s | 3 | Bracken fern | 0.05 | 35 | n/s | 1 |
| Callistemon | 0.04 | 50 | n/s | 1 | Callistemon | 0.1 | 29 | n/s | 3 |
| Canopy cover | 0.07 | 32 | n/s | 1 | Canopy cover | 0.03 | 65 | n/s | 2 |
| Fire | 0.01 | 95 | n/s | 4 | Fire | 0.04 | 54 | n/s | 3 |
| Ground cover complexity | 0.06 | 34 | * | 4 | Ground cover complexity | 0.03 | 60 | n/s | 3 |
| Ground cover depth | 0.02 | 82 | n/s | 2 | Ground cover depth | 0.05 | 40 | n/s | 1 |
| Human disturbance | 0.05 | 40 | * | 2 | Human disturbance | 0.06 | 36 | n/s | 3 |
| Hollows | 0.03 | 66 | n/s | 3 | Hollows | 0.03 | 65 | n/s | 3 |
| Large trees | 0.05 | 44 | n/s | 3 | Large trees | 0.04 | 47 | n/s | 2 |
| Melaleuca | 0.1 | 16 | n/s | 2 | Melaleuca | 0.13 | 10 | n/s | 3 |
| Mid‐storey cover | 0.07 | 22 | n/s | 2 | Mid‐storey cover | 0.02 | 76 | n/s | 3 |
| Soil compaction | 0.21 | 0 | * | 4 | Soil compaction | 0.17 | 4 | n/s | 3 |
| Total basal area | 0.03 | 62 | ** | 1 | Total basal area | 0.05 | 36 | n/s | 2 |
| Termite mounds | 0.14 | 4 | n/s | 3 | Termite mounds | 0.06 | 35 | n/s | 2 |
| Under‐storey cover | 0.02 | 71 | * | 3 | Under‐storey cover | 0.02 | 72 | n/s | 2 |
| Under‐storey density | 0.03 | 71 | n/s | 3 | Under‐storey density | 0.04 | 48 | n/s | 3 |
| Weed cover (0%) | 0.12 | 12 | ** | 3 | Weed cover (0%) | 0.03 | 77 | n/s | 2 |
| Weed cover (≤25%) | 0.08 | 17 | n/s | 4 | Weed cover (≤25%) | 0.02 | 84 | n/s | 3 |
| Weed cover (25–50%) | 0.15 | 3 | * | 2 | Weed cover (25–50%) | 0.1 | 9 | n/s | 3 |
| Weed cover (50–75%) | 0.06 | 23 | n/s | 4 | Weed cover (50–75%) | 0.01 | 63 | n/s | 1 |
| Wood volume | 0.15 | 2 | n/s | 3 | Wood volume | 0.1 | 13 | n/s | 2 |
| Xanthorrhoea spp. | 0.03 | 56 | n/s | 1 | Xanthorrhoea spp. | 0.21 | 2 | n/s | 2 |
PCC (r 2), MCAO (%) and chi‐squared (derived from KW statistic) are shown. Significant MCAO variables and values are indicated in bold font. Chi‐squared significance is indicated by: *0.05 > P > 0.01; **0.01 > P > 0.001; ***P < 0.001; n/s, not significant. The ordination Group with which each species and habitat variable was most highly correlated is also shown.
Four habitat variables: soil compaction, total number of termite mounds, wood volume and weed cover (25–50%) were significantly correlated with reptile groups (Fig. 2c). Of these variables, only soil compaction and weed cover (25–50%) discriminated well between the groups according to the Kruskal–Wallis statistic (Table 3).
Mammal groups and habitat associations
Three statistical groups of native mammal species (Fig. 2d) produced the best ordination fit (stress = 0.1283) and maximum congruence between the ordination, MST and dendogram. Group 1 was comprised of the 38 sites at which no native mammals species were detected, indicating that native mammal species were undetected at the majority of the 59 sites. Comparatively, Groups 2 and 3 were dominated by the Dasyuridae and Peramelidae families, respectively. Native rodent species (Family: Muridae) were represented in Group 2 and Group 3 (Fig. 3b). All native mammal species were correlated with the ordination (Fig. 2e) and, with the exception of northern brown bandicoots, explained between 17% and 30% of the group variation (Table 3). Northern brown bandicoots explained more than 50% of the group variation (r 2 = 0.505), being found at all sites comprising Group 3 (Fig. 3b). The statistical significance of all but one species (long‐nosed bandicoot, Perameles nasuta) was supported by the Kruskal–Wallis statistic (Table 3). Both northern brown bandicoots and common dunnarts had the highest discrimination between groups (P < 0.001).
The number of grass trees (Xanthorrhoea spp.) and soil compaction were the only habitat variables that were significantly correlated with the mammal ordination (Fig. 2f). However, the associated Kruskal–Wallis values indicated that neither of these variables discriminated well between the groups (Table 3).
DISCUSSION
This study considered a range of local‐level environmental factors and their correlation with native terrestrial reptile and small mammal species' compositions within fragmented urban bushland habitats. Our results initially appear to imply that both vegetation composition (weed cover and grass trees) and habitat structure (termite mounds, wood volume and soil compaction) are important for native reptile and small mammal species. However, when previous research and species' behaviours and life history traits are examined, it seems likely that species in this study were responding to the structural role fulfilled by weed cover and grass trees rather than the compositional or floristic role. Therefore, we conclude that at the local‐level, habitat structural complexity is more important than vegetation composition for the occurrence of terrestrial, native reptile and small mammal species in Brisbane's lowland remnant habitat fragments.
This overall result is consistent with several other studies of various fauna species (including birds, reptiles and mammals) living within natural and disturbed (non‐urban) habitats (e.g. Grover & Slater 1994;Catterall et al. 1998; Scott et al. 1999; Webb & Shine 2000; Tait et al. 2005; Vesk & MacNally 2006). Many of these and similar studies indicate distinct species‐specific responses to particular habitat attributes, yet it was not possible in our study to identify species‐specific relationships because of the low detection rate of many species in several sites. The low detection of several species may potentially be explained by localized species' declines owing to urbanization and its associated disturbances and/or, owing to the cryptic nature of habitat use, dietary preferences and seasonal population fluctuations resulting in a high degree of false‐absences. Additional surveys conducted over a longer time period are likely to have improved detection rates, added certainty to our results and, provided more information on the habitat preferences of individual species. However, such long‐term surveys were not possible in this study owing to time and resource constraints. Consequently, our analysis focused on the influence of habitat characteristics on native reptile and small mammal species' compositions rather than individual species' occurrences.
Reptiles
Reptile captures were dominated by two main species, L. delicata and C. virgatus. Both species are also found throughout the urban matrix, although C. virgatus apparently more so than L. delicata (J. Garden, pers. obs. 2003–2006). The recorded dominance of these species during fauna surveys played a significant role in determining the subsequent reptile groups in the PATN analysis, indicating that these skink species may influence the composition of skink assemblages within urban patches. Similar reptile inter‐species interactions were reported by Fischer et al. (2003) who found that C. tetradactyla more frequently inhabited sites occupied by at least two other small reptile species. The possibility of inter‐species interactions between other small reptile species and L. delicata and/or C. virgatus is a hypothesis that warrants further investigation in order to clearly delineate existing relationships and examine the influence of inter‐species interactions relative to habitat suitability.
Termite mounds and fallen woody material
The significance of termite mounds and fallen woody material is likely explained by the habitat and resource requirements of reptiles. Reptiles are ectothermic and so are dependent on habitat attributes that enable them to regulate their body temperature to achieve optimal performance, which is essential for foraging, breeding and predator‐avoidance behaviours (Huey 1991; Bauwens et al. 1996; Vitt et al. 1998; Burrow et al. 2001; Singh et al. 2002; Lenders & Daamen 2004). Termite mounds and fallen woody material both provide suitable basking locations, habitats for prey species and, numerous nesting and refuge niches. It is not surprising therefore that these structural attributes were most strongly associated with sites dominated by the presence of sun‐loving reptile species such as C. vivax, Ctenotus taeniolatus and, D. australis (Group 3).
The association of reptiles with termite mounds is consistent with previous studies, both in Australia and elsewhere. For example, a lizard species (Metroles cuneirostris) from the Namib Desert of coastal Namibia, was found to commonly utilize newly formed termite mounds as foraging locations (Murray & Schramm 1987). The use and importance of termite mounds as refuge locations has also been reported for different reptile species, such as inactive monitors (Varanus bengalensis) in Sri Lanka (Wikramanayake & Dryden 1993) and frillneck lizards (Chlamydosaurus kingii) in Australia's Northern Territory (Griffiths & Christian 1996). Griffiths and Christian (1996) particularly demonstrated the importance of termite mounds as refuges by showing that C. kingii individuals who utilized termite mounds to avoid high intensity fires had a 100% survival rate, compared with the increased mortality and injury of individuals that sought refuge in tree canopies.
As supported by previous research, the significance of fallen woody material is likely to provide similar resources as termite mounds for a suite of small‐bodied, reptile species (e.g. Smith et al. 1996; Fischer et al. 2004; Jellinek et al. 2004). Other ground‐level structural attributes, such as ground cover/leaf litter (e.g. Burrow et al. 2001; Singh et al. 2002) and bush‐rocks (e.g. Schlesinger & Shine 1994; Webb & Shine 2000; White & Burgin 2004) have also been reported to provide suitable basking, shelter and foraging opportunities for various native terrestrial reptile species (e.g. snakes, skinks, agamids and geckos). These structures are naturally occurring yet, in degraded urban remnants, human‐introduced materials such as discarded metal and wood, and even old car bodies may work equally well (J. Garden, pers. obs. 2005).
Weed cover
The occurrence of native reptiles was positively associated with a moderate amount of weed cover (25–50%). Weediness was particularly associated with Group 2 which was characterized by comparatively ‘secretive’ reptile species such as L. delicata, L. amicula and Burton's snake‐lizard (Lialis burtonis). Although all species require habitats that facilitate thermoregulation, Group 2 species appear to tolerate of a moderate amount of certain habitat disturbances (as indicated by weediness), so long as adequate vegetation cover is available either to facilitate thermoregulation or to provide rapid refuge from predators. This is consistent with Bragg et al. (2005) who found that L. delicata was more likely to inhabit forested areas, which had more leaf litter, ground and shrub cover than the adjoining open habitat of regenerating mine‐disturbed areas. Furthermore, in our study L. delicata, unlike C. virgatus, were more likely identified from pitfall captures than direct observations, a trend that is indicative of the more cryptic nature of L. delicata. Similar capture trends were noted by Singh et al. (2002) for L. delicata and C. virgatus surveyed in contiguous forest near Brisbane. L. burtonis and Pseudechis porphyriacus were also identified from direct observations as pitfall traps were not large enough to trap these larger‐bodied species. However, upon detection, these species were observed to actively seek refuge within relatively dense thickets of lower‐stratum vegetation.
The positive association therefore between the occurrence of certain reptile species and a moderate amount of weed cover is most likely owing to the shelter provided by low, weedy vegetation rather than the weed species' composition per se. These findings support those of Fischer et al. (2003) who noted that juvenile and some adult C. tetradactyla were found in moderate to highly weed‐infested habitats, concluding that these species are able to tolerate a certain degree of habitat disturbance and potentially benefit from the associated structural changes. Other researchers have similarly commented on the importance of lower‐stratum vegetation cover for supporting important reptile prey species and also for the safe shelter provided from predators while foraging and dispersing (e.g. Burrow et al. 2001; Fischer et al. 2003).
Although it appears that some reptile species respond positively to a certain degree of weed cover, Hadden and Westbrooke (1996) and Jellinek et al. (2004) reported that overall reptile species' richness was negatively associated with increased weediness. Our results provide some agreement with these previous findings. Moderate weed cover was most associated with Group 2 which, compared with Groups 1 and 3, also had the lowest overall native species richness. Further, the highest amount of weed cover (50–75%), although not significantly correlated with the ordination, appeared to be associated with Group 4 (no reptiles detected). Jellinek et al. (2004) discuss the possible influence of weediness and time since isolation, commenting on smaller and older remnants being more likely to be dominated by weeds than larger and younger remnants. This may potentially be critical for effectively managing reptile species' compositions investigated in the current study. As weed invasions are indicative of disturbed habitats, it seems likely that, as highlighted by Jellinek et al. (2004) and suggested by the current study's findings, certain reptile species are sensitive to habitat disturbances and so will respond negatively to even a low amount of weed cover. Conversely, some reptile species are able to tolerate a certain degree of habitat disturbance and may even benefit from the cover provided. It is therefore difficult to make generalizations of the importance of weeds for all reptiles.
Soil compaction
Increased soil compaction was characteristic of habitats in which few or no native reptile species were detected, with the hardest soils occurring at sites at which no native reptile species were detected (Group 4). There are two possible explanations for this finding. The first directly implicates soil compaction and considers its impact on species' behaviours, whereas the second considers indirect implications of soil compaction, its associated disturbances on vegetation structure, and the resulting influence on reptile species. Soil compaction was least associated with Group 1, indicating that reptiles in this group occur more frequently in habitats with soft soils. This is consistent with the two fossorial skink species identified, C. scutirostrum and Anomalopus verreauxii, which were found only at sites within this group. Owing to their burrowing behaviour, these species do no inhabit or persist in areas with hardened soils where burrowing is difficult.
Soil compaction also has a significant influence on vegetation growth and regenerative ability (Amrein et al. 2005; Bassett et al. 2005). Increased soil compaction is often a result and a consequence of decreased vegetation cover (e.g. Groves & Keller 1983; Hadden & Westbrooke 1996). This cyclic condition is intensified by external disturbances which directly compact the soil and destroy ground cover vegetation. Hence, habitats with compacted soils are also likely to be indicative of highly disturbed habitats. Inappropriate fire regimes (including arson fires) and aesthetic clearing which decrease vegetation cover and do not promote vegetation regeneration are likely to increase soil compaction and, in turn, make it more difficult for plant species to regenerate (Amrein et al. 2005). As a result, the habitat structure and soil condition degrades, negatively impacting on various reptile species dependent on structurally complex habitats. Similarly, off‐track trampling within urban bushland habitats compacts soil and destroys or degrades ground cover vegetation, making these habitats less suitable for reptiles.
Mammals
Mammal species were found to be influenced primarily by habitat structure rather than vegetation composition. This is consistent with previous studies (e.g. Bennett 1993; Haering & Fox 1995; Monjeau et al. 1998; Vernes 2003; Monamy & Fox 2005) which concluded that vegetation structure, rather than vegetation composition, was more important for small mammal occurrence, although species‐specific responses to various aspects of structure were evident. For instance, small‐bodied mammals, such as dasyurids, are likely to be more capable of moving rapidly through dense undergrowth, whereas large‐bodied mammals such as kangaroos are impeded by dense midstorey cover, but are less likely to be affected by dense understorey and ground cover. Comparatively, large areas of dense undergrowth may present a significant locomotor (and escape) obstacle for medium‐bodied mammals, such as bandicoots, and may also inhibit bipedal vigilance behaviours (Garden 2000). Vernes (2003) found that northern bettongs (Bettongia tropicana) avoided areas of dense ground cover, particularly dense cover within 0.5 m above ground, which approximates the height of an adult bettong. Keiper and Johnson (2004) similarly reported that short‐nosed bandicoots (Isoodon obesulus peninsulae) in north Queensland forests avoided habitats with a tall, dense grass understorey. Such a response is also likely to be true for bandicoots in urban landscapes and so these animals may actively select habitats that are structurally complex, yet are not vegetatively dense. Therefore, as suggested by previous bandicoot studies (e.g. Dufty 1994; Scott et al. 1999; Chambers & Dickman 2002), optimal habitats for Peramelidae are structurally complex and encapsulate a mosaic of open foraging areas and denser shelter sites that are not so dense as to impede locomotor ability.
Grass trees
Grass trees also appear to be an important factor for the occurrence of native mammal species. This finding supports previous studies that have identified grass trees as important structural elements for several Australian small terrestrial mammal species. Vernes and Pope (2001), for instance, found that prior to fires, almost half the number of B. tropicana nests were located in dense vegetation cover such as the skirts of grass trees. Spencer et al. (2005) similarly found that native bush rats (Rattus fuscipes) responded negatively to the decrease in grass tree cover following fires. Likewise, Lunney (1995) commented that ‘cover‐seeking’R. fuscipes prefer habitats with dense ground and understorey cover – a structural requirement that would be partially filled by the presence of grass trees in the understorey layer. Grass trees have also been documented as providing important nesting habitats for small dasyurid species such as the common dunnart (Fox 1995) and the yellow‐footed antechinus (Marchesan & Carthew 2004). Our results support these previous findings, in that the presence of grass trees was most strongly associated with Group 2, which was dominated by dasyurids and R. fuscipes.
Soil compaction
Soil compaction, as for reptiles, was also associated with mammal species occurrences. Like reptiles, mammal species also appear to avoid habitats with very hard soils and the reasons may be similar. First, certain mammal species such as some dasyurids may nest in terrestrial burrows (Woolley 1989; J. Garden, pers. obs. 2005) and harder soils would inhibit their ability to burrow. However, unlike the reptile results, certain mammal species appear to respond positively to compacted soils. Mammal Group 3 was most strongly associated with moderately compacted soils rather than very hard soils. This group was dominated by the Peramelidae (bandicoot species). Bandicoots are omnivorous and most commonly feed on subterranean invertebrate prey and plant structures such as roots and hypogeal fungi (Vernes 2003; Keiper & Johnson 2004), a behaviour that is obvious from the conical diggings left from foraging (Triggs 1996; J. Garden, pers. obs. 2005–2006). Their ability to obtain these food resources is possible owing to specialized strong claws on their forefeet which make them powerful diggers. This morphological trait may provide them with an advantage over other species in enabling them to penetrate into harder soils and therefore utilize habitats with increased soil compaction. However, if soils become too hard, vegetation cover decreases (Amrein et al. 2005), resulting in decreased soil moisture and microbial activity, and hence less food availability and increased energy output (for foraging). Structurally complex habitats are likely to occur where there is low to moderately compacted soils influencing vegetation floristics and cover. In addition, although bandicoots appear to prefer structurally open habitats for foraging, they have also been reported to require structurally dense habitats for diurnal shelter (e.g. Dufty 1994; Southgate et al. 1996; Chambers & Dickman 2002; Vernes 2003). Therefore, as soils harden and vegetation cover decreases, important food resources decrease as does critical vegetation cover. However, in the urban landscape, Dufty (1994) reported that the eastern‐barred bandicoot (Perameles gunii) used a range of natural and artificial structures as shelter sites, implying a certain degree of disturbance tolerance, including moderately compacted soils.
Management implications
Although it is important to understand the habitat requirements of individual fauna species, when the goal is conserving, restoring or increasing native fauna diversity, habitats must not be managed based on the requirements of a single species. This is often difficult owing to the variety of species‐specific responses and the cryptic nature of many native Australian terrestrial fauna. A potential way to address this challenge and facilitate effective management of habitats for multiple species is to construct ecological species profiles (Opdam et al. 2002). Such profiles enable various species to be categorized based on similarities in their habitat requirements and disturbance responses. The resulting ecological species profiles may then be used to guide habitat management decisions, such as priority areas, actions and funding allocation, and facilitate the long‐term conservation of multiple species. In addition, long‐term monitoring of remnant habitat fragments, and associated adaptive management strategies, is recommended in order to minimize inherent problems of short‐term studies such as false‐absence records and seasonal fluctuations in species diversity and abundance.
ACKNOWLEDGEMENTS
This research was a collaborative project between The University of Queensland and Brisbane City Council. Financial support was provided by Brisbane City Council and a UQ postgraduate research scholarship. Fauna surveys were conducted under UQ AEC permit, GSP/030/04/BCC/UQGS, and Queensland Government EPA scientific purposes permit, WISP01975204. We thank private and council land owners for kindly allowing access to their properties. Thanks also to the volunteers who helped establish survey sites and, to the project's two research assistants, Michelle Walton and Alison Howes. We gratefully acknowledge valuable statistical advice and comments provided by the UQ PATN‐users group, particularly Dr Grant Wardell‐Johnson, Dr Ben Lawson and Hussein Bashir. We thank the Editor for useful comments provided on the manuscript.
REFERENCES
- Amrein D., Rusterholz H. & Baur B. (2005) Disturbance of suburban Fagus forests by recreational activities: effects on soil characteristics, above‐ground vegetation and seed bank. Appl. Veg. Sci. 8, 175–82. [Google Scholar]
- Bassett I. E., Simcock R. C. & Mitchell N. D. (2005) Consequences of soil compaction for seedling establishment: implications for natural regeneration and restoration. Aust. Ecol. 30, 827–33. [Google Scholar]
- Bauwens D., Hertz P. E. & Castilla A. M. (1996) Thermoregulation in a lacertid lizard: the relative contributions of distinct behavioural mechanisms. Ecology 77, 1818–30. [Google Scholar]
- Belbin L. (1993) PATN Pattern Analysis Package: Technical Reference. CSIRO Division of Wildlife and Ecology, Canberra. [Google Scholar]
- Belbin L. (1994) PATN. Pattern Analysis Package. CSIRO Division of Wildlife and Ecology, Canberra. [Google Scholar]
- Bennett A. F. (1993) Microhabitat use by the long‐nosed potoroo, Potorous tridactylus, and other small mammals in remnant forest vegetation of south‐western Victoria. Wildl. Res. 20, 267–85. [Google Scholar]
- Bragg J. G., Taylor J. E. & Fox B. J. (2005) Distributions of lizard species across edges delimiting open‐forest and sand‐mined areas. Aust. Ecol. 30, 188–200. [Google Scholar]
- Bray J. R. & Curtis J. T. (1957) An ordination of the upland forest communities of southern Wisconsin. Ecol. Monogr. 27, 325–49. [Google Scholar]
- Brisbane City Council (2000) Brisbane City Plan 2000. Natural Assets Planning Scheme Policy (Vol. 2). Brisbane City Council, Brisbane. [Google Scholar]
- Brisbane City Council (2001) State of the Environment Report: Brisbane 2001. Brisbane City Council, Brisbane. [Google Scholar]
- Burrow A. L., Kazmaier R. T., Hellgren E. C. & Ruthven D. C. III. (2001) Microhabitat selection by Texas horned lizards in southern Texas. J. Wildl. Manage. 65, 645–52. [Google Scholar]
- Catterall C. P. & Kingston M. (1993) Remnant Bushland of South East Queensland in the 1990s: Its Distribution, Loss, Ecological Consequences and Future Prospects. Griffith University, Brisbane. [Google Scholar]
- Catterall C. P., Kingston M., Park K. & Sewell S. (1998) Deforestation, urbanisation and seasonality: interacting effects on bird assemblages. Biol. Conserv. 84, 65–81. [Google Scholar]
- Chambers L. K. & Dickman C. R. (2002) Habitat selection of the long‐nosed bandicoot, Perameles nasuta (Mammalia, Peramelidae), in a patchy urban environment. Austral Ecol. 27, 334–42. [Google Scholar]
- Commonwealth of Australia (2003) GeoScience Australia [Updated 2003; Cited 6 Feb 2005.] Available from URL: http://www.ga.gov.au/education/facts/capital/q.htm
- Crosswhite D. L., Fox S. F. & Thill R. E. (1999) Comparison of methods for monitoring reptiles and amphibians in upland forests of the Ouachita mountains. Proc. Okla. Acad. Sci. 79, 45–50. [Google Scholar]
- Dufty A. C. (1994) Habitat and spatial requirements of the eastern barred bandicoot (Perameles gunnii) at Hamilton, Victoria. Wildl. Res. 21, 459–71. [Google Scholar]
- Eyre T. J., Jermyn D. & Kelly A. L. (2000) Forest Condition and Habitat Assessment in Queensland: Standards for Forest Assessment Technical Report 01/00, Vol. 2. Queensland Government Department of Natural Resources, Brisbane. [Google Scholar]
- Fischer J., Lindenmayer D. & Cowling A. (2003) Habitat models for the four‐fingered skink (Carlia tetradactyla) at the microhabitat and landscape scale. Wildl. Res. 30, 495–504. [Google Scholar]
- Fischer J., Lindenmayer D. & Cowling A. (2004) The challenge of managing multiple species at multiple scales: reptiles in an Australian grazing landscape. J. Appl. Ecol. 41, 32–44. [Google Scholar]
- Flemming P. A. & Loveridge J. P. (2003) Miombo woodland termite mounds: resource islands for small vertebrates? J. Zool. Lond. 259, 161–8. [Google Scholar]
- Fox B. J. (1995) Common dunnart, Sminthopsis murina In: The Mammals of Australia (ed. Strahan R.) pp. 150–1. The Australian Museum Trust, New Holland Publishers, Sydney. [Google Scholar]
- Fox B. J., Fox M. D., Taylor J. E. et al. (1996) Comparison of regeneration following burning, clearing or mineral sand mining at Tomago, NSW. I. Structure and growth of the vegetation. Aust. J. Ecol. 21, 184–99. [Google Scholar]
- Garden J. G. (2000) Locomotion and energetics of the northern brown bandicoot, Isoodon macrourus torosus (Honours Thesis). The University of Queensland, Brisbane. [Google Scholar]
- Garden J., McAlpine C., Peterson A., Jones D. & Possingham H. (2006) Review of the ecology of Australian urban fauna: a focus on spatially explicit processes. Austral Ecol. 31,126–48. [Google Scholar]
- Griffiths A. D. & Christian K. A. (1996) The effects of fire on the frillneck lizard (Chlamydosaurus kingii) in northern Australia. Aust. J. Ecol. 21, 386–98. [Google Scholar]
- Grover D. R. & Slater P. J. (1994) Conservation value to birds of remnants of Melaleuca forest in suburban Brisbane. Wildl. Res. 21, 433–44. [Google Scholar]
- Groves C. R. & Keller B. L. (1983) Ecological characteristics of small mammals on a radioactive waste disposal area in southeastern Idaho. Am. Midl. Nat. 109, 253–65. [Google Scholar]
- Hadden S. A. & Westbrooke M. E. (1996) Habitat relationships of the herpetofauna of remnant Buloke woodlands of the Wimmera Plains, Victoria. Wildl. Res. 23, 363–72. [Google Scholar]
- Haering R. & Fox B. J. (1995) Habitat utilization patterns of sympatric populations of Pseudomys gracilicaudatus and Rattus lutreolus in coastal heathland: a multivariate analysis. Aust. J. Ecol. 20, 427–41. [Google Scholar]
- How R. & Dell J. (1993) Vertebrate fauna of the Perth metropolitan region: consequences of a modified environment In: Urban Bush Management: Proceedings of a Seminar held at Gosnells, WA 23 June 1992 (eds Australian Institute of Urban Studies , Greening Western Australia , Department of Conservation and Land Management , The Tree Society )pp. 28–47. Australian Institute of Urban Studies, Perth. [Google Scholar]
- How R. A. & Dell J. (1994) The zoogeographic significance of urban bushland remnants to reptiles in the Perth region, Western Australia. Pac. Conserv. Biol. 1, 132–40. [Google Scholar]
- How R. A. & Dell J. (2000) Ground vertebrate fauna of Perth's vegetation remnants: impact of 170 years of urbanization. Pac. Conserv. Biol. 6, 198–217. [Google Scholar]
- How R. A. & Kerle J. A. (1995) Common brushtail possum, Trichosurus vulpecula In: The Mammals of Australia (ed. Strahan R.) pp. 651–3. The Australian Museum Trust, New Holland Publishers, Sydney. [Google Scholar]
- Huey R. B. (1991) Physiological consequences of habitat selection. Am. Nat. 137, S91–115. [Google Scholar]
- Jellinek S., Driscoll D. A. & Kirkpatrick J. B. (2004) Environmental and vegetation variables have a greater influence than habitat fragmentation in structuring lizard communities in remnant urban bushland. Austral Ecol. 29, 294–304. [Google Scholar]
- Jones D. N. & Wieneke J. (2000) The suburban bird community of Townsville revisited: changes over 16 years. Corella 24, 53–60. [Google Scholar]
- Kanowski J. J., Reis T. M., Catterall C. P. & Piper S. D. (2006) Factors affecting the use of reforested sites by reptiles in cleared rainforest landscapes in tropical and subtropical Australia. Rest. Ecol. 14, 67–76. [Google Scholar]
- Keiper P. & Johnson C. N. (2004) Diet and habitat preference of the Cape York short‐nosed bandicoot (Isoodon obesulus peninsulae) in north‐east Queensland. Wildl. Res. 31,259–65. [Google Scholar]
- Koenig J., Shine R. & Shea G. (2002) The dangers of life in the city: patterns of activity, injury and mortality in suburban lizards (Tiliqua scincoides). J. Herpetol. 36,62–8. [Google Scholar]
- Lenders A. J. W. & Daamen L. (2004) Habitat management for the sand lizard at the Meinweg National Park long‐term effects of large scale sod‐cutting and burning. Natuurhistorisch Maandblad. 93, 281–6. [Google Scholar]
- Levia D. F. Jr & Page D. R. (2000) The use of cluster analysis in distinguishing farmland prone to residential development: a case study of Sterling, Massachusetts. Environ. Manage. 25, 541–8. [DOI] [PubMed] [Google Scholar]
- Lugo A. E. (2002) Can we manage tropical landscapes? An answer from the Caribbean perspective. Landsc. Ecol. 17, 601–15. [Google Scholar]
- Lunney D. (1995) Bush rat, Rattus fuscipes In: The Mammals of Australia (ed. Strahan R.) pp. 651–3. The Australian Museum Trust, New Holland Publishers, Sydney. [Google Scholar]
- MacArthur R. H. & MacArthur J. W. (1961) On bird species diversity. Ecology 42, 594–8. [Google Scholar]
- Marchesan D. & Carthew S. M. (2004) Autoecology of the yellow‐footed antechinus (Antechinus flavipes) in a fragmented landscape in southern Australia. Wildl. Res. 31,273–82. [Google Scholar]
- Matthews A., Lunney D., Waples K. & Hardy J. (2004) Brushtail possums: ‘Champion of the suburbs’ or ‘Our tormentors’? In: Urban Wildlife: More Than Meets the Eye (eds Lunney D. & Burgin S.) pp. 159–68. Royal Zoological Society of New South Wales, Mosman. [Google Scholar]
- Mengak M. T. & Guynn D. C. Jr (1987) Pitfalls and snap traps for sampling small mammals and herpetofauna. Am. Midl. Nat. 118, 284–8. [Google Scholar]
- Menkhorst P. & Knight F. (2001) A Field Guide to the Mammals of Australia. Oxford University Press, Melbourne. [Google Scholar]
- Millennium Ecosystem Assessment (2005) Ecosystems and Human Well‐being: Biodiversity Synthesis. World Resources Institute, Washington, DC. [Cited 15 May 2006.] Available from URL: http://www.millenniumassessment.org//en/index.aspx [Google Scholar]
- Monamy V. & Fox B. J. (2005) Differential habitat use by a local population of subadult common dunnarts, Sminthopsis murina, following wildfire in coastal wet heath, New South Wales, Australia. Wildl. Res. 32, 617–24. [Google Scholar]
- Monjeau J. A., Birney E. C., Ghermandi L., Sikes R. S., Margutti L. & Phillips C. J. (1998) Plants, small mammals, and the hierarchical landscape classifications of Patagonia. Landsc. Ecol. 13, 285–306. [Google Scholar]
- Mueller‐Dombois D. & Ellenberg H. (1974) Aims and Methods of Vegetation Ecology. Wiley, New York. [Google Scholar]
- Murray G. W. & Schramm D. (1987) A comparative study of the diet of the wedge‐snouted sand lizard Meroles cuneirostris (Strauch), and the sand diving lizard Aporosaura achietae (Bocage), (Lacertidae), in the Namib desert. Madoqua. 15, 55–62. [Google Scholar]
- Opdam P., Foppen R. & Vos C. (2002) Bridging the gap between ecology and spatial planning in ecology. Landsc. Ecol. 16, 767–79. [Google Scholar]
- Podani J. & Schmera D. (2006) On dendogram‐based measures of functional diversity. Oikos. 115, 179–85. [Google Scholar]
- Queensland Environmental Protection Agency (2004) Regional Ecosystems: 12.9–10.4 Queensland Government. [Cited 7 Mar 2006.] Available from URL: http://www.epa.qld.gov.au/
- Queensland Museum (1995) Wildlife of Greater Brisbane. Queensland Museum, Brisbane. [Google Scholar]
- Sala O. E., Chapin F. S., III, Armesto J. J. et al. (2000) Global biodiversity scenarios for the year 2100. Science 287, 1770–4. [DOI] [PubMed] [Google Scholar]
- Schlesinger C. A. & Shine R. (1994) Choosing a rock: perspectives of a bush‐rock collector and a saxicolous lizard. Biol. Conserv. 67, 49–56. [Google Scholar]
- Scott L. K., Hume I. D. & Dickman C. R. (1999) Ecology and population biology of long‐nosed bandicoots (Perameles nasuta) at North Head, Sydney Harbour National Park. Wildl. Res. 26, 805–21. [Google Scholar]
- Singh S., Smyth A. K. & Blomberg S. P. (2002) Effect of control burn on lizards and their structural environment in a eucalypt open‐forest. Wildl. Res. 29, 447–54. [Google Scholar]
- Smith G. T., Arnold G. W., Sarre S., Abensperg Traun M. & Steven D. E. (1996) The effect of habitat fragmentation and livestock grazing on animal communities in remnants of gimlet Eucalyptus sulabris woodland in the Western Australia Wheatbelt. II. Lizards. J. Appl. Ecol. 33, 1302–10. [Google Scholar]
- Southgate R., Palmer C., Adams M., Masters P., Triggs B. & Woinarski J. (1996) Population and habitat characteristics of the golden bandicoot (Isoodon auratus) on Marchinbar Island, Northern Territory. Wildl. Res. 23, 647–64. [Google Scholar]
- Spencer R. J., Cavanough V. C., Baxter G. S. & Kennedy M. S. (2005) Adult free zones in small mammal populations: response of Australian native rodents to reduced cover. Aust. Ecol. 30, 868–76. [Google Scholar]
- Tait C. J., Daniels C. B. & Hill R. S. (2005) Changes in species assemblages within the Adelaide metropolitan area, Australia, 1836–2002. Ecol. Appl. 15, 346–59. [Google Scholar]
- The R Development Core Team (2004) R: The R Project for Statistical Computing (v2.0.1) [Freeware] Language and Environment Copyright [Cited 2 Feb 2006.] Available from URL: http://www.r-project.org/
- Triggs B. (1996) Tracks, Scats and Other Traces. Oxford University Press, Melbourne. [Google Scholar]
- United Nations (2005) World Population Prospects: The 2004 Revision Population Database. United Nations Population Division. [Cited 17 May 2005.] Available from URL: http://esa.un.org/unpp
- Van Der Ree R. (2004) The impact of urbanisation on the mammals of Melbourne – Do atlas records tell the whole story of just some of the chapters? In: Urban Wildlife: More Than Meets the Eye (eds Lunney D. & Burgin S.) pp. 195–204. Royal Zoological Society of New South Wales, Mosman. [Google Scholar]
- Vernes K. (2003) Fine‐scale habitat preferences and habitat partitioning by three mycophagous mammals in tropical wet sclerophyll forest, north‐eastern Australia. Austral Ecol. 28, 471–9. [Google Scholar]
- Vernes K. & Pope L. C. (2001) Stability of nest range, home range and movement of the northern bettong (Bettongia tropica) following moderate‐intensity fire in a tropical woodland, north‐eastern Queensland. Wildl. Res. 28, 141–50. [Google Scholar]
- Vesk P. A. & MacNally R. (2006) The clock is ticking: revegetation and habitat for birds and arboreal mammals in rural landscapes of southern Australia. Agric. Ecosyst. Environ. 112, 356–66. [Google Scholar]
- Vitt L. J., Avila‐Pires T. C. S., Caldwell J. P. & Oliviera V. R. L. (1998) The impact of individual tree harvesting on thermal environments of lizards in Amazonian rain forest. Conserv. Biol. 12, 654–64. [Google Scholar]
- Wardell‐Johnson G. & Williams M. (1996) A floristic survey of the Tingle Mosaic, south‐western Australia: applications in land use planning and management. J. R. Soc. West. Aust. 79, 249–76. [Google Scholar]
- Webb J. K. & Shine R. (2000) Paving the way for habitat restoration: can artificial rocks restore degraded habitats of endangered reptiles? Biol. Conserv. 92, 93–9. [Google Scholar]
- White A. W. & Burgin S. (2004) Current status and future prospects of reptiles and frogs in Sydney's urban‐impacted bushland reserves In: Urban Wildlife: More Than Meets the Eye (eds Lunney D. & Burgin S.) pp. 109–23. Royal Zoological Society of New South Wales, Mosman. [Google Scholar]
- Wikramanayake E. D. & Dryden G. L. (1993) Thermal ecology of habitat and microhabitat use by sympatric Varanus bengalensis and V. salvator in Sri Lanka. Copeia. 3, 709–14. [Google Scholar]
- Wilson S. (2005) A Field Guide to Reptiles of Queensland. New Holland Publishers Pty Ltd, Sydney. [Google Scholar]
- Wilson B. A., Bourne A. R. & Jessop R. E. (1986) Ecology of small mammals in coastal heathland at Anglesea, Victoria. Aust. Wildl. Res. 13, 397–406. [Google Scholar]
- Woolley P. A. (1989) Nest location by spool‐and‐line tracking of dasyurid marsupials in New Guinea. J. Zool. 218, 689–700. [Google Scholar]
- Young P. A. R. & Dillewaard H. A. (1999) Chapter 12. Southeast Queensland In: The Conservation Status of Queensland's Bioregional Ecosystems (eds Sattler P. S. & Williams R. D.) pp. 12/1–12/48. Environmental Protection Agency, Brisbane. [Google Scholar]