

Summary
The lysosome is an acidic multi-functional organelle with roles in macromolecular digestion, nutrient sensing and signaling. However, why cells require acidic lysosomes to proliferate and which nutrients become limiting under lysosomal dysfunction are unclear. To address this, we performed CRISPR/Cas9-based genetic screens and identified cholesterol biosynthesis and iron uptake as essential metabolic pathways when lysosomal pH is altered. While cholesterol synthesis is only necessary, iron is both necessary and sufficient for cell proliferation under lysosomal dysfunction. Remarkably, iron supplementation restores cell proliferation under both pharmacologic and genetic-mediated lysosomal dysfunction. The rescue was independent of metabolic or signaling changes classically associated with increased lysosomal pH, uncoupling lysosomal function from cell proliferation. Finally, our experiments revealed that lysosomal dysfunction dramatically alters mitochondrial metabolism and HIF signaling due to iron depletion. Altogether, these findings identify iron homeostasis as the key function of lysosomal acidity for cell proliferation.
eToc Blurb:
The lysosome is a multi-functional organelle whose low pH is required for cell viability. Weber et al. identified iron as necessary and sufficient for cell proliferation under lysosomal dysfunction. While iron addition uncouples lysosomal acidity from cell viability, iron chelation combined with lysosome-targeting compounds represents a potential cancer therapeutic strategy.
Graphical Abstract
Introduction
Lysosomes are acidic membrane-bound organelles that play key roles in nutrient signaling, uptake and digestion of macromolecules, autophagy and recycling of intracellular components (Appelmans et al., 1955; Bainton, 1981; De Duve and Wattiaux, 1966; Lawrence and Zoncu, 2019). For activation and maximal enzyme activity, these catabolic reactions require the protected acidic environment of the lysosome, achieved through the proton-pumping action of the vacuolar-type ATPase (v-ATPase) (Mindell, 2012). Consistent with a critical role in maintaining cellular homeostasis, lysosomal pH dysfunction is associated with neurodegenerative diseases, aging, lysosomal storage disorders and compromised immunity (Bergmann et al., 2004; Klempner and Styrt, 1983; Koh et al., 2019; Platt et al., 2018).
A major ramification of inhibiting lysosomal acidification is impaired cell proliferation (Figure 1A; Figure S1A) (Manabe et al., 1993; Nishihara et al., 1995; Tsherniak et al., 2017). Accordingly, lysosome function is essential for the growth and progression of diverse human cancer types (Graham et al., 2014; Kinoshita et al., 1996; Ohta et al., 1998; Yan et al., 2016) and pH-disrupting lysosomotropic agents such as hydroxychloroquine are effective anti-cancer agents in vitro and in vivo (Yang et al., 2011). However, precisely why cells require acidic lysosomes to proliferate is not well-defined (Figure 1A). A priori, several explanations may underlie this phenomenon including compromised lysosomal membrane integrity and release of cytotoxic contents (Boya and Kroemer, 2008), broad impairment of lysosomal functions such as autophagy and endocytosis, or depletion of critical nutrients upon disruption of lysosomal catabolism. Although the first two scenarios render cell proliferation in the absence of functional lysosomes infeasible, the third scenario would allow bypassing the necessity of lysosomal acidity upon supplementation of these limiting nutrients.
Figure 1: A metabolism-focused CRISPR-Cas9 genetic screen identifies genes whose loss sensitizes cells to lysosomal pH inhibitors.

(A) Maintaining lysosomal pH is essential for cells to proliferate. Ammonia and BafAl disrupts lysosomal pH through different mechanisms.
(B) Dose-dependent effects of BafAland ammonia on Jurkat cell proliferation (mean ± SD, n=3).
(C) Immunoblotting for lysosomal markers in input, purified lysosomes, or control immunoprecipitates in the presence or absence of BafAl (10nm) or NH4Cl (10mM). Lysates were prepared from cells expressing 3xHA-tagged TMEM192 (HA-Lyso cells) or 3xFLAG-tagged TMEM192 (FLAG control cells).
(D) Metabolite abundance in cells or lysosomes upon treatment with BafA1 (10nm) or NH4Cl (10mM). P-values are for comparisons between metabolite concentrations in whole-cell or lysosome samples (upper panel) (n = 3 for each treatment; dotted line represents P = 0.05). Heat map of fold changes (log2) in metabolite concentrations of treatment relative to control (lower panel).
(E) Scheme describing the pooled CRISPR-based screen.
(F) Gene scores in untreated versus ammonia-treated (3mM) Jurkat cells (left). Gene scores in untreated versus BafA1-treated (3nM) Jurkat cells (right). The gene score is the median log2 fold change in the abundance of all sgRNAs targeting that gene during the culture period. Most genes, as well as non-targeting control sgRNAs, have similar scores in the presence or absence of the treatments.
(G) Top 20 genes scoring as differentially required upon ammonia (left) or BafA1 (right) treatment. Genes associated with lysosomal pH regulation are indicated in green, iron homeostasis in purple, central carbon metabolism in blue and cholesterol synthesis in red.
(H) Plot of gene score ranks from ammonia and BafA1 screens. Significant (P<0.01) unique hits in the BafA1 are in the lower right quartile, significant unique hits in the ammonia screen are in the upper left quartile, and significant hits shared in both screens are in the lower left quartile.
Here, using unbiased genetic screens, we identified metabolic processes that are required for cell proliferation under lysosomal pH inhibition. In particular, cholesterol synthesis, iron trafficking, and central carbon metabolism are essential when lysosomal pH is disrupted. Interestingly, we circumvented the requirement for functional lysosomes by simply providing cells with free iron, making iron, but not others, the limiting small molecule. Finally, because of iron depletion, lysosomal pH inhibition leads to mitochondrial dysfunction and a reliance on pyruvate dehydrogenase activity. Together, our results identify iron homeostasis as the key function of lysosomal acidity for cell proliferation.
Results
A metabolism-focused CRISPR-Cas9 genetic screen identifies genes whose loss sensitizes cells to lysosomal pH inhibitors
To understand the impact of lysosomal acidity on cell metabolism, we first characterized the effects of two small molecules that raise lysosomal pH through different mechanisms. Ammonia, an endogenous toxic metabolite, disrupts lysosomal acidity by acting as a lysosomotropic weak base (Klempner and Styrt, 1983). Bafilomycin A1 (BafA1), a macrolide, potently inhibits the v-ATPase pump and prevents acidification of lysosomes (Figure 1A) (Bowman et al., 1988). Both compounds cause cell death at high concentrations and only mildly inhibit cell proliferation at lower concentrations (Figure 1B). To determine whether these orthogonal means of increasing lysosomal pH affect metabolism in similar ways, we profiled polar metabolites in cell extracts and purified lysosomes (Figure 1C). Consistent with previous reports (Abu-Remaileh et al., 2017), disruption of lysosomal pH caused profound metabolic changes in the lysosomes, including increases in the levels of amino acids such as proline and asparagine and a profound decrease in lysosomal cystine (Figure 1D). While BafA1 led to more dramatic changes in lysosomal metabolites than ammonia, both caused changes in a wide variety of metabolites that generally trended in the same direction (Figure 1D). This suggested that the metabolic alterations, following these treatments, both inside lysosomes and larger cellular milieu, were generally similar.
Next, to systematically characterize the metabolic processes required for cell viability and proliferation under lysosomal dysfunction and to identify potentially limiting metabolites, we performed CRISPR/Cas9 genetic screens for metabolic genes whose loss potentiates the anti-proliferative effects of mild lysosomal pH disruption (Figure 1E). For these screens, we used a focused library targeting ~3,000 metabolism-related genes and measured the abundances of sgRNAs in the control, BafA1, or ammonia-treated Jurkat cells at the beginning and at the end of the 14-day culture period. For each gene, we calculated its score as the median log2 fold change in the abundance of the 8–10 sgRNAs targeting the gene. Most genes and control sgRNAs scored similarly in the presence or absence of NH4Cl and Bafilomycin A1, confirming the robustness of the genetic screens (Figure 1F; Table S1 and Table S2). Among the top-represented pathways shared between these screens were iron homeostasis, cholesterol biosynthesis and central carbon metabolism (Figure 1G). Interestingly, in a similar screen performed in a KMS26 myeloma cell line, these pathways were also among the top-represented genes, indicating a generalized role for these metabolic pathways under lysosomal pH inhibition (Figure S1B and Table S3).
In addition to these common pathways and consistent with the different modes of action for each molecule, our screens identified differentially essential genes under ammonia or BafA1 treatments (Figure 1H). The top-scoring gene unique to ammonia treatment was the cation transporter SLC12A9 (Figure 1H and Figure S1C). Interestingly, the yeast ortholog of SLC12A9 is localized to vacuoles and regulates vacuolar osmoregulation (Chapel et al., 2013; Petrezselyova et al., 2013), raising the possibility that SLC12A9 may counteract the anti-proliferative effects of ammonia. Indeed, expression of sgRNAs targeting SLC12A9 sensitized Jurkat cells to ammonia treatment (Figure S1D). Conversely, the top-scoring gene under BafA1 treatment was ATP6V0A2, a gene not essential upon ammonia treatment (Figure 1H; Figure S1A and S1E). Similarly, expression of sgRNAs targeting ATP6V0A2 sensitized Jurkat cells to BafA1 treatment (Figure S1F). As a non-essential component of the lysosomal v-ATPase complex and adjacent to the BafA1 binding site, loss of ATP6V0A2 may impact v-ATPase activity itself or the action of BafA1 on the complex. These experiments suggest that cancer cells rely on distinct metabolic pathways to survive under different modes of lysosomal pH inhibition.
Upon lysosomal pH perturbation, cells are starved for cholesterol and iron
Given their high scores in both genetic screens, we turned our focus to cholesterol synthesis and iron homeostasis. To study these pathways, in this context, we generated clonal knockout Jurkat cell lines for SQLE and SLC11A2, two scoring genes of cholesterol and iron metabolism, respectively (Figure S2A). SQLE, a rate limiting enzyme of cholesterol synthesis, catalyzes the conversion of squalene to (S)-2,3-epoxysqualene (Garcia-Bermudez et al., 2019). On the other hand, SLC11A2 is a transmembrane glycoprotein involved in ferrous iron import across the plasma membrane as well as endosomal transport out of lysosomes (Hubert and Hentze, 2002). While both knockout cells, are viable and proliferate at similar rates to parental counterparts, non-lethal doses of ammonia and BafA1 profoundly affect cell viability and proliferation of the knockout cells (Figure 2A and 2C). In line with these observations, pharmacologic inhibition of SQLE by a small molecule inhibitor, NB-598, or iron chelation by deferoxamine (DFO) also sensitized Jurkat and several other cell lines to inhibition of lysosomal acidity with BafA1 as well as chloroquine, a lysosomotropic agent with anti-cancer properties (Figure 2B and 2D; Figure S2B, S2C and S2D). These data validate the CRISPR screening results and reveal that cells depend on de novo cholesterol synthesis and iron import to proliferate under lysosomal dysfunction.
Figure 2: Upon lysosomal pH dysfunction, cells depend on cholesterol synthesis and iron uptake and activate starvation response pathways.

(A) SQLE knockout cells die upon BafA1(2nm) (left) or ammonia (5mM) (right) treatment. Fold change in cell number (log2) of wild type and SQLE knockout Jurkat cells after treatment with indicated molecules for 5 days (mean ± SD, n=3, **p<0.05).
(B) Inhibition of SQLE using a small molecule inhibitor (NB-598; 10 μM) is synthetic lethal with lysosomal pH disruption. Fold change in cell number (log2) of untreated or NB-598 (10μM) treated Jurkat cells under BafA1(3nM) (left) or ammonia (5mM) (right) for 5 days (mean ± SD, n=3, **p<0.05).
(C) SLC11A2 knockout cells die upon BafA1(3nM) (left) or ammonia (4mM) treatment (right). Fold change in cell number (log2) of wild type and SLC11A2 knockout Jurkat cells after treatment with indicated molecules for 5 days (mean ± SD, n=3, **p<0.05).
(D) Iron chelation using deferoxamine (DFO) is synthetic lethal with lysosomal pH inhibition. Fold change in cell number (log2) of untreated or DFO (3μM) treated Jurkat cells under BafA1(3nM) (left) or ammonia (4mM) (right) for 5 days (mean ± SD, n=3, **p<0.05).
(E) Immunoblotting for SREBP-1 and −2 cleavage in Jurkat cells in the presence or absence of BafA1 (right) or ammonia (left).
(F) qRT-PCR analysis for the indicated mRNAs in the presence or absence of BafA1 (10nM) (top) or ammonia (10mM) (bottom) (mean ± SD, n=3, **p<0.05).
(G) Mevalonate pathway in human cells (top). Relative lanosterol or cholesterol levels in Jurkat cells treated with BafAl (10nM) or ammonia (10mM) after a 24-hour treatment using LC-MS/MS (mean ± SD, for n=3, **p<0.05). All measurements are relative to untreated wild type Jurkat cells.
(H) Ferro-orange staining for intracellular Fe2+ in 293T cells treated for 24h in the presence or absence of BafAl (10nM) or DFO (100μM). Shown is one of five representative fields illustrating fluorescence intensity taken at identical exposures for each condition. Scale bar, 10 μm.
(I) Immunoblotting for the iron response pathway proteins (IRP2 and TFRC) in 293T cells in the presence or absence of BafA1 (10nM).
(J) Immunoblotting for iron sulfur cluster containing proteins SDHB and FECH in 293T cells in the presence or absence of BafA1 (10nM).
(K) Relative aconitase activity in 293T cells grown 24h in the presence or absence of BafA1 (10nM). (mean ± SD, for n=3, **p<0.05).
As both iron and cholesterol are essential for cell proliferation, we next explored whether cells starve for them under lysosomal dysfunction. Mammalian cells control their cholesterol levels through a feedback regulatory system that senses intracellular cholesterol and activates membrane-bound sterol regulatory element binding proteins (SREBPs) (Mullen et al., 2016). Under cholesterol deprivation, SREBPs are cleaved from membranes, allowing them to translocate to nucleus and activate transcription of its target genes. Interestingly, NH4Cl and BafA1 activate SREBP cleavage in Jurkat cells and upregulate expression of SREBP targets involved in de novo cholesterol synthesis, including HMGCS1, HMGCR and SQLE (Figure 2E and 2F). Furthermore, lanosterol, a surrogate for de novo cholesterol synthesis increases, suggesting that SREBP-mediated cholesterol synthesis is induced upon altering lysosomal pH (Figure 2G).
Cells treated with either BafA1 or iron chelator DFO were profoundly depleted of intracellular iron, as read out by a fluorescent iron probe (Figure 2H). Consequently, as is similarly observed under direct iron chelation (Vashisht et al., 2009), BafA1 activated the iron starvation cascade that prevents proteasomal degradation of Iron-Regulatory Protein 2 (IRP2), which, in turn, stabilizes mRNA of several iron-related genes, including TFRC, the cell surface transferrin receptor (Figure 2I). Because iron availability is also a major determinant for the synthesis of Fe-S clusters, a cofactor required for the stability and activity of several enzymes, we next sought to test whether lysosomal dysfunction affects iron sulfur cluster proteins, as well. Iron-sulfur clusters stabilize complex II of the electron transport chain and FECH, the final enzyme of the heme biosynthesis pathway. Additionally, this cofactor is required for the catalytic activity of aconitase. By all these measures, BafA1 treatments strongly decreases the stability or catalytic activity of these proteins (Figure 2J and 2K). Cholesterol supplementation had no effect on BafA1 mediated stimulation of the iron response pathway or of the destabilization of iron-sulfur containing proteins, ruling out any crosstalk between these pathways (Figure S2E). Altogether our data indicate that human cells activate cholesterol synthesis and iron uptake to compensate for their decreased levels under inhibition of lysosomal acidification.
Supplementation of iron, but not cholesterol, is sufficient to enable human cells to proliferate upon pharmacological and genetic disruption of lysosomal acidity
The fact that lysosomal dysfunction induces iron and cholesterol starvation responses, we next asked whether one of these is a limiting metabolite and if we can restore cell proliferation by directly adding the deficient metabolite. To test this possibility, we supplemented Jurkat cell lines with varying levels of iron and cholesterol. While cholesterol addition completely rescued proliferation of SQLE knockout cells under cholesterol depletion, it did not enable cell proliferation when lysosomal pH is disrupted, suggesting that cholesterol is not a metabolic limitation (Figure S3A). In contrast, supplementation of media with iron in the form of ferric (III) ammonium citrate (FAC) or ferrous (II) ammonium sulfate (FAS) remarkably reversed the anti-proliferative effects of both ammonia and BafA1 on Jurkat cells (Figure 3A and 3B). Iron supplementation also protected other mouse and human cell types from lysosomal pH inhibition, indicating a generalizable role for iron as a limiting metal for cell proliferation (Figure 3C). It should be noted that we supplemented the antioxidant, Ferrostatin-1, to cells grown in the presence of free iron to prevent any ROS-induced cytotoxicity. However, supplementation of Ferrostatin-1 alone without iron had no effect on BafA1 toxicity (Figure S3B).
Figure 3: Iron supplementation is sufficient to enable human cells upon pharmacological and genetic disruption of lysosomal pH.

(A) Iron (Ferric (III) Ammonium Citrate (FAC)) rescues the proliferation of Jurkat cells under lysosomal dysfunction. Fold change in cell number (log2) in the presence or absence of NH4Cl (10mM) (left) or BafA1(5nM) (right) and/or FAC (0.1mg/ml) (blue) for 5 days (mean ± SD, n=3, **p<0.05).
(B) Ferrous (II) Ammonium Sulfate (FAS) also rescues proliferation of Jurkat cells under lysosomal pH inhibition. Fold change in cell number (log2) in the presence or absence of or BafA1(5nM) and/or FAS (0.1mg/ml) (blue) for 5 days (mean ± SD, n=3, **p<0.05).
(C) Iron supplementation at indicated concentrations rescues cell proliferation in HEK293T and HT cells under BafilomycinA1 concentrations up to 2μM. Fold change in cell number (log2) in the presence or absence of BafA1 and/or FAC (mean ± SD, n=3, **p<0.05).
(D) Expression of SLC11A2 isoform 2 is sufficient to enable proliferation of cells upon lysosomal pH inhibition. Expression of SLC11A2.2 rescues BafA1 sensitivity of the Kras/p53 mouse cancer cell lines. Immunoblot analysis of wild type and SLC11A2 expressing Kras p53 cell line (top). GAPDH was used as a loading control. Fold change in cell number (log2) of empty vector (EV) (gray) and SLC11A2 cDNA (blue) expressing cells after a 5-day treatment with BafA1(10nM) (blue) (mean ± SD, for n=3, **p<0.05) (bottom).
(E) Iron supplementation enables v-ATPase deficient cells to survive and proliferate. Immunoblots for ATP6V0C in HEK293T cell line infected with sgATP6V0C virus in the presence or absence of Shield-1 (500 nM; top). Relative fold change in cell viability of indicated cancer cell lines grown in the absence and presence of Shield-1 and iron (FAC 0.1mg/ml) for 5 days (bottom) (mean ± SD, for n=3, **p<0.05). Representative bright-field micrographs of indicated cells after a 5-day BafA1 treatment in the absence or presence of iron (right).
(F) Schematic depicting co-essentiality analysis from RNAi screens using DepMAP data (top). Correlations of gene essentialities of ATP6V0C with other genes were calculated and ranked (bottom). TFRC is indicated in red and other VATPase subunits in green.
The iron rescue experiments required iron concentrations that are higher than those found in standard media or human serum. This suggests that free iron uptake is not universally efficient among different cell types. To test this possibility, we overexpressed different isoforms of an iron transporter, SLC11A2 in Jurkat and Kras/p53 mouse cancer cell lines. SLC11A2.2 is more enriched on the plasma membrane and mediates absorption of non-transferrin bound iron while SLC11A2.1 is more enriched on endosomal/lysosomal membranes and mediates absorption of transferrin bound iron (Hubert and Hentze, 2002) (Figure S3C). Remarkably, only expression of the plasma membrane SLC11A2 isoform rescued cell viability of these cell lines, even in the absence of additional iron supplementation (Figure 3D; Figure S3D and S3E). These experiments indicate that iron becomes limiting for cellular viability and proliferation under lysosomal pH dysfunction.
To expand upon our work with pharmacological inhibition of the v-ATPase to increase lysosomal pH, we next asked if iron supplementation rescues the proliferation of cells with genetic v-ATPase defects. Components of the lysosomal v-ATPases are among the most essential genes for proliferation in all cell lines (Figure S1A). However, why v-ATPases are required for proliferation is not completely clear. To explore this question, we chose a highly essential v-ATPase component, ATP6V0C and generated conditionally v-ATPase deficient HEK293T cell lines using a CRISPR-Cas9 system based on Cas9 containing a destabilization domain (dd-Cas9) which is stablized by an FKBP12 synthetic ligand (Shield-1) (Senturk et al., 2017). Upon ATP60VC loss, HEK293T cells stop proliferating and can only be rescued upon addition of iron (Figure 3E). Interestingly, at the time of collection, we found that after Shield-1 addition, remaining 293T cells treated with iron had much lower amounts of ATP6V0C than those untreated counterparts, which is consistent with a selection against v-ATPase loss in cells in the absence of iron (Figure 3E). Collectively, these data demonstrate that iron is essential for the optimal survival and proliferation of cells lacking v-ATPase activity.
Finally, to explore the limiting role of iron further, we determined biologically relevant gene associations with v-ATPases using a publicly available RNAi genetic screening data of 712 cell lines (Figure 3F). As genes in the same functional pathways show parallel patterns of essentiality, variations in gene essentiality provides an efficient means for discovering genes with similar biological roles. Remarkably, correlation of essentiality gene scores revealed that the essentiality of ATP6V0C correlated highly significantly with that of other v-ATPase subunits as well as TFRC, but not with cholesterol uptake or cholesterol biosynthesis or other metabolic genes (Figure 3F). Of note, we could not use CRISPR based screens due to the essential role of v-ATPases upon complete loss in this system (Figure S1A). This further supports the limiting role of iron for cell proliferation under lysosomal dysfunction.
Iron-mediated rescue of cell proliferation is independent of signaling and metabolite changes associated with lysosomal acidity
We next asked how iron rescues cell proliferation under inhibition of lysosomal acidification. Increasing cellular iron levels may restore v-ATPase associated functions or bypass entirely the need for a functional v-ATPase. Iron addition did not affect the broad metabolite changes previously observed under BafA1 treatment (Figure 1D; Figure 4A; Figure S4A). In fact, the metabolite changes relative to untreated controls of BafA1 alone and BafA1 supplemented with iron are highly correlated (whole cell r=0.775, lysosome r = 0.996, p<0.001) (Figure 4A). Similarly, iron supplementation did not prevent inhibition of mTOR activity (Zoncu et al., 2011) (Figure s4b) or aggregation of LC3B-II, a surrogate for autophagy inhibition, following BafA1 treatment (Figure 4C).
Figure 4: Iron-mediated rescue of cell proliferation is independent of signaling and metabolite changes associated with lysosomal acidity.

(A) Comparison of metabolite abundance in 293T whole cells or purified lysosomes upon treatment with BafAl (10nM) in the presence or absence of iron supplementation (FAC 0.4 mg/ml). (Lysosomes r= 0.996, p<0.001; Whole cell r=0.785, P<0.001)
(B) Iron release from transferrin depends on lysosomal acidity. 293T lysates following uptake of biotinylated-holotransferrin, after 24-hour control, BafA1(10nM), or BafAl and FAC (0.1mg/ml) treatments were immobilized on PDVF membranes. Immunoblotting for TF, TFRC, and vinculin loading controls or incubation of membrane with HRP-streptavidin
(C) Immunoblotting for LC3B-II accumulation as an indicator of inhibition of autophagy completion in cells grown under BafA1 (10nM) or FAC (0.4mg/ml) for 24 hours.
Another function of lysosomal acidity is to enable the release of cargo following receptor-mediated endocytosis(Maxfield, 2014). One such process involves the uptake of transferrin-bound iron through the transferrin receptor. To test whether iron addition impacts the release of transferrin bound iron, we cultured cells in the presence of biotinylated holo-transferrin and measured levels of holo (unreleased iron) or apo (released iron) forms under lysosomal pH inhibition. These experiments showed an accumulation of holo-transferrin as indicated by a phoretic shift in the transferrin band, regardless of the iron supplementation and an increase in the ratio of holo- to apo-transferrin (Figure 4B). Notably, both the apo- and holo-transferrin levels decrease upon iron addition likely due to the downregulation of the transferrin receptor (TFRC) levels as part of the iron response pathway (Figure 4B) (Scheiber-Mojdehkar et al., 2004). Taken together, these data suggest that iron supplementation rescues cell proliferation independent of v-ATPase associated processes.
Cellular processes restored by iron supplementation under lysosomal dysfunction
We next sought to determine cellular processes restored by iron supplementation when lysosomal pH is disrupted. Iron supplementation increases intracellular iron levels, tempers the iron starvation response (Figure 5A and S4C) and reverses the destabilization of iron sulfur cluster (ISC)-containing proteins (Figure 5B). Consistent with the protective effect of low oxygen on iron-sulfur clusters (Alvarez et al., 2017; Ast et al., 2019), hypoxia also potentiated the iron-mediated rescue under lysosomal pH inhibition (Figure 5C). Notably, BafA1 destabilizes many but not all iron sulfur cluster containing proteins likely due to variable affinities of proteins to ISCs or their differential stability upon loss of the ISC.
Figure 5: Cellular processes restored by iron supplementation under lysosomal dysfunction.

(A) Ferro-orange staining for intracellular Fe2+ in 293T cells cultured in the presence or absence of BafA1 (10nM) and/or FAC (0.1mg/ml). Shown is one of five representative fields illustrating fluorescence intensity taken at identical exposures for each condition. Scale bar, 10 μm.
(B) Immunoblotting for the indicated iron sulfur cluster containing proteins. GAPDH and Beta-actin are used as loading controls.
(C) High oxygen levels disrupt iron sulfur clusters. Fold change in cell number (log2) of Jurkat cells in the absence and presence of FAC (0.1mg/mL) and hypoxia after treatment with indicated concentrations of BafA1 for 5 days (mean ± SD, n=3, **p<0.05).
(D) Oxygen consumption rate in 293T cells in the presence and absence of BafA1 (10nM) with and without iron supplementation (FAC 0.1mg/ml) (mean ± SD, n=9, **p<0.05).
(E) Illustration of HIF1a stabilization by BafA1-mediated iron depletion (left). Immunoblotting for HIF1a in 293T cells grown in the presence or absence of BafA1 (10nM) and/or FAC (0.1mg/ml) (right).
(F) Gene set enrichment analysis (GSEA) on FPKM values from RNA-seq performed on 293T cells grown in the presence or absence of BafA1 (10nM) and/or FAC (0.1mg/ml). Graphed are normalized enrichment scores from 86 enriched pathways using the protein interaction database as the gene set. Values above the gray dotted line are pathways enriched with a nominal p-value <0.05. Highlighted in red is the HIF1a pathway.
(G) Relative expression of canonical HIF1a transcription targets (FPKM normalized to Control) from above RNA-seq experiment (mean ± SD, n=3, **p<0.05).
On a broader metabolic level, BafA1 treatment impairs baseline and maximal respiration, which was rescued by iron supplementation (Figure 5D). This phenotype is congruent with a destabilization of iron-sulfur cluster containing components of electron transport chain complexes I and II (Figure 5B and S4E). Nonetheless pyruvate supplementation, which normally rescues cytotoxicity and cell proliferation upon electron transport chain inhibition, does not restore cell viability upon lysosomal dysfunction (Figure S4D). This indicates that defects in the electron transport chain are one of many metabolic changes due to iron depletion but not the sole cause of cytotoxicity.
Iron availability also controls the stability of hypoxia inducible factors (HIFs) through inhibition of the activity of Fe(II) dependent prolyl hydroxylases (PHDs) (Figure 5E) (Siegert et al., 2015). Consistent with previous observations (Miles et al., 2017), BafA1 treatment increases HIF1a protein levels (Figure 5E) and the expression of the canonical HIF1a target genes (Figure 5F and 5G; Table S4), a phenotype largely reverted by iron supplementation. Altogether, these experiments suggest that iron supplementation restores mitochondrial function and HIF activation status under lysosomal pH disruption.
Lysosomal acidity couples iron homeostasis to mitochondrial citrate synthesis
As cells starve for iron and depend on it to proliferate under inhibition of lysosomal acidification, we next sought to determine the genes or processes required for cell proliferation specifically due to iron starvation. To study this in an unbiased manner, we performed a complementary CRISPR/Cas9 metabolism screen under direct iron chelation and identified genes that are essential under both lysosomal dysfunction and deferoxamine (DFO)-mediated iron depletion (Figure 6A; Figure S5A). While sgRNAs targeting genes encoding enzymes and transporters related to iron metabolism, including SLC11A2, CYB561A3 and the mitochondrial iron carriers SLC25A28 and SLC25A37, were significantly depleted, none of the cholesterol synthesis-related genes or non-essential v-ATPase components scored upon DFO treatment (Figure 5A; Figure S5A). Conversely, several genes encoding Krebs cycle enzymes including citrate synthase (CS) and pyruvate dehydrogenase (PDHA1, PDHB) scored in both BafA1 and DFO screens (Figure 6A; Figure S5A and S5B, Table S5).
Figure 6: Lysosomal acidity couples iron homeostasis to mitochondrial citrate synthesis.

(A) Scheme of CRISPR/Cas9 screen of deferoxamine-mediated iron chelation (left). Plot of gene score ranks from DFO and BafA1 screens (right). Significant (P<0.01) unique hits in the BafA1 are in the lower right quartile, significant unique hits in the DFO screen are in the upper left quartile, and significant hits shared in both screens are in the lower left quartile.
(B) Fold change in cell number (log2) of parental and PDHB null Jurkat cells in the absence or presence of DFO (3μM), BafA1 (3nM) and ammonia (4mM) for 5 days (mean ± SD, n=3, **p<0.05).
(C) Illustration of isotopic labeling of citrate and downstream TCA cycle intermediates from U13C-glucose (left). m+2 fraction labeled metabolites represent the pyruvate dehydrogenase-dependent labeling. Citrate and downstream TCA cycle intermediates m+2 fraction labeling in WT and PDHB-null Jurkat cells in the absence and presence of BafA1 (10nM) (right) (mean ± SD, n=3, **p<0.05).
(D) Illustration of isotopic labeling of citrate and cis-aconitate from U13C-glutamine (left). m+4 labeled citrate and cis-aconitate represents the oxidative, pyruvate dehydrogenase dependent and aconitase independent labeling. m+5 labeled citrate represents the oxidative, pyruvate dehydrogenase independent and aconitase dependent labeling. Relative citrate and cis-aconitate abundance in WT and PDHB-null Jurkat cells in the absence and presence of BafA1 (10nM) (right) (mean ± SD, n=3, **p<0.05). Statistical analysis was performed on the m+5 fraction.
(E) Aconitase activity in 293T cells in the presence and absence of BafA1 (10nM) with and without iron supplementation (FAC 0.1mg/ml) (mean ± SD, n=3, **p<0.05).
(F) Fold change in cell number (log2) of parental and PDHB null Jurkat cells in the absence and presence of Ferric ammonium citrate (0.1mg/ml) and BafA1 (3nM) (mean ± SD, n=3, **p<0.05).
To study the essential role of pyruvate dehydrogenase under iron depletion further, we generated clonal Jurkat knockout cells of PDHA1 and PDHB, components of the pyruvate dehydrogenase complex (Figure S5C). Confirming the screen results, loss of PDHB or PDHA1 sensitized cells to the treatment of ammonia, BafA1 as well as DFO (Figure 6B; Figure S5D). PDH-mediated acetyl-coA production may feed into cholesterol synthesis, de novo lipid synthesis (Figure S6C) or antioxidant capacity (Pietrocola et al., 2015), but none of these processes scored in the DFO screen (Figure S5A). Furthermore, PDHB null cells proliferate normally in lipoprotein depleted serum (LPDS) and antioxidant addition does not rescue their sensitivity to lysosomal dysfunction, ruling out the possibility that sensitivity of PDHB null cells is due to deficits in cholesterol synthesis or antioxidant capacity (Figure S5E, S6A, and S6B). These data suggest that limiting iron is the basis of PDHB knockout sensitivity to lysosomal pH inhibition.
We next asked why cells depend on PDH activity to proliferate under lysosomal pH dysfunction and iron depletion. As PDH catalyzes the conversion of glucose-derived pyruvate to acetyl-coA, one possibility is that PDH may be necessary to contribute carbon units for the TCA cycle upon lysosomal dysfunction. Glucose tracing experiments showed a significant decrease in downstream TCA cycle intermediates (m+2) from isotopically labeled glucose, raising the possibility that cells do not require PDH activity to fill in their tCa cycle. Despite this decrease, glucose-labeled citrate levels were not affected by lysosomal pH inhibition, suggesting a block in aconitase activity (Figure 6C; Figure S5G). Interestingly there was a decrease in the baseline level of total citrate, which further drops upon BafA1 treatment in PDHB null cells, but not in parental counterparts (Figure S5H). Notably, we could partially rescue sensitivity of PDHB null cells with citrate supplementation (Figure S5F). Taken together, these data indicate that lysosomal acidity is required for PDH-independent citrate synthesis.
One way to obtain citrate, independent of pyruvate, is from glutamine through reductive carboxylation (Rajagopalan et al., 2015). In reductive carboxylation, citrate is synthesized from glutamine through the reversal of isocitrate dehydrogenase and aconitase. Indeed, we observe a significant enrichment of fractional citrate labeling (m+5) from glutamine in PDHB null cells compared to parental controls. Similar to our glucose tracing results, BafA1 treatment decreases total and m+5 labeled citrate levels in PDHB null cells. Consistent with the block in reductive carboxylation in WT cells, BafA1 leads to a decrease in m+5 labeled citrate, but not other isotopically labeled intermediates (Figure 6D). As reductive carboxylation depends on mitochondrial aconitase (ACO2), an iron sulfur containing protein, we hypothesized that lysosomal pH dysfunction depletes cellular iron, which, in turn, may inhibit aconitase activity and indirectly decrease citrate availability in PDHB null cells. In line with this possibility, BafA1 significantly decreases aconitase activity, which is restored by iron supplementation (Figure 6E). Furthermore, iron supplementation rescues the sensitivity of PDHB knockout Jurkat cells to BafA1 (Figure 6F). These results couple lysosomal acidity to mitochondrial citrate synthesis and indicate the functional requirement for lysosomes in central carbon metabolism through iron homeostasis.
Discussion
Cancer cells rely on functional acidic lysosomes to proliferate. While lysosomes are important for many anabolic and catabolic functions, our data indicates maintenance of cellular iron levels as the key function of lysosomes in cancer cell proliferation (Figure 7). As iron supplementation bypasses the need for functional and acidic lysosomes, our data strongly argues against a cytotoxic death upon release of degradative enzymes or heavy metals. Indeed, iron supplementation does not restore canonical lysosomal functions such as nutrient signaling and autophagy, but rather rescues defects associated with iron depletion. Lysosomal dysfunction, through iron depletion, leads to profound alterations in metabolism including electron transport chain impairment, induction of hypoxia-like signaling, and changes in central carbon metabolism. These results link lysosomal function to mitochondrial metabolism and, in part, explain the mitochondrial defects seen in mammalian cells under lysosomal dysfunction.
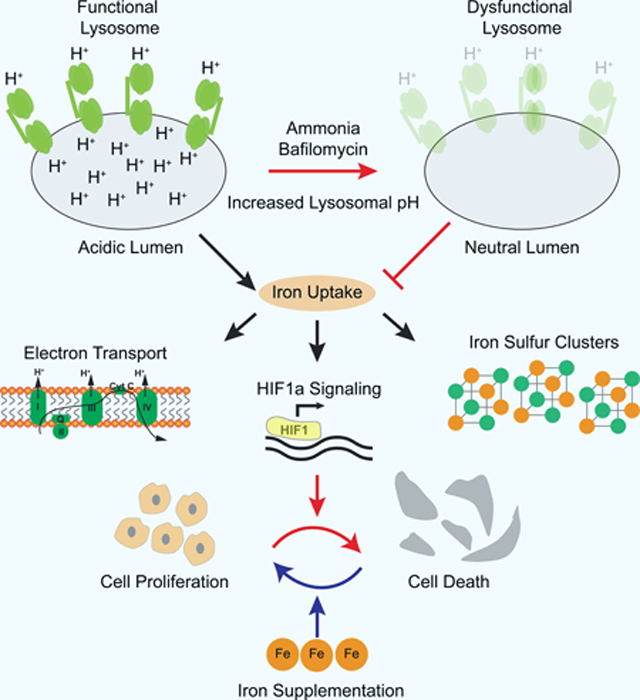
Figure 7: Maintaining iron homeostasis is the key role of lysosomal acidity for mitochondrial function and cell proliferation.

Schematic illustrating that although lysosomes participate in many key cellular functions including cholesterol uptake, signaling, and autophagy, iron is the essential function of lysosomes for cell proliferation under inhibition of lysosomal acidification. In this context, iron supplementation restores loss of iron sulfur clusters and is sufficient to rescue cell viability and proliferation.
Given the interest in lysosome biology and its relevance in cancer, our findings may have therapeutic implications. Lysosomal pH disrupting drugs such as hydroxychloroquine show efficacy in clinical trials for several cancer types. While some of the efficacy was attributed to the reliance of some tumors on catabolic pathways such as macropinocytosis and autophagy, our data raise the possibility that iron may be a limiting metal for cancer cells when treated with these inhibitors. Indeed, iron chelation and chloroquine were synthetically lethal in a mouse pancreatic cancer model (Figure S2D) Similarly, toxic ammonia may build up at concentrations in the tumor microenvironment that may disrupt lysosomal acidity (Spinelli et al., 2017) and can also be exploited by targeting iron homeostasis in these tumors. Building upon these, it should be determined whether iron deficient diets, mitochondrial citrate synthesis inhibition, or iron chelation can be targeted for some tumors or in combination with lysosomal pH inhibitors.
STAR Methods
Contact for Reagent and Resource Sharing
Further information and requests for resources and reagents should be directed to and will be fulfilled by the Lead Contact, Kivanç Birsoy (kbirsoy@rockefeller.edu).
Experimental Model and Subject Details
Cell Lines, Compounds, and Constructs
The KPC pancreas mouse cell line was kindly provided by Dr. Thales Papagiannakopoulos (New York University School of Medicine). Remaining cell lines (Jurkat, HEK293T, KMS26, and HeLa) were purchased from the ATCC. Cell lines were verified to be free of mycoplasma contamination and the identities of all were authenticated by STR profiling. Compounds and antibodies are listed in Key Resources Table.
Key Resources Table
| REAGENT or RESOURCE | SOURCE | IDENTIFIER |
|---|---|---|
| Antibodies | ||
| SLC11A2 | Proteintech | 20507-1-AP RRID:AB_10694284 |
| PDHB | Proteintech | 14744-1-AP RRID:AB_2162941 |
| TF | Proteintech | 17435-1-AP RRID:AB_2035023 |
| FECH | Proteintech | 14466-1-AP RRID:AB_2231579 |
| LIAS | Proteintech | 11577-1-AP RRID:AB_2135972 |
| FDX1 | Proteintech | 12592-1-AP RRID:AB_11182486 |
| NDUFS1 | Proteintech | 12444-1-AP RRID:AB_2282657 |
| NDUFS3 | Proteintech | 15066-1-AP RRID:AB_2151109 |
| NDUFS7 | Proteintech | 15728-1-AP RRID:AB_2149029 |
| UQCRFS1 | AbCam | ab14746 RRID:AB_301445 |
| SDHB | AbCam | ab14714 RRID:AB_301432 |
| SREBP-2 | AbCam | ab30682 RRID:AB_779079 |
| SREBP-1 | Santa Cruz | sc-13551 RRID:AB_628282 |
| ATP6V0C | Novus Biologicals | NBP1-59654 RRID:AB_11004830 |
| HIF1a | BD Biosciences | 610958 RRID:AB_398271 |
| LAMP1 | Cell Signaling | 9091 RRID:AB_2687579 |
| LC3B | Cell Signaling | 3868 RRID:AB_2137707 |
| VINCULIN | Cell Signaling | 4650 RRID:AB_10559207 |
| IRP2 | Cell Signaling | 37135 RRID:AB_2799110 |
| TFRC | Cell Signaling | 13208 RRID:AB_2798150 |
| S6K | Cell Signaling | 2708 RRID:AB_390722 |
| pS6K | Cell Signaling | 9234 RRID:AB_2269803 |
| CoxIV | Cell Signaling | 4850 RRID:AB_2085424 |
| ACO1/IRP1 | Cell Signaling | 20272S RRID:AB_2798839 |
| ACO2 | Cell Signaling | 6571S RRID:AB_2797630 |
| GRIM19 | GeneTex | GTX30483 RRID:AB_377875 |
| ACTIN | GeneTex | GTX109639 RRID:AB_1949572 |
| GAPDH | GeneTex | GTX627408 RRID:AB_11174761 |
| HRP-conjugated horse anti-mouse IgG | Cell Signaling | 7076 RRID:AB_330924 |
| HRP-conjugated and goat anti-rabbit IgG | Cell Signaling | 7074 RRID:AB_2099233 |
| IR-Dye680LT-conjugated Donkey anti-mouse IgG | LI-COR | 926-68022 RRID:AB_10715072 |
| IR-Dye800CW-conjugated Donkey anti-rabbit IgG | LI-COR | 926-32212 RRID:AB_621847 |
| Bacterial and Virus Strains | ||
| NEB Stable CompetentE. coli | NEB | C3040 |
| Critical Commercial Assays | ||
| CellTiter-Glo Luminescent Cell Viability Assay | Promega | G7573 |
| DNeasy Blood & Tissue Kit | QIAGEN | 69504 |
| Pierce BCA Protein Assay Kit | Thermo Fisher | 23225 |
| QIAprep Spin Miniprep Kit | QIAGEN | 27106 |
| RNeasy Mini Kit | QIAGEN | 74104 |
| Superscript II RT Kit | Invitrogen | 18064014 |
| Aconitase Assay Kit | Abcam | ab83459 |
| Seahorse XF Cell Mito Stress Test Kit | Agilent | 103015-100 |
| NativePAGE Sample Prep Kit | ThermoFisher | BN2008 |
| NativePAGE Running Buffer Kit | ThermoFisher | BN2007 |
| CellROX Deep Red Flow Cytometry Assay Kit | ThermoFisher | C10491 |
| TruSeq® Stranded mRNA Library Prep (48 Samples) | Illumina | 20020594 |
| Chemicals, Peptides, and Recombinant Proteins | ||
| RPMI 1640 Culture Media | GIBCO | 11875 |
| DMEM Culture Media | GIBCO | 11965 |
| Seahorse XF RPMI medium, pH 7.4 | Agilent | 103576-100 |
| Trypsin | GIBCO | 25200 |
| Sodium Pyruvate (100mM) | GIBCO | 11360070 |
| L-Glutamine (200 mM) | GIBCO | 25030081 |
| D-Glucose | VWR | 0188-500G |
| FBS | Sigma | 12306C |
| Dialyzed FBS | GIBCO | 12676029 |
| Fetal Bovine Lipoprotein Deficient Serum | Kalen Biomedical | N/A |
| Bafilomycin A1 | Cayman Chemical | 11038 |
| NB-598, DMSO | Adooq Bioscience | A15180 |
| Ferrostatin-1 | Tocris | 5180 |
| Shield-1 | CheminPharma | CIP-S1-00005 |
| Sodium Pyruvate | Sigma | P2256 |
| Sodium Citrate Tribasic Dihydrate | Sigma | S4641 |
| NH4Cl | Sigma | A9434 |
| NH4OH | Sigma | 09859 |
| Cholesterol | Sigma | C8667 |
| Ammonium Iron (III) Citrate (FAC) | Sigma | F5879 |
| Ammonium iron(II) sulfate hexahydrate (FAS) | Fisher Scientific | A12473 |
| Ethanol 100% | Fisher Scientific | 04-355-222 |
| Deferoxamine Mesylate | Sigma | D9533 |
| DMSO | AlfaAesar | A13280-36 |
| HPLC Grade Water | Fisher Scientific | W6 |
| HPLC Grade Methanol | Fisher Scientific | A454-1 |
| Pierce Anti-HA Magnetic Beads | ThermoFisher | 88837 |
| Biotinylated holo-transferrin | ThermoFisher | 23363 |
| Pierce High Sensitivity Streptavidin-HRP | ThermoFisher | 21130 |
| Heavy labeled amino acid internal standards | Cambridge Isotopes | MSK-A2-1.2 |
| [U-13C5]-glutamine | Cambridge | CLM-1822-H-0.1 |
| [U-13C6]-glucose | Cambridge | CLM-1396-5 |
| FerroOrange | Dojindo | F374 |
| BSMBI | NEB | R0580 |
| T4 DNA Ligase | NEB | M0202 |
| ExTaq DNA Polymerase | Takara | RR001A |
| SYBR Green PCR Master Mix | Applied Biosystems | 4309155 |
| HBSS | GIBCO | 24020117 |
| XtremeGene9 | Roche | 6365779001 |
| Polybrene | Sigma | H9268 |
| Puromycin | Sigma | P8833 |
| BamHI | NEB | R3136 |
| NotI | NEB | R3189 |
| Deposited Data | ||
| DepMap | (Tsherniak et al., 2017) | https://depmap.org/portal/ |
| RNA-Seq FPKM Values | This study | Table S5 |
| Experimental Models: Cell Lines | ||
| Jurkat | ATCC | N/A |
| HEK293T | ATCC | N/A |
| KMS26 | ATCC | N/A |
| HeLa | ATCC | N/A |
| Mouse Pancreas Cancer (KP) | Dr. Thales Papagiannakopoulos |
|
| Oligonucleotides | ||
| qPCR primers and sgRNA oligonucleotides | This study | See Table S6 |
| Recombinant DNA | ||
| pLJC5-T mem192-2xFlag | Dr. David Sabatini | |
| pLJC5-T mem192-3xHA | Dr. David Sabatini | |
| pMXS-IRES-RFP | This study | N/A |
| pMXS-IRES-GFP | This study | N/A |
| pMXS-IRES-GFP SLC11A2.1 | This study | N/A |
| pMXS-IRES-GFP SLC11A2.2 | This study | N/A |
| pLenti CRISPR puro v1 | Addgene | 49535 |
| pLenti CRISPR puro v2 | Addgene | 5296 |
| pLenti CRISPR puro v2 sgATP6V0A2_1 | This study | N/A |
| pLenti CRISPR puro v2 sgATP6V0A2_2 | This study | N/A |
| pLenti CRISPR puro v1 sgSLC12A9_1 | This study | N/A |
| pLenti CRISPR puro v1 sgSLC12A9_2 | This study | N/A |
| pLenti CRISPR puro v1 sgSQLE | This study | N/A |
| pLenti CRISPR puro v2 sgSLC11A2 | This study | N/A |
| pLenti CRISPR puro v2 sgPDHB | This study | N/A |
| DD-Cas9 | R. Sordella | N/A |
| DD-Cas9 sgATP6V0C | This study | N/A |
| Software and Algorithms | ||
| XCaliburQual Browser 2.2 | ThermoFisher |
https://www.thermofisher.com/order/catalog/product/OPTON-30965#/OPTON-30965 RRID:SCR_014593 |
| Skyline Daily | MacCoss Lab |
https://skyline.ms/project/home/software/Skyline/begin.view RRID:SCR_014080 |
| STAR | (Dobin et al., 2013) |
https://github.com/alexdobin/STAR RRID:SCR_015899 |
| RESM | (Li and Dewey, 2011) | https://github.com/deweylab/RSEM |
| GSEA | (Subramanian et al., 2005) |
http://software.broadinstitute.org/gsea/index.jsp RRID:SCR_003199 |
| FCS Express 7 | Denovo Software |
https://denovosoftware.com/ RRID:SCR_016431 |
| Prism 8 | GraphPad |
https://www.graphpad.com/scientific-software/prism/ RRID:SCR_002798 |
| NextSeq Control Software v1.4 | Illumina | 15048776 Rev.E |
| Other | ||
| Z2 Coulter Counter | Beckman | Model Z2 |
| SpectraMax Microplate Reader | Molecular Devices | Model M3Primovert |
| Microscope | Carl Zeiss | 415510-1105-000 |
| FACSAriall | BD Biosciences | 643181 |
| QuantStudio 6 Flex Real-Time PCR System | TheroFisher | 4485692 |
| Odyssey CLx Imaging System | LI-COR | |
| InvivO2 Hypoxia Workstation | Baker | |
Cell Culture Conditions
Unless otherwise indicated, cells were cultured in RPMI-1640 media (Gibco) containing 2 mM glutamine, 10% fetal bovine serum (Sigma), 1% penicillin and streptomycin (Invitrogen). For iron supplementation rescue experiments, cells were grown in indicated concentrations of ferric ammonium citrate with 1μM Ferrostatin-1. For lipoprotein depleted media, 10% fetal bovine serum was replaced with 10% lipoprotein depleted serum (Kalen Biomedical). Unless otherwise indicated, all cells were maintained and grown at 37°C, 21% oxygen and 5% CO2. For cell proliferation assays at 3% oxygen, the hypoxia chamber (INVIVO) was set to 3% oxygen and culture media was preincubated under these conditions for 24 hours.
Method Details
Generation of knockout and overexpression constructs
Forward and reverse oligos targeting SQLE, SLC11A2, PDHB, SLC12A9, and ATPV0A2 were annealed and ligated into BSMBI-linearized plentiCRISPR v1 or v2 vector. Forward and reverse oligos targeting ATP6V0C were cloned into plentiCRISPRv2 shield vector. The sequences for the sgRNA oligos are listed in Table S6. Gene fragments encoding SLC11A2.1 and SLC11A2.2 were purchased from Twist Biosciences and cloned into pMXS-IRES-GFP by PCR and Gibson assembly. pMXS-IRES-RFP was used as an empty vector control.
Cell Proliferation Assays
2,000 Jurkat cells or 500 HeLa, 293T, or KPC cells were seeded in 0.2mL RPMI-1640 medium (Gibco) containing indicated treatments in triplicates in 96 well plates. On the day of seeding and after 5 days of growth, 50μL of Cell Titer Glo reagent was added and luminescence was measured on a SpectraMax M3 plate reader (Molecular Devices). Data are presented as cell doublings or the log2 fold change in luminescence following 5 days of growth compared to initial reading on the day of seeding. Of note, ammonia experiments needed to be performed in 24 well plates to obtain consistent values.
Generation of Knockout and overexpression cell lines
For generation of knockout cells, lentiviral packaging vectors VSV-G and Delta-VPR and plentiCRISPR expressing Cas9 and the appropriate sgRNA were simultaneously transfected into 293T cells using XtremeGene9 transfection reagent (Roche). For the overexpression of SLC11A2, pMXS-IRES-GFP expressing the indicated isoform along with retroviral packaging plasmids Gag-pol and VSV-G, were transfected into 293T cells. pMXS-IRES-RFP was used as empty vector controls. 60 hours post-transfection, the supernatant was collected and passed through a 0.45 syringe filter. For transduction, 0.1 × 10⁶ cells were plated in 6-well dishes containing 8mg/ml polybrene and virus, and then spin infected by centrifugation at 2,200 rpm for 1.5 hours. Clonal knockouts were generated by FACS sorting single cells on a BD FACSAriaII, 72–96 hours post-infection into 96 well plates and grown for 2 weeks. Multiple clonal knockouts were validated via immunoblotting and cell proliferation assays. For overexpression cell lines, 72–96 hours post-infection, GFP+ cells were bulk-sorted on a BD FACSAriaII. For generation of conditional ATP6V0C knockout cells, cells were puromycin selected 48h post infection, pretreated with or without Shield-1 (0.5μM) for 3 days prior to a 5-day cell proliferation assay with or without Shield-1 (0.5μM) or FAC (0.1mg/ml). At the end point of the cell proliferation assay protein extracts were collected for immunoblotting.
Rapid lysosomal purification for LC-MS metabolite profiling
Lysosomes were purified from 293T cell expressing 3xHA-TMEM192 (lysosomal isolation) or 2xFLAG-TMEM192 (background control) according to previously described protocol (Abu-Remaileh et al., 2017). Briefly, cells were grown for 24 hours under indicated treatments. ~30× 106 cells were washed 2x in cold PBS, scraped into 1ml of cold KPBS, and pelleted via centrifugation at 1000x g for 1 minute, 30 seconds at 4°C. Cells were resuspended in 1mL of KPBS, 10μl of cells were transferred into 50μl of 1% triton lysis buffer for a whole cell protein sample and 10pl of cells were transferred into 50μl of 80% methanol, containing heavy labeled amino acid standards, for direct extraction of whole cell metabolites. With one set of 20 strokes and another set of 10 strokes, the remaining sample was homogenized using a 2ml homogenizer. After centrifugation, the homogenate was incubated with 200μl of KPBS pre-washed anti-HA magnetic beads on a rotator shaker for 5 minutes at 4°C. Beads were washed 3x in cold KPBS. 10% of bead volume was lysed with 1% triton buffer for protein extracts and remaining 90% was extracted in 80% methanol containing heavy labeled amino acid standards on a rotator shaker for 10 minutes at 4°C. Samples were spun down at 20,000g to remove potential cellular debris or bead contamination prior to LC-MS polar metabolite profiling.
CRISPR/Cas9 Genetic Screens
Metabolism-focused Cas9/sgRNA libraries were designed and genetic screens were performed and analyzed as previously described (Birsoy et al., 2015; Wang et al., 2014; Zhu et al., 2019). Briefly, 40× 106 Jurkat or KMS26 cells were infected with a lentiviral Cas9/sgRNA library at a 0.8 MOI. 48 hours following infection, cells were selected with puromycin for 72 hours and recovered for 24 hours. 40× 106 cells, were pelleted and frozen as an initial sample and remaining cells were seeded into 500ml spinning flasks at a confluence of 80× 103 cells/ml. Cells were split every 3 days and grown under indicated conditions for ~14 doublings. After 14 doublings, 40× 106 cells were harvested for gDNA extraction using QIAamp Blood Midi Kit (Spin Protocol). sgRNAs were PCR amplified from 40μg of gDNA using Ex Taq DNA Polymerase, gel purified, and sequenced on NextSeq500 (Illumina) to quantify sgRNA abundance. After the sequencing reads were mapped, sgRNA counts were determined and guide scores, representing the log2 fold change of the normalized final read count of the guide from the initial read count of the guide, were calculated. Gene scores were defined as the median guide score.
mTOR activation assay
mTOR activation following amino acid starvation was assayed according to previously devised protocol (Zoncu et al., 2011). Briefly, 1× 10⁶ 293T cells were washed 2x in PBS and incubated in serum free, amino acid depleted RPMI media for 50 minutes under indicated treatments. Following amino acid starvation, a 10x amino stock containing amino acids at concentrations found in RPMI or PBS was added to wells for 10 minutes. Following amino acid re-feeding, cells were lysed according to immunoblot protocol and mTOR activation was assayed via immunoblotting of phosphorylated S6K.
Real-time quantitative PCR
RNAeasy Mini Kit (Qiagen) was used to isolate RNA from cells. 1μg of isolated RNA, quantified on a NanoDrop Microvolume Spectrophotometer (ThermoFisher) was used for cDNA synthesis with Superscript II RT Kit (Invitrogen). qPCR was performed on a Thermo QuantStudio 6 Flex Real-Time PCR machine. The primer sequences are listed in Table S6. SREBP-2 target genes (SQLE, HMGCR, HMGCS1) were normalized to beta actin.
Metabolite Profiling
For bulk polar metabolite profiling and isotopic labeling, 1× 10⁶ Jurkat cells were seeded in triplicate in 6 well plates and grown for 24 hours under indicated treatments. For glucose and glutamine tracing experiments, cells were grown under indicated treatments for 12 hours in standard RPMI/10% FBS. After 12 hours, media was replaced with RPMI/10% dialyzed FBS (Gibco) lacking glutamine or glucose and containing [U-13C]-glutamine (2mM) or [U-13C]-glucose (10mM), respectively, and grown for an additional 12 hours. Cells were washed 2x in cold 0.9% NaCl, extracted in 1ml 80% methanol containing 15N and 13C fully-labeled amino acid internal standards (MSK-A2–1.2, Cambridge Isotope Laboratories, Inc). Extracts were vortexed for 10 minutes, centrifuged at 20,000g to remove insoluble cell debris, nitrogen-dried, and stored at - 80°C until liquid chromatography-mass spectrometry (LC-MS). LC-MS was performed as previously described (Garcia-Bermudez et al., 2018) and relative quantification of metabolite abundances was performed using XCalibur QualBrowser 2.2 and Skyline Targeted Mass Spec Environment (MacCoss Lab) using a 5 ppm mass tolerance and a pooled-library of metabolite standards to confirm metabolite identity. Metabolite levels were normalized by cell counting and BCA protein quantification for each condition. For LysoIPs, the LC-MS metabolite profiling protocol was the same as above except the metabolite extracts were not dried and 5μl of the 80% methanol extracts were directly injected for LC-MS.
For measurement of lanosterol and cholesterol, non-polar metabolites were extracted by phase separation through successive additions of 600μl of LC-MS grade 100% methanol, 300μl LC-MS grade water, and 400μl LC-MS grade chloroform. The lower, organic phase was carefully collected, nitrogen dried, and stored at −80°C until LC-MS. LC-MS was run and analyzed, referencing cholesterol and lanosterol standards, as previously described (Garcia-Bermudez et al., 2019).
Immunoblotting
1× 10⁶ cells were washed in cold PBS and lysed in a buffer containing 10 mM Tris-Cl pH 7.5, 150 NaCl, 1 mM EDTA, 1% Triton X-100, 2% SDS, 0.1% CHAPS, and protease inhibitors (Roche). Lysates were sonicated, centrifuged at 20,000g, and total protein quantified using BCA Protein Assay Kit (Thermo Fisher). Supernatants were run on 8%, 10–20% or 12% SDS-PAGE and analyzed via immunoblotting. Blots were developed using the Licor Odyssey CLx infrared imaging system or Chemiluminescent detection and film exposure.
Aconitase Activity Assay
Aconitase activity assays were performed using the Aconitase Assay Kit (ab83459) purchased from Abcam. 293T cells were grown in the presence and absence of BafA1(10nM) and/or ferric ammonium citrate (0.1mg/ml) for 24 hours. 1× 10⁶ cells per well were processed according to manufacturer’s protocol and aconitase activity was read out as the increase in absorbance at 240nm read in 45 second intervals over 30 minutes at room temperature on a SpectraMax M3 plate reader (Molecular Devices). Absorption at values 240nm were normalized to protein concentration as determined by BCA (Pierce) and converted to moles of cis-aconitate formed (extinction coefficient: 2.2 OD mM−1/well).
Transferrin Uptake Assay
293T cells were grown in the presence or absence of BafA1 alone (10nM) or BafA1 (10nM) and ferric ammonium citrate (0.1mg/ml) for 24 hours. Cells were serum starved for 45 minutes and subsequently incubated with biotinylated-holo transferrin (20μg/ml) for 45 minutes. Cells were immediately washed in cold PBS, lysed, and resolved on 8% or 10–20% SDS-PAGE gels, and transferred to a PDVF membrane, according to immunoblotting protocols. Levels of holo versus apo transferrin was assessed via immunoblotting of transferrin or incubation of membrane in HRP-conjugated streptavidin (1:10,000).
RNA Sequencing
As above, 1× 10⁶ 293T cells were grown in 1μM ferristatin-1 with or without 0.1 mg/ml ferric ammonium citrate (FAC) for 24h. Following 24h growth, 10nM BafA1 was added to cells and cultured for an additional 24h. Cells were washed 2x with cold PBS and RNA was harvested using RNAeasy mini kit (Qiagen) according to manufacturer’s protocol. 100 ng of total RNA was used to generate RNA-Seq libraries using Illumina TruSeq stranded mRNA LT kit (Cat# 20020594). Libraries prepared with unique barcodes were pooled at equal molar ratios. The pool was denatured and sequenced on Illumina NextSeq 500 sequencer using high output V2 reagents and NextSeq Control Software v1.4 to generate 75 bp single reads, following manufacturer’s protocol (Cat# 15048776 Rev.E). Reads were aligned to GRCh38 using STAR RNA-seq aligner (Dobin et al., 2013). Aligned BAM files were sorted by coordinate and translated into transcript coordinates using quantMode SAM options. Transcript abundance was quantified using RSEM (Li and Dewey, 2011). Gene set enrichment analysis was performed on FPKM values from transcripts mapped to known coding genes from 3 biological replicates from each condition using 1000 permutations of the protein interaction data base (PID) gene set to generate pathway enrichment scores (Subramanian et al., 2005).
Iron Staining
5×10⁴ 2 93T cells were seeded on MatTek No. 1.5, 35mM glass bottom culture dishes (MatTek P35G-1.5–14-C). As above, cells were pre-incubated for 24h in 1μM ferristatin-1 with or without 0.1 mg/ml ferric ammonium citrate. Cells were grown for an additional 24h in the presence or absence of DFO or BafA1. Plates were washed 3x in HBSS and stimulated at 37°C, 21 % oxygen and 5% CO2 for 20 minutes in HBSS. Next cells were stained in 1μM Ferro orange (dojingo) in HBSS for exactly 30 minutes at 37°C, 2 1% oxygen and 5% CO2 and imaged immediately. Treatments were staggered to ensure precise staining duration. Focal images were acquired with a Zeiss inverted LSM 780 laser scanning confocal microscope (Zeiss) using a 63x/1.4 DIC Plan-Apochromat oil immersion objective. Five representative fields were captured for each condition under identical exposure times. Images were obtained with the Cy3 filter (ex 514nm, em 525–596). The images are 512 × 512 pixels with a pixel depth of 8-bit, with a pixel size of 0.264μm per pixel, a dwell time of 1.58μs, a pinhole size of 11.2 (1Airy unit), and a line averaging of 1.
Oxygen Consumption Measurements
Oxygen consumption rate of intact cells under the aforementioned treatments was performed using XF96e Extracellular Flux Analyzer (Seahorse Bioscience). 1× 10⁴ 293T cells were seeded on Seahorse cell culture plates. Cells were treated with Fer-1, FAC, BafA1 and DFO according to aforementioned protocol. Using XF MitoStress kit, oxygen consumption was measured as a proxy for basal respiration, ATP linked respiration, maximal respiration, and reserve capacity following respective injections with a blank, oligomycin (1.5μM), FCCP (1.0μM), and Rotenone/Antimycin A (0.5μM). Oxygen consumption rate measurements were normalized to protein abundance via BCA (Pierce).
Measurement of cellular reactive oxygen species
Approximately 1× 10⁶ Jurkat WT and PDHB knockout cells were cultured in the presence or absence of 10nM BafAl for 24h. Positive control cells for reactive oxygen species were treated with TBHP (200uM) 30 minutes prior to staining. Cells were washed 1x in warm HBSS and incubated for 30 minutes at 37°C, 21% oxygen and 5% CO2 in 1μM CellRox in HBSS. Cells were washed 1x in warm HBSS, filtered into a FACS tube and kept on ice and protected from light until measurement. Flow cytometry data were collected on a BD LSR II Flow Cytometer (BD Biosciences) using an excitation wavelength of 644 nm and the FL1 collection channel. FCS Express 7 software was used for data analysis.
Blue Native Gel
293T cells were grown for 24h in the presence of Ferrostatin-1 (1μM) and in the presence or absence of FAC (0.1mg/ml). Cells were then grown in the presence or absence of 10nM BafA1 for 24h and mitochondria were isolated from cells according to a previously described protocol (Jha et al., 2016). Approximately, 50μg of purified mitochondria from 293T were reconstituted in NativePAGE Sample Buffer (Thermo Fisher BN2003) and solubilized in digitonin (4g digitonin / g mitochondrial protein). Coomassie G-250 was added to samples as a charge shift molecule at a final concentration of 0.3%. Samples were run on NativePAGE 4–16% Bis-Tris Protein Gels (Thermo Fisher BN1002B0X) at 4°C at 150V for 30 minutes in dark blue cathode buffer and 250V for 90 minutes in light blue cathode buffer (Thermo Fisher BN2007), or until the dye front began to run off the gel. Gel was incubated in transfer buffer for 30 minutes 25mM Tris, 192 mM glycine, 20% w/v methanol, 0.1% SDS, pH 8.3. The gel was transferred to 0.45uM PDVF membranes overnight at air dried. Excess Coomassie stain was washed away with subsequent methanol washes and the membrane was subsequently processed for immunoblotting as described above.
Statistical Analyses
Statistical analyses were performed on GraphPad Prism 8. Error bars are +/− sample standard deviation. Sample means, P-value, and sample size are indicated in text or figure legends.
Data and Code Availability
Raw data from RNA-sequencing experiments have been deposited in the Gene Expression Omnibus (GEO) and are available under accession code GSE141507. All other supporting data in this study are available from the Lead Contact on request.
Supplementary Material
Table S1. Guide counts, Guide scores and gene scores from Jurkat ammonia negative pooled CRISPR screen, Related to Figure 1.
Table S2. Guide counts, Guide scores and gene scores from Jurkat BafA1 negative pooled CRISPR screen, Related to Figure 1.
Table S3. Guide counts, Guide scores and gene scores from KM26 ammonia negative pooled CRISPR screen, Related to Figure 1.
Table S4. FPKM values for RNA-seq experiments used for GSEA analyses. Related to Figure 5.
Table S5. Guide counts, Guide scores and gene scores from Jurkat Deferoxamine negative pooled CRISPR screen. Related to Figure 6.
Table S6. Primers and oligonucleotide sequences, Related to STAR methods.
Highlights:
Cells starve for cholesterol and iron under lysosomal dysfunction.
Upon increased lysosomal pH, only iron addition enables cell proliferation.
Iron does not restore lysosomal pH-related catabolic and signaling functions.
Iron reverses other cellular processes, related to depleted cellular iron.
Acknowledgements
We thank all members of the Birsoy Lab for helpful suggestions. This research is supported by the NIH (K22CA193660 to K.B.), the Irma-Hirschl Trust (K.B.), and AACR NextGen Grant (K.B.). K.B. is a Searle Scholar, Pew-Stewart Scholar, Sidney Kimmel Scholar and Basil O’Connor Scholar of the March of Dimes. R.A.W. was supported by a Medical Scientist Training Program grant from the National Institute of General Medical Sciences of the National Institutes of Health under award number T32GM007739 to the Weill Cornell/Rockefeller/Sloan Kettering Tri-Institutional MD-PhD Program. The project described was co-sponsored by the Center for Basic and Translational Research on Disorders of the Digestive System through the generosity of the Leona M. and Harry B. Helmsley Charitable Trust.
Footnotes
Declaration of Interests
The authors declare no competing interests.
Publisher's Disclaimer: This is a PDF file of an unedited manuscript that has been accepted for publication. As a service to our customers we are providing this early version of the manuscript. The manuscript will undergo copyediting, typesetting, and review of the resulting proof before it is published in its final form. Please note that during the production process errors may be discovered which could affect the content, and all legal disclaimers that apply to the journal pertain.
References
- Abu-Remaileh M, Wyant GA, Kim C, Laqtom NN, Abbasi M, Chan SH, Freinkman E, and Sabatini DM (2017). Lysosomal metabolomics reveals V-ATPase-and mTOR-dependent regulation of amino acid efflux from lysosomes. Science 358, 807–813. [DOI] [PMC free article] [PubMed] [Google Scholar]
- Alvarez SW, Sviderskiy VO, Terzi EM, Papagiannakopoulos T, Moreira AL, Adams S, Sabatini DM, Birsoy K, and Possemato R (2017). NFS1 undergoes positive selection in lung tumours and protects cells from ferroptosis. Nature 551, 639–643. [DOI] [PMC free article] [PubMed] [Google Scholar]
- Appelmans F, Wattiaux R, and De Duve C (1955). Tissue fractionation studies. 5. The association of acid phosphatase with a special class of cytoplasmic granules in rat liver. Biochem J 59, 438–445. [DOI] [PMC free article] [PubMed] [Google Scholar]
- Ast T, Meisel JD, Patra S, Wang H, Grange RMH, Kim SH, Calvo SE, Orefice LL, Nagashima F, Ichinose F, et al. (2019). Hypoxia Rescues Frataxin Loss by Restoring Iron Sulfur Cluster Biogenesis. Cell 177, 1507–1521e1516. [DOI] [PMC free article] [PubMed] [Google Scholar]
- Bainton DF (1981). The discovery of lysosomes. J Cell Biol 91, 66s–76s. [DOI] [PMC free article] [PubMed] [Google Scholar]
- Bergmann M, Schutt F, Holz FG, and Kopitz J (2004). Inhibition of the ATP-driven proton pump in RPE lysosomes by the major lipofuscin fluorophore A2-E may contribute to the pathogenesis of age-related macular degeneration. FASEB J 18, 562–564. [DOI] [PubMed] [Google Scholar]
- Birsoy K, Wang T, Chen WW, Freinkman E, Abu-Remaileh M, and Sabatini DM (2015). An Essential Role of the Mitochondrial Electron Transport Chain in Cell Proliferation Is to Enable Aspartate Synthesis. Cell 162, 540–551. [DOI] [PMC free article] [PubMed] [Google Scholar]
- Bowman EJ, Siebers A, and Altendorf K (1988). Bafilomycins: a class of inhibitors of membrane ATPases from microorganisms, animal cells, and plant cells. Proc Natl Acad Sci U S A 85, 7972–7976. [DOI] [PMC free article] [PubMed] [Google Scholar]
- Boya P, and Kroemer G (2008). Lysosomal membrane permeabilization in cell death. Oncogene 27, 6434–6451. [DOI] [PubMed] [Google Scholar]
- Chapel A, Kieffer-Jaquinod S, Sagne C, Verdon Q, Ivaldi C, Mellal M, Thirion J, Jadot M, Bruley C, Garin J, et al. (2013). An extended proteome map of the lysosomal membrane reveals novel potential transporters. Mol Cell Proteomics 12, 1572–1588. [DOI] [PMC free article] [PubMed] [Google Scholar]
- De Duve C, and Wattiaux R (1966). Functions of lysosomes. Annu Rev Physiol 28, 435–492. [DOI] [PubMed] [Google Scholar]
- Dobin A, Davis CA, Schlesinger F, Drenkow J, Zaleski C, Jha S, Batut P, Chaisson M, and Gingeras TR (2013). STAR: ultrafast universal RNA-seq aligner. Bioinformatics 29, 15–21. [DOI] [PMC free article] [PubMed] [Google Scholar]
- Garcia-Bermudez J, Baudrier L, Bayraktar EC, Shen Y, La K, Guarecuco R, Yucel B, Fiore D, Tavora B, Freinkman E, et al. (2019). Squalene accumulation in cholesterol auxotrophic lymphomas prevents oxidative cell death. Nature 567, 118–122. [DOI] [PMC free article] [PubMed] [Google Scholar]
- Garcia-Bermudez J, Baudrier L, La K, Zhu XG, Fidelin J, Sviderskiy VO, Papagiannakopoulos T, Molina H, Snuderl M, Lewis CA, et al. (2018). Aspartate is a limiting metabolite for cancer cell proliferation under hypoxia and in tumours. Nat Cell Biol 20, 775–781. [DOI] [PMC free article] [PubMed] [Google Scholar]
- Graham RM, Thompson JW, and Webster KA (2014). Inhibition of the vacuolar ATPase induces Bnip3-dependent death of cancer cells and a reduction in tumor burden and metastasis. Oncotarget 5, 1162–1173. [DOI] [PMC free article] [PubMed] [Google Scholar]
- Hubert N, and Hentze MW (2002). Previously uncharacterized isoforms of divalent metal transporter (DMT)-1: implications for regulation and cellular function. Proc Natl Acad Sci U S A 99, 12345–12350. [DOI] [PMC free article] [PubMed] [Google Scholar]
- Jha P, Wang X, and Auwerx J (2016). Analysis of Mitochondrial Respiratory Chain Supercomplexes Using Blue Native Polyacrylamide Gel Electrophoresis (BN-PAGE). Curr Protoc Mouse Biol 6, 1–14. [DOI] [PMC free article] [PubMed] [Google Scholar]
- Kinoshita K, Waritani T, Noto M, Takizawa K, Minemoto Y, Nishikawa A, and Ohkuma S (1996). Bafilomycin A1 induces apoptosis in PC12 cells independently of intracellular pH. FEBS Lett 398, 61–66. [DOI] [PubMed] [Google Scholar]
- Klempner MS, and Styrt B (1983). Alkalinizing the intralysosomal pH inhibits degranulation of human neutrophils. J Clin Invest 72, 1793–1800. [DOI] [PMC free article] [PubMed] [Google Scholar]
- Koh JY, Kim HN, Hwang JJ, Kim YH, and Park SE (2019). Lysosomal dysfunction in proteinopathic neurodegenerative disorders: possible therapeutic roles of cAMP and zinc. Mol Brain 12, 18. [DOI] [PMC free article] [PubMed] [Google Scholar]
- Lawrence RE, and Zoncu R (2019). The lysosome as a cellular centre for signalling, metabolism and quality control. Nat Cell Biol 21, 133–142. [DOI] [PubMed] [Google Scholar]
- Li B, and Dewey CN (2011). RSEM: accurate transcript quantification from RNA-Seq data with or without a reference genome. BMC Bioinformatics 12, 323. [DOI] [PMC free article] [PubMed] [Google Scholar]
- Manabe T, Yoshimori T, Henomatsu N, and Tashiro Y (1993). Inhibitors of vacuolar-type H(+)-ATPase suppresses proliferation of cultured cells. J Cell Physiol 157, 445–452. [DOI] [PubMed] [Google Scholar]
- Maxfield FR (2014). Role of endosomes and lysosomes in human disease. Cold Spring Harb Perspect Biol 6, a016931. [DOI] [PMC free article] [PubMed] [Google Scholar]
- Miles AL, Burr SP, Grice GL, and Nathan JA (2017). The vacuolar-ATPase complex and assembly factors, TMEM199 and CCDC115, control HIF1alpha prolyl hydroxylation by regulating cellular iron levels. Elife 6. [DOI] [PMC free article] [PubMed] [Google Scholar]
- Mindell JA (2012). Lysosomal acidification mechanisms. Annu Rev Physiol 74, 69–86. [DOI] [PubMed] [Google Scholar]
- Mullen PJ, Yu R, Longo J, Archer MC, and Penn LZ (2016). The interplay between cell signalling and the mevalonate pathway in cancer. Nat Rev Cancer 16, 718–731. [DOI] [PubMed] [Google Scholar]
- Nishihara T, Akifusa S, Koseki T, Kato S, Muro M, and Hanada N (1995). Specific inhibitors of vacuolar type H(+)-ATPases induce apoptotic cell death. Biochem Biophys Res Commun 212, 255–262. [DOI] [PubMed] [Google Scholar]
- Ohta T, Arakawa H, Futagami F, Fushida S, Kitagawa H, Kayahara M, Nagakawa T, Miwa K, Kurashima K, Numata M, et al. (1998). Bafilomycin A1 induces apoptosis in the human pancreatic cancer cell line Capan-1. J Pathol 185, 324–330. [DOI] [PubMed] [Google Scholar]
- Petrezselyova S, Kinclova-Zimmermannova O, and Sychrova H (2013). Vhc1, a novel transporter belonging to the family of electroneutral cation-Cl(−) cotransporters, participates in the regulation of cation content and morphology of Saccharomyces cerevisiae vacuoles. Biochim Biophys Acta 1828, 623–631. [DOI] [PubMed] [Google Scholar]
- Pietrocola F, Galluzzi L, Bravo-San Pedro JM, Madeo F, and Kroemer G (2015). Acetyl coenzyme A: a central metabolite and second messenger. Cell Metab 21, 805–821. [DOI] [PubMed] [Google Scholar]
- Platt FM, d’Azzo A, Davidson BL, Neufeld EF, and Tifft CJ (2018). Lysosomal storage diseases. Nat Rev Dis Primers 4, 27. [DOI] [PubMed] [Google Scholar]
- Rajagopalan KN, Egnatchik RA, Calvaruso MA, Wasti AT, Padanad MS, Boroughs LK, Ko B, Hensley CT, Acar M, Hu Z, et al. (2015). Metabolic plasticity maintains proliferation in pyruvate dehydrogenase deficient cells. Cancer Metab 3, 7. [DOI] [PMC free article] [PubMed] [Google Scholar]
- Scheiber-Mojdehkar B, Lutzky B, Schaufler R, Sturm B, and Goldenberg H (2004). Non-transferrin-bound iron in the serum of hemodialysis patients who receive ferric saccharate: no correlation to peroxide generation. J Am Soc Nephrol 15, 1648–1655. [DOI] [PubMed] [Google Scholar]
- Senturk S, Shirole NH, Nowak DG, Corbo V, Pal D, Vaughan A, Tuveson DA, Trotman LC, Kinney JB, and Sordella R (2017). Rapid and tunable method to temporally control gene editing based on conditional Cas9 stabilization. Nat Commun 8, 14370. [DOI] [PMC free article] [PubMed] [Google Scholar]
- Siegert I, Schodel J, Nairz M, Schatz V, Dettmer K, Dick C, Kalucka J, Franke K, Ehrenschwender M, Schley G, et al. (2015). Ferritin-Mediated Iron Sequestration Stabilizes Hypoxia-Inducible Factor-1alpha upon LPS Activation in the Presence of Ample Oxygen. Cell Rep 13, 2048–2055. [DOI] [PubMed] [Google Scholar]
- Spinelli JB, Yoon H, Ringel AE, Jeanfavre S, Clish CB, and Haigis MC (2017). Metabolic recycling of ammonia via glutamate dehydrogenase supports breast cancer biomass. Science 358, 941–946. [DOI] [PMC free article] [PubMed] [Google Scholar]
- Subramanian A, Tamayo P, Mootha VK, Mukherjee S, Ebert BL, Gillette MA, Paulovich A, Pomeroy SL, Golub TR, Lander ES, et al. (2005). Gene set enrichment analysis: a knowledge-based approach for interpreting genome-wide expression profiles. Proc Natl Acad Sci U S A 102, 15545–15550. [DOI] [PMC free article] [PubMed] [Google Scholar]
- Tsherniak A, Vazquez F, Montgomery PG, Weir BA, Kryukov G, Cowley GS, Gill S, Harrington WF, Pantel S, Krill-Burger JM, et al. (2017). Defining a Cancer Dependency Map. Cell 170, 564–576e516. [DOI] [PMC free article] [PubMed] [Google Scholar]
- Vashisht AA, Zumbrennen KB, Huang X, Powers DN, Durazo A, Sun D, Bhaskaran N, Persson A, Uhlen M, Sangfelt O, et al. (2009). Control of iron homeostasis by an iron-regulated ubiquitin ligase. Science 326, 718–721. [DOI] [PMC free article] [PubMed] [Google Scholar]
- Wang T, Wei JJ, Sabatini DM, and Lander ES (2014). Genetic screens in human cells using the CRISPR-Cas9 system. Science 343, 80–84. [DOI] [PMC free article] [PubMed] [Google Scholar]
- Yan Y, Jiang K, Liu P, Zhang X, Dong X, Gao J, Liu Q, Barr MP, Zhang Q, Hou X, et al. (2016). Bafilomycin A1 induces caspase-independent cell death in hepatocellular carcinoma cells via targeting of autophagy and MAPK pathways. Sci Rep 6, 37052. [DOI] [PMC free article] [PubMed] [Google Scholar]
- Yang S, Wang X, Contino G, Liesa M, Sahin E, Ying H, Bause A, Li Y, Stommel JM, Dell’antonio G, et al. (2011). Pancreatic cancers require autophagy for tumor growth. Genes Dev 25, 717–729. [DOI] [PMC free article] [PubMed] [Google Scholar]
- Zhu XG, Nicholson Puthenveedu S, Shen Y, La K, Ozlu C, Wang T, Klompstra D, Gultekin Y, Chi J, Fidelin J, et al. (2019). CHP1 Regulates Compartmentalized Glycerolipid Synthesis by Activating GPAT4. Mol Cell 74, 45–58e47. [DOI] [PMC free article] [PubMed] [Google Scholar]
- Zoncu R, Bar-Peled L, Efeyan A, Wang S, Sancak Y, and Sabatini DM (2011). mTORC1 senses lysosomal amino acids through an inside-out mechanism that requires the vacuolar H(+)-ATPase. Science 334, 678–683. [DOI] [PMC free article] [PubMed] [Google Scholar]
Associated Data
This section collects any data citations, data availability statements, or supplementary materials included in this article.
Supplementary Materials
Table S1. Guide counts, Guide scores and gene scores from Jurkat ammonia negative pooled CRISPR screen, Related to Figure 1.
Table S2. Guide counts, Guide scores and gene scores from Jurkat BafA1 negative pooled CRISPR screen, Related to Figure 1.
Table S3. Guide counts, Guide scores and gene scores from KM26 ammonia negative pooled CRISPR screen, Related to Figure 1.
Table S4. FPKM values for RNA-seq experiments used for GSEA analyses. Related to Figure 5.
Table S5. Guide counts, Guide scores and gene scores from Jurkat Deferoxamine negative pooled CRISPR screen. Related to Figure 6.
Table S6. Primers and oligonucleotide sequences, Related to STAR methods.
Data Availability Statement
Raw data from RNA-sequencing experiments have been deposited in the Gene Expression Omnibus (GEO) and are available under accession code GSE141507. All other supporting data in this study are available from the Lead Contact on request.