

Abstract
Mathematical modeling of the UV disinfection process provides a basis for sizing ultraviolet disinfection equipment and for interpreting test results. It also allows for adaptation of UV systems to specific disinfection processes and for the disinfection of specific microorganisms. Disinfection is generally modeled in terms of the survival, or its converse the inactivation rate, and may be rendered as a fraction or a percentage. Disinfection is invariably a logarithmic process, as is microbial growth. The disinfection rate of the microorganisms varies widely and is subject to many complexities, including shoulder effects, second stage decay, relative humidity effects, and photoreactivation. Not all these processes need be considered for every design application, but a familiarity with these effects is essential for understanding UV disinfection. Furthermore, not all of these processes can be completely and accurately modeled at present, but enough is known to adequately design reliable UV disinfection systems. All of these processes can be modeled with basic exponential equations and by using computational methods if necessary. For more detailed background information on theoretical decay models for general disinfection purposes see Kowalski (2006), Chick et al. (1963), or Hiatt (1964).
Keywords: Resistant Fraction, High Relative Humidity, Serratia Marcescens, Stage Decay, Disinfection Process


Introduction
Mathematical modeling of the UV disinfection process provides a basis for sizing ultraviolet disinfection equipment and for interpreting test results. It also allows for adaptation of UV systems to specific disinfection processes and for the disinfection of specific microorganisms. Disinfection is generally modeled in terms of the survival, or its converse the inactivation rate, and may be rendered as a fraction or a percentage. Disinfection is invariably a logarithmic process, as is microbial growth. The disinfection rate of the microorganisms varies widely and is subject to many complexities, including shoulder effects, second stage decay, relative humidity effects, and photoreactivation. Not all these processes need be considered for every design application, but a familiarity with these effects is essential for understanding UV disinfection. Furthermore, not all of these processes can be completely and accurately modeled at present, but enough is known to adequately design reliable UV disinfection systems. All of these processes can be modeled with basic exponential equations and by using computational methods if necessary. For more detailed background information on theoretical decay models for general disinfection purposes see Kowalski (2006), Chick et al. (1963), or Hiatt (1964).
This chapter addresses the fundamental equations and modeling methods of UVGI disinfection processes, and these form a basis for the subsequent chapters. The modeling of UV equipment and UV lamps is addressed separately and in detail in 10.1007/978-3-642-01999-9_7, while the modeling of complete UV systems such as Upper Room systems and UV air disinfection systems is treated in later chapters.
UV Disinfection Modeling
The ultraviolet disinfection process may involve simple exponential decay, or a more complex function composed of two or more decay processes, a shoulder or delayed response, and photoreactivation. The entire process may also be subject to relative humidity effects. In addition, the exposure dose itself may be subject to variations from an uneven irradiance field (in air or on surfaces), and in the case of air disinfection there may be airflow irregularities. Each of these components of the disinfection process is describable with basic mathematical models as detailed in the following sections.
UV Exposure Dose (Fluence)
Microbes exposed to UV irradiation are subject to an exposure dose (fluence) that is a function of the irradiance multiplied by the exposure time, as follows:
 |
(3.1) |
where
D = UV exposure dose (fluence), J/m2
E t = exposure time, sec
I R = Irradiance, W/m2
The parameter I R can be used to refer to either irradiance, which is the radiative flux through a flat surface, or the fluence rate, which is the radiative flux through an external surface (i.e. a spherical microbe). In the latter case it is often called spherical irradiance. The same units apply in both cases and the choice of which term to use depends on the context. The fact that both types of irradiance have the units of W/m2 is an artifact of the method of measurement – in reality both the irradiation field and the microbial mass absorbing the dose exist in a volume and the irradiance should more properly have units of W/m3, and the proper units for UV rate constants would then be m3/J.
When the UV dose results in a 90% disinfection rate (10% survival), it is known as a D90. The D90 value is commonly used as an indicator of system size and can be used to assess the survival rate of individual microbes. Also common is the D99, or the dose that results in 99% inactivation.
In the case of surface exposure, the irradiance field may be relatively constant and Eq. (3.1) can be applied directly to get the UV dose. This is generally the case for equipment exposed inside a UV chamber, where the irradiance can be established with a high degree of certainty through measurement. If the irradiance forms a contour across a surface, such as a wall, floor, or cooling coil, then the surface can be subdivided and the total UV dose can be summed per unit area to get an area-weighted average dose. Since the irradiance field of a UV lamp on a surface can be subject to exponential variations, in which the near-field has a wide range of irradiance while the far field becomes relatively constant, it is often necessary to either use a very fine grid (i.e. 50 × 50 or 100 × 100) or to arrange the grid logarithmically so as to concentrate more gridlines in near-field areas of great variation.
For air disinfection, the same problem is encountered – large variation of irradiance in the near field of the UV lamp and gradual drop-off in the far field. In this case the same approach is used except that the irradiance field must be quantified in three dimensions instead of two. A computational model for a three-dimensional grid, as well as for two-dimensional grids, is presented in 10.1007/978-3-642-01999-9_7.
Single Stage Decay
The primary model used to evaluate the survival of microorganisms subject to UV exposure is the classical exponential decay model. This is a first-order decay rate model and is generally adequate for most UVGI design purposes provided the UV dose is within first order parameters. This is because disinfection rates of 90–99% can generally be achieved in the first stage of decay, and this is adequate for most design purposes. With few exceptions, a D90 value defines the first stage of decay for bacteria and viruses. The D90 value typically remains accurate up to a D99 or even higher, but extrapolation beyond this point is not always valid.
The single stage decay equation for microbes exposed to UV irradiation is:
 |
(3.2) |
where
S = Survival, fractional
k = UV rate constant, m2/J
This decay equation applies as long as shoulder effects can be ignored and the inactivation rate does not extend into the second stage. When exponential decay involves on a single stage, it is referred to as log-linear, since it is linear on a logarithmic scale. Figure 3.1illustrates the simple exponential decay of a bacteria exposed to UV irradiation. This data displays relatively log-linear decay and the UV rate constant computed from the exponential curve fit (the line in the figure) is seen to be 0.0701 m2/J.
Fig. 3.1.


Survival of Corynebacterium diphtheriae under exposure to UV irradiation. Based on data from Sharp (1939). Line is curve fit of the indicated exponential decay equation
The UV rate constant computed from the data in Fig. 3.1 will provide reasonable predictions within the upper limit of the test data, 40 J/m2, which represents a survival of about 7% (or a 93% inactivation rate). The D90 is seen to be about 33 J/m2. Extrapolating performance beyond the upper limit is not recommended as there may be a second stage. If a second stage exists then any extrapolation will produce non-conservative predictions.
The UV rate constant is always assumed to be single stage unless otherwise noted. High values of rate constants imply fast decay and rapid disinfection. Low rate constants imply UV resistance. Many bacteria and viruses have high rate constants, while fungal spores have low rate constants. Appendices A, B, and C may be consulted for representative values of k, which all represent single stage rate constants subject to the indicated upper limit (UL).
Two Stage Decay
It is commonly observed in most methods of disinfection that a tiny fraction of the microbial population exhibits a higher level of resistance, and the same is true in UV disinfection (Chick et al. 1963). When the exposure dose is sufficient to cause several logs of reduction (i.e. 99% disinfection or higher) in the microbial population, the surviving population is often an order of magnitude more resistant to UV. That is, the UV rate constant for the resistant population may be ten times lower than for the first stage. This effect will, of course, only be apparent if the disinfection rate is very high, sometime as much as six logs of disinfection. In effect, most microbial populations behave as if two separate populations were present – one relatively susceptible and one relatively resistant. The first stage of decay (fast decay) will then be defined by the susceptible portion of the population and the second stage of decay (slow decay) will be defined by the resistant population. Since the resistant fraction is often on the order of about 1% or less, the second stage only becomes manifest at about the D99 value or higher. An alternate model for two stage curves (or tailing effects) has been proposed in Hiatt (1964).
We define the resistant fraction as ‘f’ and the fast decay fraction is the complement, (1–f). We define the first stage (fast decay) rate constant as k 1 and the second stage (slow decay) rate constant as k 2. Note that k 1 > k 2 and that k 1 is not necessarily the same as k in Eq. (3.2) due to the additive effect of the second stage. The survival of the two populations is simply the sum of each decay rate computed per each contribution, as follows.
 |
(3.3) |
where
f = UV resistant fraction (slow decay)
k 1 = first stage rate constant, m2/J
k 2 = second stage rate constant, m2/J
Figure 3.2illustrates Eq. (3.3) for a figurative two stage decay curve, showing the first and second stages separately. Note that the point at which the second stage intercepts the y-axis is equivalent to the resistant fraction f. When actual data is plotted and separated, the second stage can be extrapolated to the y-axis to determine the resistant fraction f. The slope of the two stages can be estimated by dividing the decay curve into two separate sections and computing each per Eq. (3.2). The complete two stage curve can then be developed by incorporating the k values into Eq. (3.3) and adjusting k1 and k2 to fit the data by trial and error (and to minimize the R2 value).
Fig. 3.2.
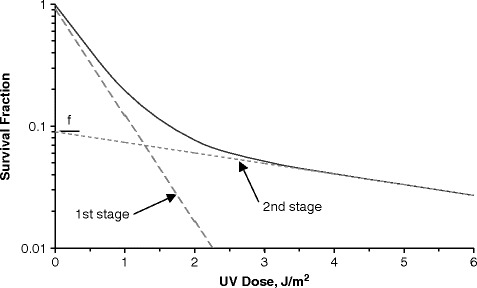

A two stage decay curve is the summation of the first and second stages proportioned by the resistant fraction f
Table 3.1summarizes the first and second stage rate constants and resistant fractions for a number of microbes. The original single stage rate constant (from Appendices A, B, and C) is provided for comparison. The first stage rate constant k 1 will differ from the original single stage rate constant k because the resistant fraction of the second stage, when added to the first stage per Eq. (3.3), will change the effective rate constant of the first stage to a degree that depends on the resistant fraction. Note that the value (1–f) almost always exceeds 90% (the D90) and often exceeds 99% (the D99).
Table 3.1.
Two stage inactivation rate constants
| k | Two stage curve | |||||||
|---|---|---|---|---|---|---|---|---|
| original | k1 | (1-f) | k2 | f | ||||
| Microorganism | Type | Media | μW/cm2 | μW/cm2 | Susc. | μW/cm2 | Resist. | Reference |
| Adenovirus Type 2 | Virus | W | 0.00470 | 0.00778 | 0.99986 | 0.00500 | 0.00014 | Rainbow and Mak (1973) |
| Bacillus anthracis spores | Bacteria | S | 0.0031 | 0.0042 | 0.9984 | 0.00060 | 0.0016 | Knudson (1986) |
| Bacillus subtilis spores | Bacteria | W | 0.0288 | 0.035 | 0.99997 | 0.00350 | 0.00003 | DeGuchi et al. (2005) |
| Coxsackievirus A-9 | Virus | W | 0.015900 | 0.01600 | 0.9807 | 0.01250 | 0.0193 | Hill et al. (1970) |
| Coxsackievirus B-1 | Virus | W | 0.020200 | 0.02480 | 0.7378 | 0.00881 | 0.2622 | Hill et al. (1970) |
| Escherichia coli | Bacteria | S | 0.092700 | 0.80980 | 0.9174 | 0.39470 | 0.0826 | Sharp (1939) |
| Escherichia coli | Bacteria | W | 0.18 | 0.22 | 0.999 | 0.04500 | 0.001 | Harris et al. (1987) |
| Fusarium oxysporum | Fungi | W | 0.0142 | 0.0155 | 0.999 | 0.00370 | 0.001 | Asthana and Tuveson (1992) |
| Herpes simplex virus Type 1 | Virus | W | 0.1105 | 0.08 | 0.996 | 0.01300 | 0.004 | Albrecht (1974) |
| Herpes simplex virus Type 1 | Virus | W | 0.0326 | 0.058 | 0.96 | 0.00650 | 0.04 | Bockstahler and Lytle (1976) |
| Human Cytomegalovirus | Virus | W | 0.01740 | 0.062 | 0.95 | 0.01600 | 0.05 | Albrecht (1974) |
| Legionella pneumophila | Bacteria | S | 0.44613 | 0.45 | 0.999 | 0.14000 | 0.001 | Knudson (1985) |
| Mycobateriophage D29 | phage | W | 0.143 | 0.18 | 0.99 | 0.01900 | 0.01 | David (1973) |
| Mycobacterium smegmatis | Bacteria | W | 0.034 | 0.038 | 0.999 | 0.00800 | 0.001 | Boshoff et al. (2003) |
| Mycobacterium tuberculosis | Bacteria | W | 0.031 | 0.04 | 0.997 | 0.01150 | 0.003 | Boshoff et al. (2003) |
| Penicillium italicum | Fungi | W | 0.0114 | 0.017 | 0.996 | 0.00500 | 0.004 | Asthana and Tuveson (1992) |
| Poliovirus type 1 | Virus | W | 0.0345 | 0.0365 | 0.997 | 0.01250 | 0.003 | Chang et al. (1985) |
| Reovirus | Virus | W | 0.00853 | 0.014 | 0.92 | 0.00430 | 0.08 | McClain and Spendlove (1966) |
| Rhizopus nigricans spores | Fungi | S | 0.0133 | 0.0285 | 0.92 | 0.00203 | 0.08 | Kowalski (2001) |
| Staphylococcus aureus | Bacteria | W | 0.08531 | 0.15 | 0.9998 | 0.00700 | 0.0002 | Chang et al. (1985) |
| Streptococcus pyogenes | Bacteria | S | 0.061600 | 0.28700 | 0.8516 | 0.01670 | 0.1484 | Lidwell and Lowbury (1950) |
Shoulder Curves
The exponential decay of a microbial population in response to biocidal factors like UV is often subject to a slight delay called a shoulder because of the shape (Cerf 1977, Munakata et al. 1991, Pruitt and Kamau 1993). Shoulder curves start out with a horizontal slope before developing into full exponential decay. The lag in response to the stimulus implies that either a threshold dose is necessary before measurable effects occur or that that repair mechanisms actively deal with low-level damage at low doses (Casarett 1968). Once the threshold is passed the exponential decay curve becomes fully developed (as a single stage or two stage curve). The effect is species dependent and also appears to be a function of the intensity of irradiation. In many cases it can be neglected, especially for susceptible microbes or for high doses. However, for low irradiance levels and for spores and certain resistant bacteria the shoulder can be significant and prolonged. There are at least two separate mathematical models that can deal with shoulder effects – the classic model, and the multihit target model (Kowalski et al. 2000). Various similar target models have been proposed, including recovery models, split-dose recovery models, and empirical models (Russell 1982, Harm 1980, Casarett 1968), but the multihit model, is the most convenient approach for most applications and it is the one addressed here. The multihit target model (Severin et al. 1983) can be written as follows:
 |
(3.4) |
where n = multitarget exponent
The parameter n can be found from extrapolating the first stage data to the y-intercept. It presumably represents the number of discrete critical sites that must be hit to inactivate the microorganism. In theory n is an integer, but in practice this is not always the case. The value of n is unique to each species and values may range from near-unity to over 1000. Figure 3.3shows data for UV-irradiated Staphylococcus in which a shoulder is evident. The rate constant, k = 0.1702 m2/J and the exponent value is n = 4.92. The extrapolated first stage is shown with a dotted line, where it can be seen that the y-axis is intercepted at the exponent of n = 4.92.
Fig. 3.3.


Survival curve for Staphylococcus aureus illustrating a shoulder. Solid line represents a curve fit to Eq. (3.3). Dotted line represents an extrapolation to the intercept, n = 4.92. Based on data from Sharp (1939)
Two Stage Shoulder Curves
Occasionally, a data set will exhibit both a shoulder and two stages of decay. The mathematical model for this combined curve is simply an incorporation of Eq. (3.4) in Eq. (3.3) as follows:
 |
(3.5) |
where
n 1 = exponent of fast decay population
n 2 = exponent of resistant fraction
It can be assumed that n1 = n2, and this would make sense if we assume that the number of ‘targets’ is a constant for any species, but the contribution due to the second stage (the resistant fraction) is so typically insignificant that it can virtually always be ignored. That is, it can be assumed that n2 = 1 without significant loss of accuracy, and Eq. (3.5) can be written as:
 |
(3.6) |
The complete model given by Eq. (3.6), which includes the shoulder and the second stage, requires two rate constants, one multihit exponent, and a population resistant fraction. Limited data is available in the literature to define such values for any but a handful of microbes, but Appendices A, B, and C note studies in which two stages and shoulders occur, and these may be consulted for data. Table 3.2lists a few examples of two stage curves with shoulders and the associated parameters. In general, the multihit exponent for the second stage rate constant has little or no effect and the indicated values for n2 in may be assumed to be unity without loss of predictive accuracy.
Table 3.2.
Two stage and multihit parameters
| Multihit Exponent | ||||||
|---|---|---|---|---|---|---|
| Microorganism | k1
m2/J |
k2
m2/J |
Res. Pop. (f) |
n1 | n2 | References |
| Adenovirus Type 2 | 0.0048 | 0.7784 | 0.0001 | 1.29 | 1.29 | Rainbow and Mak (1973) |
| Bacillus anthracis spores | 0.0042 | 0.0006 | 0.0016 | 2.6 | 2.6 | Knudson (1986) |
| Mycobacterium smegmatis | 0.0380 | 0.0080 | 0.00062 | 6 | 1 | Boshoff et al. (2003) |
| Mycobacterium tuberculosis | 0.0400 | 0.0115 | 0.012 | 30 | 1 | Boshoff et al. (2003) |
| Staphylococcus aureus | 0.0500 | 0.0108 | 0.0860 | 4.9 | 4.9 | Sharp (1939) |
The first and second stage rate constants computed from data can differ somewhat from the single stage rate constants due to the fact that the second stage and the shoulder, if any, will affect the first stage rate constant. This effect can be seen by the two stage curve data in Fig. 3.4. In Table 3.2, the rate constant for Mycobacterium tuberculosis based on fitting all the data to a single stage curve without a shoulder proved to be 0.035 m2/J. When a two stage curve with a shoulder is fitted to the same data, the first stage rate constant proves to be approximately 0.055 m2/J.
Fig. 3.4.


UV survival curve for Mycobacterium tuberculosis. Line represents a curve fit to a two stage multihit model. Based on data from Boshoff et al. (2003)
Relative Humidity Effects
In air and surface disinfection the relative humidity may impact the UV disinfection rate and therefore will affect the UV rate constant. The effect appears to be different in viruses than in bacteria and therefore these topics are treated separately in the following sections. Insufficient data is available to evaluate fungal and bacterial spores, but a summary is also provided for this topic.
RH Effects on Viruses
The effect of relative humidity on virus UV susceptibility is much less pronounced than it is in bacteria. Table 4.7 summarizes all the available data on RH effects for viruses and provides a ratio for dry to wet conditions. Except for Vaccinia, the ratio between Dry (Lo RH) and Wet (HI RH) conditions is not as great as it is in bacteria. In fact, these differences may be barely beyond the testing accuracy in most cases and therefore the conclusion that virus sensitivity decreases as RH increases must be considered a tenuous one until such time as more definitive data is accumulated on a larger number of viruses. Although DNA viruses go though a conformational change from the A form to the B form as RH increases, RNA viruses may not. RNA viruses are typically in the A conformation and if the conformation change is entirely responsible for RH effect, it could be expected that RNA viruses would not respond to RH changes. There is, however, a possible secondary effect from RH –increased bonding of water to the virus may increases the effective diameter and causes more UV scattering. Table 3.3shows two complete RNA virus test results but they are hardly conclusive.
Table 3.3.
Virus UV rate constants versus relative humidity
| UV k, m2/J | |||||||
|---|---|---|---|---|---|---|---|
| Microbe | Type | <68%RH | >75%RH | Water | Ratio Dry/Wet | Hi RH effect on UV k | Reference |
| Adenovirus | dsDNA | 0.039 | 0.068 | 0.006 | 0.6 | Increase | Walker and Ko (2007) |
| Vaccinia | dsDNA | 6.01 | 1.42 | 0.134 | 4.2 | Decrease | McDevitt et al. (2007) |
| phage T7 | dsDNA | 0.33 | 0.22 | 0.082 | 1.5 | Decrease | Tseng and Li (2005) |
| phage phi 6 | dsRNA | 0.43 | 0.31 | unk | 1.4 | Decrease | Tseng and Li (2005) |
| phage phi X174 | ssDNA | 0.71 | 0.53 | 0.111 | 1.3 | Decrease | Tseng and Li (2005) |
| Coronavirus | ssRNA | 0.377 | – | 0.149 | – | – | Walker and Ko (2007) |
| MS2 | ssRNA | 0.038 | 0.048 | 0.013 | 0.8 | Increase | Walker and Ko (2007) |
| MS2 | ssRNA | 0.81 | 0.64 | 0.013 | 1.3 | Decrease | Tseng and Li (2005) |
Figure 3.5illustrates the results of Table 3.3 where it can be observed that, except for Vaccinia, the UV susceptibilities show barely any significant response to increased RH. The decrease in UV rate constants from high RH to that in water are clearly more significant.
Fig. 3.5.


Variation of UV rate constant for viruses in Low to High RH, and compared to Water as an endpoint. Based on data from Table 3.2
RH Effects on Bacteria
Various sources state that increased Relative Humidity (RH) decreases the decay rate under UVGI exposure (Riley and Kaufman 1972). Lidwell and Lowbury (1950) showed the rate constant for Serratia marcescens decreasing with increasing RH. Rentschler and Nagy (1942) showed the rate constant for Streptococcus pyogenes increasing with higher RH. Fletcher et al. (2003), Fletcher (2004) showed the rate constant for Burkholderia cepacia decreases at higher RH. One study on three bacteria species indicates that the decay rate decreases with higher RH (Peccia et al. 2001a). Figure 3.6shows the effect of relative humidity on the rate constant of Serratia marcescens.
Fig. 3.6.


Effect of relative humidity on the rate constant of Serratia marcescens. Based on data from Peccia et al. (2001a)
Lai et al. (2004) obtained a similar response to high RH for S. marcescens as Peccia et al. (2001a) and others but demonstrated that the suspending solution used for aerosolization solution had a significant effect on the rate constant. They recommended that a synthetic saliva would more accurately account for real-world conditions.
In indoor environments, ASHRAE (1999) defines comfort zones as having an RH below 60% and this would be the design operating RH range of any UVGI system that recirculated room air or disinfected return air. In an air handling unit however, the RH could vary greatly depending on where the UVGI system was located (i.e. upstream or downstream of the cooling coils). Obviously, the nature of the RH effect on UV susceptibility may dictate the preferred location of any installed UVGI system, and may even allow a means of boosting UVGI efficiency through RH control, but further quantitative results on RH effects are needed.
Table 3.4summarizes the 13 complete studies on bacteria, of which 11 showed a statistically significant decrease in UV rate constants with increasing RH. The effect is broken down into categories of high (Hi) RH and low (Lo) RH to simplify interpretation. The two studies that imply an increase in UV rate constant showed an essentially flat response, within experimental error, and so are listed as having no effect.
Table 3.4.
Bacterial UV rate constants versus RH effects
| UV k, m2/J | ||||||
|---|---|---|---|---|---|---|
| Microbe | <68% RH | >75%RH | Water | Ratio Dry/Wet | Hi RH effect on UV k | Ref |
| E. coli | 0.218583 | 0.180527 | 0.154 | 1.2 | Decrease | Rentschler and Nagy (1942) |
| E. coli | 0.965188 | 0.204733 | 0.154 | 4.7 | Decrease | Koller (1939) |
| E. coli | 0.72303 | 0.217862 | 0.154 | 3.3 | Decrease | Webb and Tai (1970) |
| M. parafortuitum | 0.18 | 0.05 | unk | 3.6 | Decrease | Peccia and Hernandez (2001) |
| M. parafortuitum | 0.061333 | 0.0415 | unk | 1.5 | Decrease | Peccia et al. (2001a) |
| Francisella tularensis | 0.008953 | 0.00795 | unk | 1.1 | None | Beebe (1959) |
| Serratia marcescens 1 | 0.595 | 0.864 | 0.077 | 0.7 | Increase | Riley and Kaufman (1972)* |
| Serratia marcescens 2 | 0.45 | 0.07 | 0.077 | 6.4 | Decrease | Peccia and Hernandez (2001) |
| Serratia marcescens 3 | 2.2 | 0.92 | 0.077 | 2.4 | Decrease | Lai et al. (2004) |
| Serratia marcescens 4 | 0.9389 | 0.0949 | 0.077 | 9.9 | Decrease | Fletcher et al. (2003) |
| Serratia marcescens 5 | 0.3 | 0.1 | 0.077 | 3.0 | Decrease | Peccia et al. (2001a) |
| Serratia marcescens 6 | 0.57 | – | 0.077 | – | None | Ko et al. (2000) |
| Serratia marcescens 7 | 0.113 | 0.01835 | 0.077 | 6.2 | Decrease | Webb and Tai (1970) |
| Streptococcus pyogenes | 0.146667 | 0.16 | 0.105 | 0.9 | None | Lidwell and Lowbury (1950) |
| Staphylococcus epidermis | 0.024 | 0.008 | 0.014 | 3.0 | Decrease | VanOsdell and Foarde (2002) |
| Average for bacteria | 0.4996 | 0.2098 | – | 3.4 | Decrease | * (revised by author) |
Table 3.4 also compares the results of these studies on airborne rate constants with averages for water-based rate constants. Figure 3.7 illustrates the results of Table 3.4 in the form of a plot as the relative humidity goes from low to high, and then to the water-based rate constant as an endpoint. It has been suggested in the literature that airborne rate constants at 100% RH converge towards water rate constants. Although it would be convenient if the UV rate constant at 100% RH equaled the UV rate constant in water there is no conclusive evidence that this occurs. In fact, photoprotective effects due to UV scattering in air (refractive index = 1.0003) must be different from those in water (refractive index = 1.33) and therefore even at 100% RH the UV rate constant in air is unlikely to be identical to that in water. It can be concluded that, in general, UV rate constants in air at high RH converge towards those in water, but are not necessarily identical at 100% RH.
Fig. 3.7.


Plot of bacteria UV rate constant variation between low and high RH, and in water as an endpoint. Based on data from Table 3.3
Figure 3.8presents a detailed plot summarizing the results for the various studies on Serratia marcescens. It can be seen that there are wide variations in the measured UV rate constants in these studies and that although most of them indicate an increased susceptibility with increasing RH, one of them indicates the opposite. In this case, when the UV rate constant for water is placed at the 100% RH point, it is suggestive of the possibility that the UV rate constant for Serratia converges to that of water and will equal it at 100% RH, although this has yet to be conclusively demonstrated.
Fig. 3.8.


Variation of UV k with RH for various studies on Serratia marcescens (numbered as per Table 3.4). Average rate constant in water is shown as a single point at 100% RH
The data sets presented previously indicate that the response to RH may be one that increases, decreases, remains unchanged, or even presents a maxima. These variations in responses have posed difficulties when it comes to modeling, but the key to accurately modeling these RH effects lies in defining a model composed of components, each of which may rise or decrease in response to RH. Since the RH effect is generally understood to be mainly a function of both thymine dimers and spore photoproducts, it can be modeled as two components that will sum to produce an overall response curve. In fact, there are probably additional components, but as a first order model, if we assume that the RH effect is due only to these two factors, the combined equation for the rate constant can be written as follows:
 |
(3.7) |
where
k t = contribution to k from thymine dimers, m2/J
k s = contribution to k from spore photoproducts, m2/J
Each of these contributions can be modeled as simple sigmoid curves, as a function of humidity, H. The contribution to the rate constant from thymine is:
 |
(3.8) |
where
k min, k max = minimum k value, maximum k value
M = Mean humidity value
B t = species constant for thymine dimers
The contribution to the rate constant from spore photoproduct is:
 |
(3.9) |
where B s = species constant for spore photoproduct
Figure 3.9 shows an example of the RH effects on Mycobacterium parafortuitum, with two sigmoid curves fitted such that the summation of the contribution to the UV rate constant value matches the measured values for UV k.
Fig. 3.10.


Variation of UV k with RH for Serratia marcescens, based on data from Peccia et al. (2001a). Theoretical contributions from spore photoproduct and thymine dimers are shown in dotted lines. Solid line is a summation of the contributions
Fig. 3.9.


Variation of UV k with RH for Mycobacterium parafortuitum, based on data from Peccia et al. (2001a). Theoretical contributions from spore photoproduct and thymine dimers are shown in dotted lines. Solid line is a summation of the contributions
The previous model is simplistic but does provide a means to explain much of the existing data on RH effects. Whether or not this theoretical model for relative humidity effects on RH is valid or not remains to be verified by future research. It should be noted, however, that this model has only addressed two components, thymine dimers and the spore photoproduct, whereas there may actually be some additional components (i.e. cytosine dimers) that also contribute to relative humidity effects, and a more complete multifunctional model can be developed when sufficient data becomes available.
RH Effects on Bacterial and Fungal Spores
There is little data available that would allow generalization of the effects of relative humidity in fungal spores. Zahl et al. (1939) reports no relative humidity effects on Aspergillus niger, and it is likely this is a general characteristic of all fungal spores since in fungal spores the DNA is maintained in the A conformation and it could be expected that, if DNA conformation plays a major role in RH response, that fungi would have little or no response to changing RH levels. VanOsdell and Foarde (2002), however, report that the UV susceptibility of Aspergillus niger spores decreases by a factor of two from low humidity to high humidity.
Two studies on Bacillus subtilis spores have indicated they have no response to increases in RH (Peccia et al. 2001a, VanOsdell and Foarde 2002). It is likely that bacterial spores are maintained in a dry (A conformation) state in the same way as fungal spores and therefore it could be expected that RH effects would not alter the UV susceptibility. But, the lack of any further data on the effects of RH on UV susceptibility of spore prevents any definitive conclusions form being drawn at this time.
Modeling Photoreactivation
Another factor that impacts disinfection modeling is the phenomenon of photoreactivation. Photoreactivation occurs when microorganisms are exposed to visible light during or after UV irradiation (Setlow and Carrier 1966, Fletcher et al. 2003). This process can result in self-repair of damaged microbes and can cause a fraction of the population to recover from UV inactivation. Photoreactivation has been studied at length in water-based UV experiments but the data for photoreactivation of airborne microbes is limited at present (Linden and Darby 1994, Masschelein 2002). One study indicates the decay rate of Mycobacterium parafortuitum under UV exposure in liquid suspension is effectively decreased by simultaneous exposure to visible light (Peccia and Hernandez 2001). The same study suggests that airborne microbial populations can recover significantly if allowed sufficient time. Knudson (1986) investigated the photoreactivation of Bacillus anthracis and found that although vegetative cells had a 1–2 log higher survival rate after exposure to photoreactivating light, the spore forms had no detectable photoreactivation.
Some general considerations for the design of UVGI systems can be given based on what is known about the photoreactivation effect. Ideally, the RH would be kept below approximately 65% in any UVGI system, and the UVGI enclosure should admit little or no internal visible light. Studies on photoreactivation generally involve narrow band UVC lamps, whereas the evidence suggests that broad band UV lamps inhibit photoreactivation (Masschelein 2002). Damage to the enzymes needed for photoreactivation may occur more easily under broadband UVC/UVB radiation, since the peak absorption efficiency for enzymes is at higher wavelengths than that for DNA. Harm (1980) showed that absorption by proteins in the UVA and UVB region equaled the absorption by DNA at 265 nm. Hu et al. (2005) have shown that the DNA of Escherichia coli was repaired following irradiation with a low pressure, narrow-band UV lamp while there was no photorepair following irradiation with a medium pressure, broad-band UV lamp. Zimmer and Slawson (2002) found that high levels of photorepair, peaking after 2–3 hours, occurred in E. coli after exposure from low pressure lamps, virtually no photorepair occurred after exposure from medium pressure lamps.
Theoretically, photorepair can be preempted by using high enough levels of UV exposure (even with low pressure UV lamps) to cause such extensive damage that no photorepair mechanisms will operate. Coliform bacteria experience little or no repair after exposure to higher UV doses (Linden and Darby 1994).
Photoreactivation effects are generally measured by comparing the survival curves of microbes irradiated under dark and light conditions. The increased survival rates of photoreactivated microbe can be compared directly in terms of their respective UV rate constants. This approach assumes that the inactivation curve consists of two parts – one that can be photoreactivated and one that cannot. Zelle et al. (1958) described the photoreactivation of E. coli in terms of the ratio of photoreactivation in the dark to that in light. Hollaender (1955) compared the absolute slope (ignoring the shoulder) of the survival curves of photoreactivated phages with a ratio called the photoreactivable sector, a, defined as follows:
 |
(3.10) |
where
k p = absolute slope of survival curve after photoreactivation, m2/J
k d = absolute slope of survival curve in darkness, m2/J
The photoreactivable sectors for T1 and T2 phages were relatively high (measured as 0.68 and 0.56 respectively), while lower values were obtained for T4 and T7 phages (0.20 and 0.35 respectively). Sanz et al. (2007) investigated the photoreactivation of coliforms in water and has developed a model in which photoreactivation is quantified in terms of specific parameters that include a reactivation rate constant. Quek and Hu (2008) found that photorepair in E. coli occurred at a rate of 10–85% and defined the percent photorepair (%P) as follows:
 |
(3.11) |
where
N t = concentration at time of exposure, cfu/ml
N 0 = concentration following UV inactivation, cfu/ml
N init = initial concentration before disinfection, cfu/ml
Nebot et al. (2007) modeled photoreactivation in terms of first and second order reactivation constants. They found that photoreactivation was less than 0.1% in the dark, and modeled this type of photoreactivation with a zero-order rate constant. Photorepair is generally found to be higher at lower UV doses (Hu et al. 2005). The degree of photoreactivation depends on the available light energy after UV exposure as well as the relative humidity. Tosa and Hirata (1999) found that photoreactivation was achieved in E. coli at 2 W/m2 and varied from 20 to 78%. Peccia and Hernandez (2001) found that photoreactivation of Mycobacterium parafortuitum was only observed when RH above 80% and that no photoreactivation was detectable below 65% RH. Fletcher et al. (2003) found that photoreactivation of Serratia marcescens occurred over a wide range of UV doses and increased at lower RH. Photoreactivation occurred at a rate of 56% in M. tuberculosis and at 40% in M. marinum, at UV doses that produced 2–4 logs of inactivation, by David et al. (1971). Harris et al. (1987) demonstrated photoreactivation in E. coli and Streptococcus faecalis and stated that the UV doses for 99.9% inactivation were approximately double when photoreactivation occurred.
Jagger et al. (1970) investigated the action spectrum for photoreactivation in S. griseus and found that the effect was wavelength-dependent and temperature dependent with peaks at 313 nm and 436 nm. A second microbe, S. coelicolor, was found to have a photoreactivation peak at 313 nm but no temperature dependence. Knudson (1985) found that photoreactivation in various species of Legionella increased survival about 2–4 times when inactivation levels were 90–99.9%. Oguma et al. (2001) exposed Cryptosporidium parvum to fluorescent light after UV inactivation and determined that although pyrimidine dimers were continuously repaired under the near-UV light, the infectivity of the pathogen did not recover.
In conclusion, if photoreactivation occurs, it is essentially incorporated into the measured rate constant of any microbe, depending on test conditions, and therefore ignoring the effect may be a necessity most of the time. For modeling purposes, the photoreactivation effect can be viewed as either an increase in the effective rate constant or as a separate growth rate curve added to the decay curve.
Air Temperature Effects
The air temperature has a negligible impact on microbial survival during UVGI irradiation provided that neither heat damage nor freezing occurs (Rentschler et al. 1941). It is possible that high indoor temperatures combined with high humidity may alter the effects of UV to some unknown degree. Most building ventilation systems maintain air temperatures in a narrow range between approximately 13–27°C (55–80°F) and moderate relative humidity (<70%), and therefore the effect of temperature on microbes can be ignored. However, air temperature may impact UV lamp output by overcooling the lamp, especially when air velocity is beyond design limits. See 10.1007/978-3-642-01999-9_5 for information on modeling lamp cooling effects.
References
- Albrecht T. Multiplicity reactivation of human cytomegalovirus inactivated by ultra-violet light. Biochim Biophys Acta. 1974;905:227–230. doi: 10.1080/09553007414551471. [DOI] [PubMed] [Google Scholar]
- ASHRAE. 1999. Handbook of Applications. Atlanta: ASHRAE.
- Asthana A., Tuveson RW. Effects of UV and phototoxins on selected fungal pathogens of citrus. Int J Plant Sci. 1992;153(3):442–452. doi: 10.1086/297050. [DOI] [Google Scholar]
- Beebe JM. Stability of disseminated aerosols of Pastuerella tularensis subjected to simulated solar radiations at various humidities. J Bacteriol. 1959;78:18–24. doi: 10.1128/jb.78.1.18-24.1959. [DOI] [PMC free article] [PubMed] [Google Scholar]
- Bockstahler LE., Lytle CD., Stafford JE., Haynes KF. Ultraviolet enhanced reactivation of a human virus: Effect of delayed infection. Mutat Res. 1976;35:189–198. doi: 10.1016/0027-5107(76)90184-6. [DOI] [PubMed] [Google Scholar]
- Boshoff HIM., Reed MB., Barry CE., Mizrahi V. DnaE2 polymerase contributes to in vivo survival and the emergence of drug resistance in Mycobacterium tuberculosis. Cell. 2003;113:183–193. doi: 10.1016/S0092-8674(03)00270-8. [DOI] [PubMed] [Google Scholar]
- Casarett AP. Radiation Biology. Prentice-Hall: Englewood; 1968. [Google Scholar]
- Cerf O. A review: Tailing of survival curves of bacterial spores. J Appl Bact. 1977;42:1–19. doi: 10.1111/j.1365-2672.1977.tb00665.x. [DOI] [PubMed] [Google Scholar]
- Chang JCH., Ossoff SF., Lobe DC., Dorfman MH., Dumais CM., Qualls RG., Johnson JD. UV inactivation of pathogenic and indicator microorganisms. Appl & Environ Microbiol. 1985;49(6):1361–1365. doi: 10.1128/aem.49.6.1361-1365.1985. [DOI] [PMC free article] [PubMed] [Google Scholar]
- Chick EW A.B., Hudnell J., Sharp DG. Ultraviolet sensitivity of fungi associated with mycotic keratitis and other mycoses. Sabouviad. 1963;2(4):195–200. [Google Scholar]
- David HL., Jones WD., Newman CM. Ultraviolet light inactivation and photoreactivation in the mycobacteria. Infect and Immun. 1971;4:318–319. doi: 10.1128/iai.4.3.318-319.1971. [DOI] [PMC free article] [PubMed] [Google Scholar]
- David HL. Response of mycobacteria to ultraviolet radiation. Am Rev Resp Dis. 1973;108:1175–1184. doi: 10.1164/arrd.1973.108.5.1175. [DOI] [PubMed] [Google Scholar]
- Deguchi K., Yamaguchi S., Ishida H. UV-disinfection reactor validation by computational fluid dynamics and relation to biodosimetry and actinometry. J Wat Technol Environ Technol. 2005;3(1):77–84. doi: 10.2965/jwet.2005.77. [DOI] [Google Scholar]
- Fletcher LA., Noakes CJ., Beggs CB., Sleigh PA., Kerr KG. The ultraviolet susceptibility of aerosolised microorganisms and the role of photoreactivation; IUVA: Vienna; 2003. [Google Scholar]
- Fletcher L. The influence of relative humidity on the UV susceptibility of airborne gram negative bacteria. IUVA News. 2004;6(1):12–19. [Google Scholar]
- Harm W. Biological effects of ultraviolet radiation. New York: Cambridge University Press; 1980. [Google Scholar]
- Harris GD., Adams VD., Sorenson DL., Curtis MS. Ultraviolet inactivation of selected bacteria and viruses with photoreactivation of the bacteria. Water Res. 1987;21(6):687–692. doi: 10.1016/0043-1354(87)90080-7. [DOI] [Google Scholar]
- Hiatt C. Kinetics of the inactivation of viruses. Bact Rev. 1964;28(2):150–163. doi: 10.1128/br.28.2.150-163.1964. [DOI] [PMC free article] [PubMed] [Google Scholar]
- Hill WF., Hamblet FE., Benton WH., Akin EW. Ultraviolet devitalization of eight selected enteric viruses in estuarine water. Appl Microb. 1970;19(5):805–812. doi: 10.1128/am.19.5.805-812.1970. [DOI] [PMC free article] [PubMed] [Google Scholar]
- Hollaender A. Radiation Biology, Volume II: Ultraviolet and Related Radiations. New York: McGraw-Hill; 1955. [Google Scholar]
- Hu JY., Chu SN., Quek PH., Feng YY., Tang XL. Repair and regrowth of Escherichia coli after low- and medium-pressure ultraviolet disinfection. Wat Sci Technol. 2005;5(5):101–108. doi: 10.2166/wst.2006.184. [DOI] [PubMed] [Google Scholar]
- Jagger J., Takebe H., Snow JM. Photoreactivation of killing in Streptomyces: Action spectra and kinetic studies. Photochem Photobiol. 1970;12:185–196. doi: 10.1111/j.1751-1097.1970.tb06050.x. [DOI] [PubMed] [Google Scholar]
- Knudson GB. Photoreactivation of UV-irradiated Legionella pneumophila and other Legionella species. Appl & Environ Microbiol. 1985;49(4):975–980. doi: 10.1128/aem.49.4.975-980.1985. [DOI] [PMC free article] [PubMed] [Google Scholar]
- Knudson GB. Photoreactivation of ultraviolet-irradiated, plasmid-bearing, and plasmid-free strains of Bacillus anthracis. Appl & Environ Microbiol. 1986;52(3):444–449. doi: 10.1128/aem.52.3.444-449.1986. [DOI] [PMC free article] [PubMed] [Google Scholar]
- Ko G., First MW., Burge HA. Influence of relative humidity on particle size and UV sensitivity of Serratia marcescens and Mycobacterium bovis BCG aerosols. Tuber Lung Dis. 2000;80(4/5):217–228. doi: 10.1054/tuld.2000.0249. [DOI] [PubMed] [Google Scholar]
- Koller LR. Bactericidal effects of ultraviolet radiation produced by low pressure mercury vapor lamps. J Appl Phys. 1939;10:624. doi: 10.1063/1.1707353. [DOI] [Google Scholar]
- Kowalski WJ., Bahnfleth WP., Witham DL., Severin BF., Whittam TS. Mathematical modeling of UVGI for air disinfection. Quant Microbiol. 2000;2(3):249–270. doi: 10.1023/A:1013951313398. [DOI] [Google Scholar]
- Kowalski WJ. Design and Optimization of UVGI Air Disinfection Systems [PhD] State College: The Pennsylvania State University; 2001. [Google Scholar]
- Kowalski WJ. Aerobiological Engineering Handbook: A Guide to Airborne Disease Control Technologies. New York: McGraw-Hill; 2006. [Google Scholar]
- Lai KM., Burge H., First MW. Size and UV germicidal irradiation susceptibility of Serratia marcescens when aerosolized from different suspending media. Appl Environ Microbiol. 2004;70(4):2021–2027. doi: 10.1128/AEM.70.4.2021-2027.2004. [DOI] [PMC free article] [PubMed] [Google Scholar]
- Lidwell OM., Lowbury EJ. The survival of bacteria in dust. Ann Rev Microbiol. 1950;14:38–43. doi: 10.1017/s0022172400014881. [DOI] [PMC free article] [PubMed] [Google Scholar]
- Linden KG., Darby JL. Ultraviolet disinfection of wastewater: effect of dose on subsequent reactivation. Water Res. 1994;28:805–817. doi: 10.1016/0043-1354(94)90087-6. [DOI] [Google Scholar]
- Masschelein WJ. Ultraviolet Light in Water and Wastewater Sanitation. Boca Raton: Lewis Publishers; 2002. [Google Scholar]
- McClain ME., Spendlove RS. Multiplicity reactivation of Reovirus particles after exposure to ultraviolet light. J Bact. 1966;92(5):1422–1429. doi: 10.1128/jb.92.5.1422-1429.1966. [DOI] [PMC free article] [PubMed] [Google Scholar]
- McDevitt JJ., Lai KM., Rudnick SN., Houseman EA., First MW., Milton DK. Characterization of UVC light sensitivity of vaccinia virus. Appl Environ Microbiol. 2007;73(18):5760–5766. doi: 10.1128/AEM.00110-07. [DOI] [PMC free article] [PubMed] [Google Scholar]
- Munakata N., Saito M., Hieda K. Inactivation action spectra of Bacillus subtilis spores in extended ultraviolet wavelengths (50–300 nm) obtained with synchrotron radiation. Photochem & Photobiol. 1991;54(5):761–768. doi: 10.1111/j.1751-1097.1991.tb02087.x. [DOI] [PubMed] [Google Scholar]
- Nebot SE., Davila IS., Andrade JAA., Alonso JMQ. Modelling of reactivation after UV disinfection: effect of UV-C dose on subsequent photoreactivation and dark repair. Water Res. 2007;41(14):3141–3151. doi: 10.1016/j.watres.2007.04.008. [DOI] [PubMed] [Google Scholar]
- Oguma K., Katayama H., Mitani H., Morita S., Hirata T., Ohgaki S. Determination of pyrimidine dimers in Escherichia coli and Cryptosporidium parvum during UV light inactivation, photoreactivation, and dark repair. Appl Environ Microbiol. 2001;67(10):4630–4637. doi: 10.1128/AEM.67.10.4630-4637.2001. [DOI] [PMC free article] [PubMed] [Google Scholar]
- Peccia J., Hernandez M. Photoreactivation in airborne Mycobacterium parafortuitum. Appl Environ Microbiol. 2001;67:4225–4232. doi: 10.1128/AEM.67.9.4225-4232.2001. [DOI] [PMC free article] [PubMed] [Google Scholar]
- Peccia J., Werth HM., Miller S., Hernandez M. Effects of relative humidity on the ultraviolet induced inactivation of airborne bacteria. Aerosol Sci & Technol. 2001;35:728–740. doi: 10.1080/02786820152546770. [DOI] [Google Scholar]
- Pruitt KM., Kamau DN. Mathematical models of bacterial growth, inhibition and death under combined stress conditions. J Ind Microb. 1993;12:221–231. doi: 10.1007/BF01584194. [DOI] [Google Scholar]
- Quek PH, Hu J. Indicators for photoreactivation and dark repair studies following ultraviolet disinfection. J Ind Microbiol Biotechnol. 2008;35(6):533–541. doi: 10.1007/s10295-008-0314-0. [DOI] [PubMed] [Google Scholar]
- Rainbow AJ., Mak S. DNA damage and biological function of human adenovirus after UV irradiation. Int J Radiat Biol. 1973;24(1):59–72. doi: 10.1080/09553007314550821. [DOI] [PubMed] [Google Scholar]
- Rentschler HC., Nagy R., Mouromseff G. Bactericidal effect of ultraviolet radiation. J Bacteriol. 1941;42:745–774. doi: 10.1128/jb.41.6.745-774.1941. [DOI] [PMC free article] [PubMed] [Google Scholar]
- Rentschler HC., Nagy R. Bactericidal action of ultraviolet radiation on air-borne microorganisms. J Bacteriol. 1942;44:85–94. doi: 10.1128/jb.44.1.85-94.1942. [DOI] [PMC free article] [PubMed] [Google Scholar]
- Riley RL., Kaufman JE. Effect of relative humidity on the inactivation of airborne Serratia marcescens by ultraviolet radiation. Appl Microbiol. 1972;23(6):1113–1120. doi: 10.1128/am.23.6.1113-1120.1972. [DOI] [PMC free article] [PubMed] [Google Scholar]
- Russell AD. The Destruction of Bacterial Spores. New York: Academic Press; 1982. [Google Scholar]
- Sanz EN., Davila IS., Balao JAA., Alonso JMQ. Modelling of reactivation after UV disinfection: Effect of UV-C dose on subsequent photoreactivation and dark repair. Wat Res. 2007;41:3141–3151. doi: 10.1016/j.watres.2007.04.008. [DOI] [PubMed] [Google Scholar]
- Setlow JK. Photoreactivation. Radiat Res Suppl. 1966;6:141–155. doi: 10.2307/3583554. [DOI] [PubMed] [Google Scholar]
- Setlow RB., Carrier WL. Pyrimidine dimers in ultraviolet-irradiated DNA's. J Mol Biol. 1966;17:237–254. doi: 10.1016/S0022-2836(66)80105-5. [DOI] [PubMed] [Google Scholar]
- Severin BF., Suidan MT. Englebrecht RS. Kinetic modeling of UV disinfection of water Water Res. 1983;17(11):1669–1678. [Google Scholar]
- Sharp G. The lethal action of short ultraviolet rays on several common pathogenic bacteria. J Bact. 1939;37:447–459. doi: 10.1128/jb.37.4.447-460.1939. [DOI] [PMC free article] [PubMed] [Google Scholar]
- Tosa K, Hirata T. Photoreactivation of enterohemorrhagic Escherichia coli following UV disinfection. Wat Res. 1999;33(2):361–366. [Google Scholar]
- Tseng C-C., Li C-S. Inactivation of virus-containing aerosols by ultraviolet germicidal irradiation. Aerosol Sci Technol. 2005;39:1136–1142. doi: 10.1080/02786820500428575. [DOI] [Google Scholar]
- VanOsdell D., Foarde K. Defining the Effectiveness of UV Lamps Installed in Circulating Air Ductwork. Arlington, VA: Air-Conditioning and Refrigeration Technology Institute. Report nr ARTI-21CR/610-40030-01; 2002. [Google Scholar]
- Walker CM., Ko G. Effect of ultraviolet germicidal irradiation on viral aerosols. Environ Sci Technol. 2007;41(15):5460–5465. doi: 10.1021/es070056u. [DOI] [PubMed] [Google Scholar]
- Webb SJ., Tai CC. Differential, lethal and mutagenic action of 254 nm and 320–400 nm radiation on semi-dried bacteria. Photochem Photobiol. 1970;12:119–143. doi: 10.1111/j.1751-1097.1970.tb06045.x. [DOI] [PubMed] [Google Scholar]
- Zahl PA., Koller LR., Haskins CP. The effects of ultraviolet radiation on spores of the fungus Aspergillus niger. J Gen Physiol. 1939;16:221–235. doi: 10.1085/jgp.22.6.689. [DOI] [PMC free article] [PubMed] [Google Scholar]
- Zelle MR., Ogg JE., Hollaender A. Photoreactivation of induced mutation and inactivation of Escherichia coli exposed to various wave lengths of monochromatic ultraviolet radiation. J Bact. 1958;75(2):190–198. doi: 10.1128/jb.75.2.190-198.1958. [DOI] [PMC free article] [PubMed] [Google Scholar]
- Zimmer JL., Slawson RM. Potential repair of Escherichia coli following exposure to UV radiation from both medium- and low-pressure UV sources used in drinking water treatment. Appl Environ Microbiol. 2002;68(7):3293–3299. doi: 10.1128/AEM.68.7.3293-3299.2002. [DOI] [PMC free article] [PubMed] [Google Scholar]