

Abstract
In recent years, mechanics has experienced a revival, as microfabrication technologies and nanotechnology are applied to produce tiny structures. The development of ultraprecise position sensing started three decades ago with a novel imaging technique called atomic force microscopy, which provides ultrahigh topography resolution on the atomic scale by raster-scanning the surface with a microfabricated cantilever beam that has a tiny tip at its free end. The high force sensitivity can not only be used for imaging, but also allows the measurement of surface forces during molecule adsorption processes on the cantilever surface, thus enabling cantilevers to act as chemical sensors. Because of their small size, cantilevers allow fast and reliable detection of small concentrations of molecules in air and solution. In addition to artificial nose and label-free biosensing applications, they have also been employed to measure physical properties of tiny amounts of materials in miniaturized versions of conventional standard techniques such as calorimetry, thermogravimetry, weighing, photothermal spectroscopy and monitoring of chemical reactions. In the past few years, the cantilever-sensor concept has been extended to medical applications and has entered clinics for pilot studies on patients. The small size and scalability of cantilever array sensors might turn out to be advantageous for diagnostic screening applications and disease monitoring, as well as for genomics or proteomics. Using microcantilever arrays allows simultaneous detection of several analytes and solves the inherent problem of thermal drifts often present when using single microcantilever sensors, as some of the cantilevers can be used as sensor cantilevers for detection, and others as passivated reference cantilevers that do not show affinity to the molecules to be detected.
Technique
Sensors are devices that detect, or sense, changes in the environment and produce a measurable output signal. Moreover, a sensor is also a transducer , i. e., it transforms one form of energy into another. Most people will associate sensors with electrical or electronic devices that respond by a signal change when an external physical parameter is changed. Many more types of transducers exist, such as electrochemical (pH probe), electromechanical (piezoelectric actuator, quartz, strain gauge), electroacoustic (gramophone pick-up, microphone), photoelectric (photodiode, solar cell), electromagnetic (antenna), magnetic (Hall-effect sensor, hard-disk head for storage applications), electrostatic (electrometer), thermoelectric (thermocouple, thermo-resistors), and electrical (capacitor, resistor). Here we focus on a further type of sensor not yet mentioned: the mechanical sensor. It responds to changes of an external parameter, such as temperature variations or molecule adsorption, by a mechanical response, e. g., by bending or deflection.
Cantilevers
Mechanical sensors consist of a fixed and a movable part. The movable part can be a thin membrane, a plate or a beam, fixed at one or both ends. The structures described here are called cantilevers. A cantilever is defined here as a microfabricated rectangular bar-shaped structure that is longer than it is wide and has a thickness that is much smaller than its length or width. It is a horizontal structural element supported only at one end on a chip body; the other end is free (Fig. 15.1). Most often it is used as a mechanical probe to image the topography of a sample in a technique called atomic force microscopy (AFM ) or scanning force microscopy (SFM ) [15.1], invented by Binnig et al. in the mid 1980s [15.1]. For AFM a microfabricated sharp tip is located at the apex of the cantilever that serves as a local probe to scan the sample surface. The distance between tip and surface is controlled via sensitive measurement of interatomic forces in the piconewton range.
Fig. 15.1.
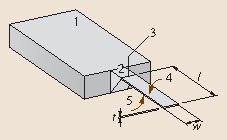

Schematic of a cantilever: (1) rigid chip body, (2) solid cantilever support structure, (3) hinge of cantilever, (4) upper surface of the cantilever that is usually functionalized with a sensor layer for detection of molecules, (5) lower surface of the cantilever, usually passivated in order not to show affinity to the molecules to be detected. The geometrical dimensions, length l, width w and thickness t, are indicated
By scanning the tip across a conductive or nonconductive surface using an x-y-z actuator system (e. g., a piezoelectric scanner), an image of the topography is obtained by recording for all positions x and y the correction signal that has to be applied to the z-actuation drive to keep the interaction between tip and sample surface constant. SFM methods are well established in scientific research, education and, to a certain extent, also in industry. Beyond imaging of surfaces, cantilevers have been used for many other purposes, e. g., structuring of surfaces. Here, we focus on the application as mechanical sensor devices, responding by mechanical bending or change in resonance frequency.
History of Cantilever Sensors
The idea to use beams of silicon as sensors to measure deflections or changes in resonance frequency is actually quite old. First reports go back to 1968, when Wilfinger et al. [15.2] investigated silicon cantilever structures of , i. e., quite large cantilever beams, for detecting resonances. On the one hand, they took advantage of localized thermal expansion in diffused resistors (piezoresistors) located near the cantilever support to create a temperature gradient to actuate the cantilever at its resonance frequency . On the other hand, the piezoresistors have also been used to sense mechanical deflection of the cantilever. This early report already contains essential concepts for sensing and actuation of cantilevers. In the following years only a few reports were published on the use of cantilevers as sensors, e. g., Heng [15.3], who fabricated in 1971 gold cantilevers capacitively coupled to microstrip lines for mechanical trimming of high-frequency oscillator circuits. In 1979, Petersen [15.4] constructed cantilever-type micromechanical membrane switches in silicon that should have filled the gap between silicon transistors and mechanical electromagnetic relays. Kolesar [15.5] suggested the use of cantilever structures as electronic nerve agent detectors in 1985.
Only with the availability of microfabricated cantilevers for AFM [15.1] did reports on the use of cantilevers as sensors become more frequent. In 1994, Itoh et al. [15.6] presented a cantilever coated with a thin film of zinc oxide and proposed a piezoresistive deflection readout as an alternative to the optical beam deflection readout. Cleveland et al. [15.7] reported the tracking of cantilever resonance frequency to detect nanogram changes in mass loading when small particles were deposited onto AFM probe tips. Thundat et al. [15.8] showed that the resonance frequency as well as static bending of microcantilevers (MC s) are influenced by ambient conditions, such as moisture adsorption, and that deflection of metal-coated cantilevers can be further influenced by thermal effects (bimetallic effect). First chemical sensing applications were presented by Gimzewski et al. [15.9], who used static cantilever bending to detect chemical reactions with very high sensitivity. Later Thundat et al. [15.10] observed changes in the resonance frequency of microcantilevers due to adsorption of analyte vapor on exposed surfaces. Furthermore, frequency changes have been observed caused by mass loading or adsorption-induced changes in cantilever spring constant. By coating cantilever surfaces with hygroscopic materials, such as phosphoric acid or gelatin, the cantilever can sense water vapor with picogram mass resolution.
The deflection of individual cantilevers can easily be determined applying the optical beam deflection technique and modified AFM electronics. A single cantilever can be applied as a sensor, but its response can be prone to artifacts such as thermal drifts or unspecific adsorption. For this reason the use of cantilever arrays including passivated reference cantilevers is recommended. The first use of cantilever arrays with sensor and reference cantilevers was reported in 1998 [15.11], and represented significant progress for the understanding of true cantilever responses (calculation of difference responses of sensor and reference cantilevers).
Cantilever Array Sensors
Concept
For the use of a cantilever as a sensor, neither a sharp tip at the cantilever apex nor a sample surface is required. The upper or lower surface of the cantilever serves as the sensor area and allows the processes taking place on the cantilever beam to be monitored with unprecedented accuracy, in particular the adsorption of molecules. The formation of molecule layers on the cantilever surface will generate surface stress, eventually resulting in a bending of the cantilever, provided the adsorption preferentially occurs on one of the surfaces of the cantilever. Adsorption is controlled by coating one surface (typically the upper one) of a cantilever with a thin layer of a material that shows affinity to molecules in the environment (sensor surface). This surface of the cantilever is referred to as the functionalized surface. The other surface of the cantilever (typically the lower one) may be left uncoated or be coated with a passivation layer, i. e., a chemical surface that does not exhibit substantial affinity to the molecules from the environment we would like to detect. To create functionalized surfaces, often a metal layer is evaporated onto the area to be used as the sensor surface. Metal surfaces, e. g., gold, may be used to covalently bind a monolayer representing the chemical surface sensitive to the molecules to be detected from environment. Frequently, a monolayer of thiol molecules is used, which is covalently bound to a gold surface. The gold layer is also favorable for use as a reflection layer if the bending of the cantilever is read out via an optical beam deflection method.
Compressive and Tensile Stress
A cantilever coated with gold on its upper surface for adsorption of alkanethiol molecules and left uncoated on its lower surface (consisting of silicon and silicon oxide) will respond in the following way to the adsorption of thiol molecules: the molecules will covalently bind to the gold layer on the upper surface of the cantilever, resulting in a downward bending of the cantilever due to the formation of surface stress . We will call this process development of compressive surface stress , because the surface stress change associated with the formation of the self-assembled monolayer (SAM ) produces forces stretching laterally the adsorbed layer, resulting in a downward bending of the cantilever (away from the gold coating). In the opposite situation, i. e., when the cantilever bends upwards, we would speak of tensile stress. If both upper and lower surfaces of the cantilevers are involved in the reaction, then the situation will be much more complex, as a predominant compressive stress formation on the lower cantilever surface might appear as tensile stress on the upper surface. For this reason, it is of utmost importance that the lower cantilever surface is passivated in such a way that ideally no processes will take place on the lower surface of the cantilever.
Disadvantagesof Single Microcantilevers
Single microcantilevers are susceptible to parasitic deflections that may be caused by thermal drift or chemical interaction of a cantilever with its environment, in particular if the cantilever is operated in a liquid. Often, a baseline drift is observed while measuring cantilever bending. Moreover, nonspecific physisorption of molecules on the cantilever surface or nonspecific binding to receptor molecules during measurements may contribute to the drift, as well as electrostatic effects.
Reference and Sensor Cantileversin an Array
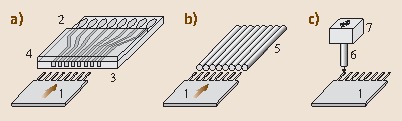
To exclude such unwanted influences, simultaneous measurement of reference cantilevers aligned in the same array as the sensing cantilevers is crucial [15.11]. As the difference in signals from the reference and sensor cantilevers represents the net cantilever response, even tiny sensor responses may be extracted from large cantilever deflections without being dominated by undesired effects. When only single microcantilevers are used, no thermal-drift compensation is possible. To obtain useful data under such circumstances, both microcantilever surfaces have to be chemically well defined. One of the surfaces, typically the lower one, has to be passivated; otherwise the cantilever response will be influenced through undesired effects originating from uncontrolled reactions taking place on the lower surface (Fig. 15.2 a). However, with a pair of cantilevers, reliable measurements can be obtained. One cantilever is used as the sensor cantilever (coated typically on the upper side with a molecule layer showing substantial affinity to the molecules to be detected), whereas the other cantilever serves as the reference cantilever. Actually, it should be coated with a passivation layer on the upper surface so as not to exhibit much affinity to the molecules to be detected. In this configuration, thermal drifts are canceled out if difference responses are taken, i. e., difference in deflections of sensor and reference cantilevers. Alternatively, both cantilevers may be used as sensor cantilevers (sensor layer on the upper surfaces), provided the lower surface has been passivated (Fig. 15.2 b). However, it is best to apply a cantilever array (Fig. 15.2c), in which several cantilevers are used either as sensor or as reference cantilevers so that multiple difference signals can be evaluated simultaneously. Moreover, thermal drift is canceled out if one surface of all cantilevers, typically the lower one, is left uncoated or coated with the same passivation layer.
Fig. 15.2a–c.
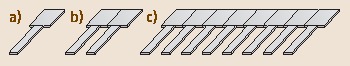

Cantilever sensor arrangements. (a) Single cantilever; (b) pair of cantilevers, one to be used as the sensor cantilever, the other as the reference cantilever, and (c) array of cantilevers with several sensor and reference cantilevers
Modes of Operation
In analogy to AFM, various operating modes for cantilevers are described in the literature. The measurement of static deflection upon formation of surface stress during adsorption of a molecular layer is termed static mode . Ibach used cantilever-like structures to study adsorbate-induced surface stress [15.12] in 1994. Surface stress-induced bending of cantilevers during the adsorption of alkanethiols on gold was reported by Berger et al. in 1997 [15.13]. The mode corresponding to the technique of noncontact AFM is termed dynamic mode , where a cantilever is oscillated at its resonance frequency, and was described by Cleveland et al. [15.7]. They calculated mass changes from shifts in the cantilever resonance frequency upon the mounting of tiny tungsten particle spheres at the apex of the cantilever. Not only adsorption effects can provoke cantilever bending, but also thermal effects. The so-called heat mode was pioneered by Gimzewski et al. [15.9], who took advantage of the bimetallic effect that produces bending of a metal-coated cantilever when heat is generated on its surface. Therewith they constructed a miniaturized calorimeter with picojoule sensitivity. Further operating modes exploit other physical effects such as the production of heat from the absorption of light by materials deposited on the cantilever (photothermal spectroscopy ) [15.14], or cantilever bending due to electric or magnetic forces.
Static mode
The continuous bending of a cantilever caused by increasing coverage with molecules is referred to as operation in the static mode (Fig. 15.3 a). Adsorption of molecules onto the functional layer produces stress at the interface between the functional layer and the forming molecular layer. A quick estimation of the weight of the adsorbed layer of molecules clearly implies that the bending of the cantilever is not due to the mass increase by the adsorbed molecular layer. Because the forces within the functional layer try to keep the distance between molecules constant, the cantilever beam responds by bending because of its extreme flexibility. This property is described by the spring constant k of the cantilever, which for a rectangular microcantilever of length l, thickness t, and width w is calculated as follows
| 15.1 |
where E is the Young's modulus ( for Si(100)).
Fig. 15.3a–i.
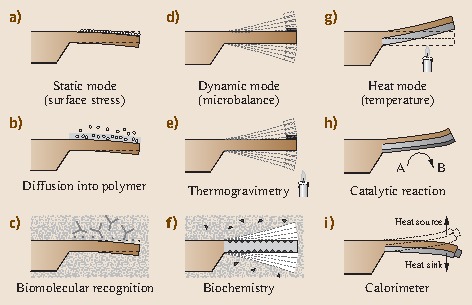

Basic cantilever operation modes: (a) static bending of a cantilever on adsorption of a molecular layer. (b) Diffusion of molecules into a polymer layer leads to swelling of the polymer and eventually to a bending of the cantilever. (c) Highly specific molecular recognition of biomolecules by receptors changes surface stress on the upper surface of the cantilever and results in bending. (d) Oscillation of a cantilever at its resonance frequency (dynamic mode) allows information on mass changes taking place on the cantilever surface to be obtained (application as a microbalance). (e) Changing the temperature while a sample is attached to the apex of the cantilever allows information to be gathered on decomposition or oxidation processes. (f) Dynamic mode measurements in liquids yield details on mass changes during biochemical processes. (g) In heat mode, a bimetallic cantilever is employed. Here bending is due to the difference in the thermal expansion coefficients of the two materials. (h) Catalysic reactions produce heat, resulting in cantilever bending. (i) A tiny sample attached to the apex of the cantilever is investigated taking advantage of the bimetallic effect. Tracking the deflection as a function of temperature allows the observation of phase transitions in the sample in a calorimeter mode
As a response to surface stress, e. g., owing to adsorption of a molecular layer, the microcantilever bends, and its shape can be approximated as part of a circle with radius R. This radius of curvature is given by [15.15, 15.16]
| 15.2 |
The resulting surface stress change is described using Stoney's formula [15.15]
| 15.3 |
where E is Young's modulus, t the thickness of the cantilever, ν the Poisson's ratio (νSi = 0.24), and R the bending radius of the cantilever.
Static mode operation has been reported in various environments. In its simplest configuration, molecules from gaseous environments adsorb on the functionalized sensing surface and form a molecular layer (Fig. 15.3 a), provided the molecules exhibit at least some affinity to the surface. In case of alkanethiol covalently binding to gold, the affinity is very high, resulting in a fast bending response within minutes [15.13]. A less specific way of detection takes advantage of the penetrable network of polymer layers. Polymer sensing layers only exhibit a partial sensitivity, i. e., polymer-coated cantilevers always respond to the presence of volatile molecules, but the magnitude and temporal behavior are specific to the chemistry of the polymer. Molecules from the environment diffuse into the polymer layer at different rates, mainly depending on the size and solubility of the molecules in the polymer layer (Fig. 15.3 b). A wide range of hydrophilic or hydrophobic polymers can be selected as sensing layers, differing in their affinity to polar and unpolar molecules. Thus, polymer coatings can be chosen according to the respective requirements of the sensing application.
Static-mode operation in liquids, however, usually requires rather specific sensing layers, and is based on molecular recognition, e. g., in DNA hybridization [15.17] or antigen-antibody recognition (Fig. 15.3c). Cantilevers functionalized by coating with biochemical sensing layers respond very specifically using the biomolecular key-lock principles of molecular recognition. Whether molecular recognition will actually lead to bending of the cantilever will depend on the efficiency of transduction, as the surface stress has to be generated very close to the cantilever surface to produce substantial bending. By just scaling down standard gene chip strategies to cantilever geometry through utilization of long spacer molecules, hybridization takes place at a distance of several nanometers away from the cantilever surface. The original idea to make DNA molecules become more accessible for hybridization in a gene chip configuration, is unfavorable for cantilever-based sensing through surface stress detection, as the magnitude of bending is greatly reduced or not even observable [15.18].
Dynamic Mode
Since the eigenfrequency of an oscillating cantilever depends on its mass , we can determine mass changes accurately by tracking shifts in eigenfrequency. Technically, the resonance frequency of the cantilever can be measured more easily than the eigenfrequency . Often, the resonance frequency is measured by actuating the cantilever actively, e. g., by a piezoelectric actuator. The resonance frequency represents the frequency at which the oscillation amplitude is largest. The eigenfrequency is equal to the resonance frequency of an oscillating cantilever if the elastic properties of the cantilever remain unchanged and damping effects are insignificant during the molecular adsorption process. This mode of operation is called dynamic mode (e. g., the use of cantilevers as a microbalance, Fig. 15.3d). Owing to mass addition on the cantilever surface, the eigenfrequency of the cantilever will shift to a lower value. The frequency change per mass change on a rectangular cantilever is calculated [15.19] according to
| 15.4 |
where is the mass density of the microcantilever and the deposited mass, and nl ≈ 1 is a geometrical factor.
The mass change is calculated [15.8] from the frequency shift using
| 15.5 |
where f0 is the eigenfrequency before the mass change occurs, and f1 the eigenfrequency after the mass change. Please note that this formula is only accurate for eigenfrequencies and not for resonance frequencies, if damping cannot be neglected.
Mass-change determination can be combined with varying conditions of environmental temperature (Fig. 15.3e) to obtain a method introduced in the literature as micromechanical thermogravimetry [15.20]. For investigation of thermal properties, a tiny piece of sample has to be mounted at the apex of the cantilever. Its mass should not exceed several hundred nanograms. Adsorption, desorption and decomposition processes, occurring while changing the temperature, produce mass changes in the picogram range that can be observed in real time by tracking the resonance-frequency shift.
Dynamic mode operation in a liquid environment is more difficult than in air, because of significant damping of the cantilever oscillation due to the high viscosity of the surrounding media (Fig. 15.3 f). Significant damping results in a low quality factor Q of the oscillation, and thus the resonance frequency shift is difficult to track with high resolution. The quality factor is defined as
| 15.6 |
Whereas in air the resonance frequency can easily be determined with a resolution of below 1 Hz, only a frequency resolution of about 20 Hz is expected for measurements in liquid environments.
The damping or altered elastic properties of the cantilever during the experiment, e. g., by stiffening or softening of the spring constant caused by adsorption of a molecule layer, result in the fact that the measured resonance frequency will not be exactly equal to the eigenfrequency of the cantilever, and therewith the mass derived from the frequency shift will be inaccurate. In a medium, the vibration of a cantilever is described by the model of a driven damped harmonic oscillator
| 15.7 |
where is the effective mass of the cantilever (for a rectangular cantilever the constant is 0.25). Especially in liquids, the mass of the co-moved liquid ml adds significantly to the mass of the cantilever mc. The term γdx ∕ dt is the drag force due to damping, Fcos(2πft) is the driving force executed by the piezoelectric actuator, and k is the spring constant of the cantilever.
If no damping is present, the eigenfrequencies of the various oscillation modes of a bar-shaped cantilever are calculated according to
| 15.8 |
where fn are the eigenfrequencies in n-th mode, αn are constants depending on the mode: . k is the spring constant of the cantilever, mc the mass of the cantilever, and ml the mass of the medium surrounding the cantilever, e. g., liquid [15.21].
Addition of mass to the cantilever due to adsorption will change the effective mass as follows
| 15.9 |
where Δm is the additional mass adsorbed. Typically, the co-moved mass of the liquid is much larger than the adsorbed mass.
Figure 15.4 clearly shows that the resonance frequency is only equal to the eigenfrequency if no damping is present. With damping, the frequency at which the peak of the resonance curve occurs is no longer identical with the one at which the turning point of the phase curve occurs. For example, resonance curve 2 with damping γ2 has its maximum amplitude at frequency f2. The corresponding phase would be φres(γ2), which is not equal to π ∕ 2, as would be expected in the undamped case. If direct resonance frequency tracking or a phase-locked loop is used to determine the frequency of the oscillating cantilever, then only its resonance frequency is detected, but not its eigenfrequency. Remember that the eigenfrequency, and not the resonance frequency, is required to determine mass changes.
Fig. 15.4.
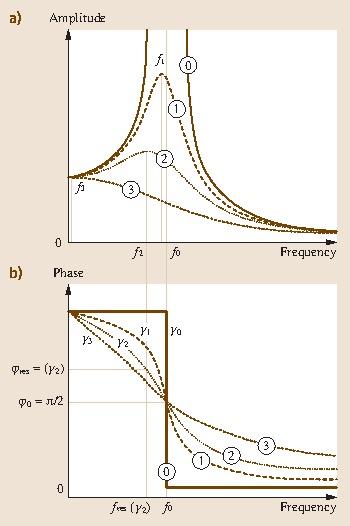

(a) Resonance curve with no damping (0), and increasing damping (1)–(3). The undamped curve with resonance frequency f0 exhibits a very high amplitude, whereas the resonance peak amplitude decreases with damping. This also involves a shift in resonance frequencies f1 to f3 to lower values. (b) Corresponding phase curves showing no damping (0), and increasing damping (1)–(3). The step-like phase jump for the undamped resonance gradually broadens with increased damping
Heat Mode
If a cantilever is coated with metal layers, thermal expansion differences in the cantilever and the coating layer will further influence cantilever bending as a function of temperature. This mode of operation is referred to as the heat mode and causes cantilever bending because of differing thermal expansion coefficients in the sensor layer and cantilever materials [15.9] (Fig. 15.3 g)
| 15.10 |
Here α1 , α2 are the thermal expansion coefficients of the cantilever and coating materials, respectively, t1 , t2 the material thicknesses, P is the total power generated on the cantilever, and κ is a geometry parameter of the cantilever device. λ1 and λ2 are the thermal conductivities of layers 1 and 2.
Heat changes are either caused by external influences (change in temperature, Fig. 15.3g), occur directly on the surface by exothermal, e. g., catalytic, reactions (Fig. 15.3 h), or are due to material properties of a sample attached to the apex of the cantilever (micromechanical calorimetry, Fig. 15.3i). The sensitivity of the cantilever heat mode is orders of magnitude higher than that of traditional calorimetric methods performed on milligram samples, as it only requires nanogram amounts of sample and achieves nanojoule [15.20], picojoule [15.22], and femtojoule [15.23] sensitivity.
These three measurement modes have established cantilevers as versatile tools to perform experiments in nanoscale science with very small amounts of material.
Further Operation Modes
Photothermal Spectroscopy
When a material adsorbs photons, a fraction of the energy is converted into heat. This photothermal heating can be measured as a function of the light wavelength to provide optical absorption data of the material. The interaction of light with a bimetallic microcantilever creates heat on the cantilever surface, resulting in a bending of the cantilever [15.14]. Such bimetallic-cantilever devices are capable of detecting heat flows due to an optical heating power of 100 pW, being two orders of magnitude better than in conventional photothermal spectroscopy.
Electrochemistry
A cantilever coated with a metallic layer (measurement electrode) on one side is placed in an electrolytic medium, e. g., a salt solution, together with a metallic reference electrode, usually made of a noble metal. If the voltage between the measurement and the reference electrode is changed, electrochemical processes on the measurement electrode (cantilever) are induced, such as adsorption or desorption of ions from the electrolyte solution onto the measurement electrode. These processes lead to a bending of the cantilever due to changes in surface stress and in the electrostatic forces [15.24].
Detection of Electrostatic and Magnetic Forces
The detection of electrostatic and magnetic forces is possible if charged or magnetic particles are deposited on the cantilever [15.25, 15.26]. If the cantilever is placed in the vicinity of electrostatic charges or magnetic particles, attractive or repulsion forces occur according to the polarity of the charges or magnetic particles present on the cantilever. These forces will result in upward or downward bending of the cantilever. The magnitude of bending depends on the distribution of charged or magnetic particles on both the cantilever and in the surrounding environment according to the laws of electrostatics and magnetism.
Microfabrication
Several methods have been applied for microfabrication of cantilevers out of various materials, using either wet or dry etching techniques. The silicon cantilever sensor arrays described here have been microfabricated using a dry-etching silicon-on-insulator (SOI) fabrication technique developed in the Micro-/Nanomechanics Department at IBM's Zurich Research Laboratory. One chip comprises eight cantilevers, having a length of 500 μm, a width of 100 μm, and a thickness of 0.5 μm, and arranged at a pitch of 250 μm. For dynamic mode, the cantilever thickness may amount up to 7 μm to obtain higher resonance frequencies and better mass resolution. The resonance frequencies of the cantilevers vary by 0.5% only, demonstrating the high reproducibility and precision of cantilever fabrication. A scanning electron microscopy image of a cantilever sensor array chip is shown in Fig. 15.5.
Fig. 15.5.
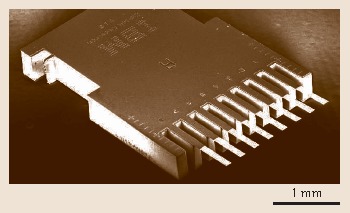

Scanning electron micrograph of a cantilever-sensor array. Image courtesy of Viola Barwich, University of Basel, Switzerland
Measurement Setup
Measurements in Gaseous or Liquid Environment
A measurement setup for cantilever arrays consists of four major parts:
The measurement chamber containing the cantilever array.
An optical or electrical system to detect the cantilever deflection (e. g., laser sources, collimation lenses and a position-sensitive detector (PSD ), or piezoresistors and Wheatstone bridge detection electronics).
Electronics to amplify, process and acquire the signals from the detector.
A gas- or liquid-handling system to reproducibly inject samples into the measurement chamber and purge the chamber.
The following description applies to our measurement setup.
Figure 15.6 shows the schematic setup for experiments performed in (Fig. 15.6a) a gaseous and (Fig. 15.6b) a liquid (biochemical) environment for the optical beam deflection embodiment of the measurement setup. The cantilever sensor array is placed in an analysis chamber 3−90 μl in volume, which has inlet and outlet ports for gases or liquids. The cantilever deflection is determined by means of an array of eight vertical-cavity surface-emitting lasers (VCSEL s) arranged at a linear pitch of 250 μm that emit at a wavelength of 760 nm into a narrow cone of 5−10∘.
Fig. 15.6a,b.
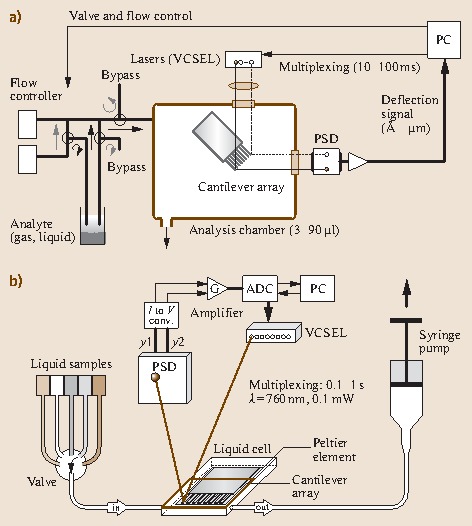

Schematic of measurement setups for (a) a gaseous (artificial nose) and (b) a liquid environment (biochemical sensor)
The light of each VCSEL is collimated and focused onto the apex of the corresponding cantilever by a pair of achromatic doublet lenses, 12.5 mm in diameter. This size has to be selected in such a way that all eight laser beams pass through the lens close to its center to minimize scattering, chromatic and spherical aberration artifacts. The light is then reflected off the gold-coated surface of the cantilever and hits the surface of a PSD. PSDs are light-sensitive photo-potentiometer-like devices that produce photocurrents at two opposing electrodes. The magnitude of the photocurrents depends linearly on the distance of the impinging light spot from the electrodes. Thus, the position of an incident light beam can easily be determined with micrometer precision. The photocurrents are transformed into voltages and amplified in a preamplifier. As only one PSD is used, the eight laser light sources cannot be switched on simultaneously. Therefore, a time-multiplexing procedure is used to switch the lasers on and off sequentially at typical intervals of 10−100 ms. The resulting deflection signal is digitized and stored together with time information on a personal computer (PC), which also controls the multiplexing of the VCSELs as well as the switching of the valves and mass flow controllers used for setting the composition ratio of the analyte mixture.
The measurement setup for liquids (Fig. 15.6b) consists of a poly-etheretherketone (PEEK ) liquid cell, which contains the cantilever array and is sealed by a Viton O-ring and a glass plate. The VCSELs and the PSD are mounted on a metal frame around the liquid cell. After preprocessing the position of the deflected light beam in a current-to-voltage converter and amplifier stage, the signal is digitized in an analog-to-digital converter and stored on a PC. The liquid cell is equipped with inlet and outlet ports for liquids. They are connected via 0.18 mm of i.d. Teflon tubing to individual thermally equilibrated glass containers, in which the biochemical liquids are stored. A six-position valve allows the inlet to the liquid chamber to be connected to each of the liquid-sample containers separately. The liquids are pulled (or pushed) through the liquid chamber by means of a syringe pump connected to the outlet of the chamber. A Peltier element is situated very close to the lumen of the chamber to allow temperature regulation within the chamber. The entire experimental setup is housed in a temperature-controlled box regulated with an accuracy of 0.01 K to the target temperature.
Readout Principles
This section describes various ways to determine the deflection of cantilever sensors. They differ in sensitivity, effort for alignment and setup, robustness, and ease of readout as well as in potential for miniaturization.
Piezoresistive Readout
Piezoresistive cantilevers [15.20, 15.6] are usually U-shaped having diffused piezoresistors in both of the legs close to the hinge (Fig. 15.7 a). The resistance in the piezoresistors is measured by a Wheatstone bridge technique employing three reference resistors, one of which is adjustable. The current flowing between the two branches of the Wheatstone bridge is initially nulled by changing the resistance of the adjustable resistor. If the cantilever bends, the piezoresistor changes its value and a current will flow between the two branches of the Wheatstone bridge. This current is converted via a differential amplifier into a voltage for static mode measurement. For dynamic mode measurement, the piezoresistive cantilever is externally actuated via a frequency generator connected to a piezocrystal. The ac actuation voltage is fed as reference voltage into a lock-in amplifier and compared with the response of the Wheatstone bridge circuit. This technique allows one to sweep resonance curves and to determine shifts in resonance frequency.
Fig. 15.7.
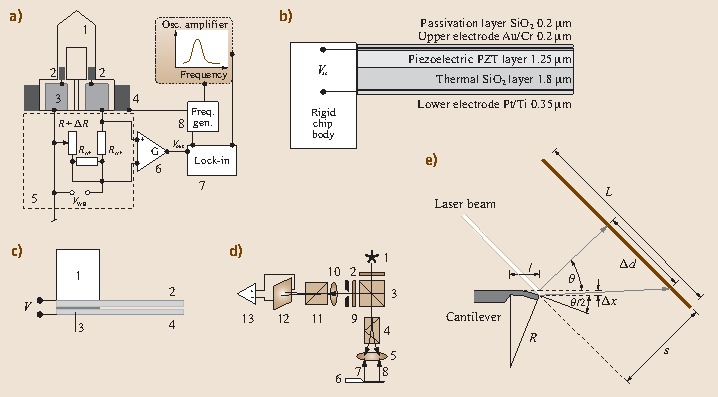

(a) Piezoresistive readout: 1 cantilever, 2 piezoresistors, 3 Au contact pads, 4 external piezocrystal for actuation, 5 Wheatstone bridge circuit, 6 differential amplifier, 7 lock-in amplifier, 8 function generator. (b) Piezoelectric readout. (c) Capacitive readout: 1 solid support, 2 rigid beam with counterelectrode, 3 insulation layer (SiO2), 4 flexible cantilever with electrode. (d) Interferometric readout: 1 laser diode, 2 polarizer, 3 nonpolarizing beam splitter, 4 Wollaston prism, 5 focusing lens, 6 cantilever, 7 reference beam (near cantilever hinge), 8 object beam (near cantilever apex), 9 diaphragm and λ ∕ 4 plate, 10 focusing lens, 11 Wollaston prism, 12 quadrant photodiode, 13 differential amplifier. (e) Beam-deflection readout
Piezoelectric Readout
Piezoelectric cantilevers [15.27] are actuated by applying an electric ac voltage via the inverse piezoelectric effect (self-excitation) to the piezoelectric material (PZT or ZnO). Sensing of bending is performed by recording the piezoelectric current change due to the fact that the PZT layer may produce a sensitive field response to weak stress through the direct piezoelectric effect. Such cantilevers are multilayer structures consisting of an SiO2 cantilever and the PZT piezoelectric layer. Two electrode layers, insulated from each other, provide electrical contact. The entire structure is protected using passivation layers (Fig. 15.7b). An identical structure is usually integrated into the rigid chip body to provide a reference for the piezoelectric signals from the cantilever.
Capacitive Readout
For capacitive readout (Fig. 15.7c), a rigid beam with an electrode mounted on the solid support and a flexible cantilever with another electrode layer are used [15.28, 15.29]. Both electrodes are insulated from each other. Upon bending of the flexible cantilever the capacitance between the two electrodes changes and allows the deflection of the flexible cantilever to be determined. Both static and dynamic measurement modes are possible.
Optical (Interferometric) Readout
Interferometric methods [15.30, 15.31] are most accurate for the determination of small movements. A laser beam passes through a polarizer plate (polarization 45∘) and is partially transmitted by a nonpolarized beam splitter (Fig. 15.7d). The transmitted beam is divided in a Wollaston prism into a reference and an object beam. These mutually orthogonally polarized beams are then focused onto the cantilever. Both beams (the reference beam from the hinge region and the object beam from the apex region of the cantilever) are reflected back to the objective lens, pass the Wollaston prism, where they are re-combined into one beam, which is then reflected into the other arm of the interferometer, where after the λ ∕ 4 plate a phase shift of a quarter wavelength between object and reference beam is established. Another Wollaston prism separates reference and object beams again for analysis with a four-quadrant photodiode. A differential amplifier is used to obtain the cantilever deflection with high accuracy. However, the interferometry setup is quite bulky and difficult to handle.
Optical (Beam-Deflection) Readout
The most frequently used approach to read out cantilever deflections is optical beam deflection [15.32], because it is a comparatively simple method with an excellent lateral resolution. The schematic is shown in Fig. 15.7e.
The actual cantilever deflection Δx scales with the cantilever dimensions. Therefore, the surface stress Δσ in N ∕ m is a convenient quantity to measure and compare cantilever responses. It takes into account the cantilever material properties, such as the Poisson ratio ν, the Young's modulus E, and the cantilever thickness t. The radius of curvature R of the cantilever is a measure of bending, see (15.2). As shown in the drawing in Fig. 15.7e, the actual cantilever displacement Δx is transformed into a displacement Δd on the PSD. The position of a light spot on a PSD is determined by measuring the photocurrents from the two facing electrodes. The movement of the light spot on the linear PSD is calculated from the two currents I1 and I2 and the size L of the PSD by
| 15.11 |
As all angles are very small, it can be assumed that the bending angle of the cantilever is equal to half of the angle θ of the deflected laser beam, i. e., θ ∕ 2. Therefore, the bending angle of the cantilever can be calculated to be
| 15.12 |
where s is the distance between the PSD and the cantilever. The actual cantilever deflection Δx is calculated from the cantilever length l and the bending angle θ ∕ 2 by
| 15.13 |
Combination of (15.12) and (15.13) relates the actual cantilever deflection Δx to the PSD signal
| 15.14 |
The relation between the radius of curvature and the deflection angle is
| 15.15 |
and after substitution becomes
| 15.16 |
or
Miniaturized Piezoresistive Arrays
One of the drawbacks of cantilever array sensors is the bulky size of equipment required for optical cantilever deflection readout. Especially for the development of handheld devices one would prefer a more compact type of measurement electronics. This disadvantage can be overcome by employing another method for deflection detection involving the use of piezoresistor elements to determine bending. Since no alignment optics are required, the complete readout electronics for piezoresistive sensors easily fits in a portable box of typically , including data acquisition and gas handling.
Membrane Surface Stress Sensors
Membrane-type surface stress sensors (MSS ) were first described by Yoshikawa et al. [15.33]. Their application for medical sensing was reported in a publication by Loizeau et al. [15.34, 15.35]. MSS are also arranged in arrays and are mainly used for molecular detection in the gaseous phase. MSS have been microfabricated from silicon-on-insulator substrates and structured by deep reactive ion etching. The sensors consists of a round membrane with a diameter of typically 500 μm and a thickness of 2.5 μm, which serves as a platform for applying the sensing layer (typically a polymer layer similar to that used in cantilever array-based electronic noses). The preferred way of coating the membranes is inkjet spotting of polymer solution, but also spray-coating or spin-coating is applicable. The membrane is suspended by four sensing beams with integrated p-type piezoresistors, representing a full Wheatstone bridge (Fig. 15.8). The four piezoresistor bridges are wired in such a way that their responses add up, increasing the sensitivity by a factor of 4 as compared to piezoresistive cantilevers. Further geometrical enhancements reported by Yoshikawa et al. [15.36] allow one to increase the sensitivity of MSS by a factor of 100 compared the previous generation of piezoresistive cantilevers. p-Doped piezoresistors were fabricated using two subsequent doping processes (ion diffusion through Boron Silica Glass and implantation). The latter method features shallow resistors, which are very sensitive to surface stress changes. The measured signal pattern consists of the bending responses of an array of piezoresistive polymer-coated membranes due to exposure to volatile organic compounds (VOC s). Recent applications of MSS are described in [15.37, 15.38, 15.39, 15.40, 15.41, 15.42].
Fig. 15.8.
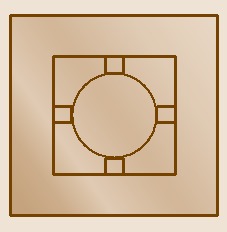

Schematic representation of a membrane-type surface stress sensor (MSS). The actual diameter of the round membrane is 500 μm and its thickness is 2.5 μm. The membrane is suspended by four sensing beams with integrated p-type piezoresistors, representing a full Wheatstone bridge. A solid supporting frame holds the sensor. Several MSS can be arranged in an array
Functionalization Techniques
General Strategy
To serve as sensors, cantilevers have to be coated with a sensor layer that is either highly specific, i. e., is able to recognize target molecules in a key-lock process, or partially specific, meaning the sensor information from several cantilevers yields a pattern that is characteristic of the target molecules.
To provide a platform for specific functionalization, the upper surface of these cantilevers is typically coated with 2 nm of titanium and 20 nm of gold, which yields a reflective surface as well as an interface for attaching functional groups of probe molecules, e. g., for anchoring molecules with a thiol group to the gold surface of the cantilever. Such thin metal layers are believed not to contribute significantly to bimetallic bending, particularly because the temperature is kept constant.
Functionalization Methods
There are numerous ways to coat a cantilever with material, both simple and more advanced ones. The method of choice should be fast, reproducible, reliable, and allow one or both of the surfaces of a cantilever to be coated separately.
Simple Methods
Obvious methods to coat a cantilever are thermal or electron beam-assisted evaporation of material, electro-spray, or other standard deposition methods. The disadvantage of these methods is that they are only suitable for coating large areas, but not individual cantilevers in an array, unless shadow masks are used. Such masks need to be accurately aligned with the cantilever structures, which is a time-consuming process.
Other methods to coat cantilevers use manual placement of particles onto the cantilever [15.20, 15.43, 15.44, 15.45, 15.9], which requires skillful handling of tiny samples. Cantilevers can also be coated by directly pipetting solutions of the probe molecules onto the cantilevers [15.46] or by employing air-brush spraying and shadow masks to coat the cantilevers individually [15.47]. All these methods have only limited reproducibility and are very time-consuming if a larger number of cantilever arrays has to be coated.
Microfluidics
Microfluidic networks (μFN) [15.48] are structures of channels and wells, etched several tens to hundreds of micrometers deep into silicon wafers or glass. Also polymer replicas, typically from poly(dimethylsiloxane) (PDMS ) may be used. The wells can be filled easily using a laboratory pipette, so that the fluid with the probe molecules for coating the cantilever is guided through the channels towards openings at a pitch matched to the distance between individual cantilevers in the array (Fig. 15.9a).
Fig. 15.9.

(a) Cantilever functionalization in microfluidic networks. (b) Incubation in dimension-matched microcapillaries. (c) Coating with an inkjet spotter: 1 cantilever array, 2 reservoir wells, 3 microfluidic network with channels, 4 PDMS cover to avoid evaporation, 5 microcapillaries, 6 inkjet nozzle, 7 inkjet x-y-z positioning unit
The cantilever array is then introduced into the open channels of the μFN that are filled with a solution of the probe molecules. The incubation of the cantilever array in the channels of the μFN takes from a few seconds (self-assembly of alkanethiol monolayers) to several tens of minutes (coating with protein solutions). To prevent evaporation of the solutions, the channels are covered by a slice of PDMS. In addition, the microfluidic network may be placed in an environment filled with saturated vapor of the solvent used for the probe molecules.
Array of Dimension-Matched Capillaries
A similar approach is insertion of the cantilever array into an array of dimension-matched disposable glass capillaries . The outer diameter of the glass capillaries used here is 240 μm so that they can be placed neatly next to each other to accommodate the pitch of the cantilevers in the array (250 μm). Their inner diameter is 150 μm, providing sufficient room to insert the cantilevers (width: 100 μm) safely (Fig. 15.9b). This method has been successfully applied for the deposition of a variety of materials onto cantilevers, such as polymer solutions [15.47], self-assembled monolayers [15.49], thiol-functionalized single-stranded DNA oligonucleotides [15.50], and protein solutions [15.51].
Inkjet Spotting
All of the above techniques require manual alignment of cantilever array and functionalization tool, and are therefore not ideal for coating a large number of cantilever arrays. The inkjet-spotting technique, however, allows rapid and reliable coating of cantilever arrays [15.52, 15.53]. An x-y-z positioning system allows a fine nozzle (capillary diameter: 70 μm) to be positioned with an accuracy of approx. 10 μm over a cantilever. Individual droplets (diameter: 60−80 μm, volume 0.1−0.3 nl) can be dispensed by means of a piezo-driven ejection system in the inkjet nozzle. When the droplets are spotted with a pitch smaller than 0.1 mm, they merge and form continuous films. By adjusting the number of droplets deposited on cantilevers, the resulting film thickness can be controlled precisely. The inkjet-spotting technique allows a cantilever to be coated within seconds and yields very homogeneous, reproducibly deposited layers of well-controlled thickness. Successful coating of self-assembled alkanethiol monolayers, polymer solutions, self-assembled DNA single-stranded oligonucleotides [15.53], and protein layers has been demonstrated. In conclusion, inkjet spotting has turned out to be a very efficient and versatile method for functionalization, which can even be used to coat arbitrarily shaped sensors reproducibly and reliably [15.54, 15.55].
Applications
Chemical Detection
Hydrogen
Early reports on detection of gases such as hydrogen involved nanomechanical detection of catalytic reactions of bimetallic microcantilevers coated with aluminum and a top layer of platinum in thermal mode [15.9]. The catalytic reaction of oxygen present in a reaction chamber with hydrogen being introduced into the chamber produces oscillatory chemical reactions resulting in mechanical oscillations of the cantilever due to heat formation related to catalytic conversion of H2 and O2 to form H2O. By use of an array of four platinum-coated and four uncoated microcantilevers, a change of the deflection signal due to bending of the platinum-coated cantilever relative to the uncoated cantilevers can be observed upon hydrogen adsorption in the presence of oxygen [15.11]. Similar responses were obtained with Pd-coated glass cantilevers [15.56] and with Pd-coated silicon microcantilevers using dynamic mode [15.57], capacitive readout [15.58] or beam-deflection readout in static mode [15.59].
Water Vapor
The first observation of microcantilever resonance frequency detuning was reported in [15.8]. A dependence on relative humidity of ZFM5 zeolites attached to resonating microcantilevers was observed in [15.60]. Relative humidity was measured with an accuracy of 1% using piezoresistive sensors embedded in polymer [15.61]. A detection limit of 10 ppm was achieved using Al2O3-coated microcantilevers [15.62].
Other Vapors
ZFM5 zeolites have been used to detect vapor of p-nitroaniline dye in dynamic mode with picogram sensitivity [15.60]. A freon gas sensor using a piezoelectric microcantilever coated with MFI zeolite was described in [15.63]. Ethanol vapor detection in dynamic mode was described in [15.64].
Alkane Thiol Vapors
Surface stress changes and kinetics were measured in situ during the self-assembly of alkanethiols on gold by means of a micromechanical sensor, observing scaling of compressive surface stress with the length of the alkane chain [15.13, 15.65]. 65 ppb of 2-mercaptoethanol have been measured evaluating the response of gold-coated silicon nitride microcantilevers [15.66]. The mechanism of stress formation upon adsorption of thiol layers has been studied by exposing monolayers of alkanethiols on gold to low-energy Ar ions, resulting in formation of a large tensile stress [15.67]. The influence of surface morphology and thickness of the gold coating of the cantilever was discussed in [15.68, 15.69]. A multiple-point deflection technique has been used to investigate stress evolution during the adsorption of dodecanethiol on microcantilever sensors, allowing one to assess the cantilever bending profile [15.70]. Using gold-coated, piezoelectric-excited, millimeter-sized cantilevers exposed to 1-hexadecanethiol (HDT) in ethanol, a detection range between 1 fM to 1 mM has been claimed [15.71]. The formation of alkanedithiol (HS-(CH)SH) monolayers on gold in solution has been monitored using microcantilever sensors [15.72]. The nanomechanical bending of microfabricated cantilevers during the immobilization of alkanethiols of different chain lengths has been investigated in the liquid phase [15.73].
Metal Vapors
Detection of mercury vapor was one of the first applications of microcantilever sensors in dynamic mode [15.10]. 20 ppb of Hg vapor was detected using a microcantilever with an integrated piezoelectric film [15.74]. A monolayer of 1,6-hexanedithiol has been identified as an unusually specific recognition agent for CH3Hg+ [15.75]. A 15 ppb detection limit for mercury was reported using microcantilevers that were thermally excited at the fundamental and first three higher order modes [15.76, 15.77]. Cs ion concentrations in the range of 10−11−10−7 M were detected using a 1,3-alternate 25,27-bis(11-mercapto-1-undecanoxy)-26,28-calix[4]benzo-crown-6 caesium recognition agent bound to a gold-coated microcantilever [15.78]. The crown cavity is highly selective to Cs, as compared to K or Na. An atomic force microscope cantilever has been used as a bending-beam sensor to measure surface stress changes which occur during electrochemical processes, such as the formation of a Pb layer on Au [15.79].
HF and HCN
Microcantilevers have been used as a gas sensor to detect hydrofluoric acid (HF) at a threshold of 0.2 ppm [15.80]. Femtomolar HF concentrations, which are also a decomposition component of nerve agents, were detected using an SiO2 microcantilever. The high sensitivity was considered to be due to the reaction of HF with SiO2 [15.81]. The etching rate was determined to be 0.05 nm ∕ min for SiO2 and 0.7 nm ∕ min for Si3N4 [15.82]. Sensor responses towards HCN at a concentration of 150 ppm within seconds were reported [15.83].
Ion Sensing
Using microcantilevers coated with a self-assembled monolayer of triethyl-12-mercaptododecylammonium bromide on gold CrO2−4 ions were detected at a concentration of 10−9 M. Other anions, such as Cl−, Br−, CO2−3, HCO−3, and SO2−4 did not deflect such modified cantilevers significantly [15.84]. Hg2+ has been measured down to a concentration of 10−11 M using a microcantilever coated with gold. Almost no affinity to other cations exists, such as K+, Na+ Pb2+, Zn2+, Ni2+, Cd2+, Cu2+, and Ca2+ [15.85]. Adsorption characteristics of Ca2+ ions as a function of concentration in aqueous CaCl2 solution were investigated in static and dynamic mode [15.86]. Microcantilevers functionalized with metal-binding protein, AgNt84-6, have been shown to detect heavy metal ions like Hg2+ and Zn2+, but were insensitive to Mn2+ [15.87]. Hydrogels containing benzo-18-crown-6 have been used to modify microcantilevers for measurements of the concentration of Pb2+ in aqueous solutions [15.88]. Using different thiolated ligands as self-assembled monolayers (SAM s) functionalized on silicon microcantilevers (MC s) coated with gold allows one to detect Cs+, Co2+, and Fe3+ [15.89]. A gold-coated microcantilever has been utilized as the working electrode to detect Cr(VI) [15.90]. Others used 11-undecenyltriethylammonium bromide [15.91] or sol-gel layers [15.92] for detection of Cr(VI). On the basis of the EDTA-Cd(II) complex and its binding capability to bovine serum albumine (BSA ) an antibody-based Cd(II) sensor using microcantilevers has been presented [15.93].
Volatile Organic Compounds (VOC)
A microcantilever-based alcohol vapor sensor was described in [15.94]. It used the piezoresistive technique and a polymer coating. The authors also presented a simple evaporation model that allowed determination of concentration. The detection limit found was 10 ppm for methanol, ethanol, and 2-propanol. In [15.95], an integrated complementary metal oxide semiconductor (CMOS ) chemical microsensor with piezoresistive detection (Wheatstone bridge configuration) using poly(etherurethane) (PEUT ) as the sensor layer was presented. The authors were able to reversibly detect volatile organic compounds (VOC s) such as toluene, n-octane, ethyl acetate, and ethanol with a sensitivity level down to 200 ppm. An improved version of that device was described in [15.96]. The sensitivity was increased to 5 ppm for n-octane. Later, the technique was refined using electromagnetic rather than electrothermal actuation and a transistor-based readout reducing power dissipation on the cantilever [15.97]. Piezoelectric readout in dynamic mode and electromagnetic actuation of cantilevers spray-coated with PEUT was reported in [15.98], which achieved a sensitivity of 14 ppm for ethanol. In [15.99], a study on how to prepare polyethylene glycol (PEG )-coated microcantilever sensors using a microcapillary pipette-assisted method was reported. The PEG coating is suitable for ethanol sensing as ethanol quickly forms hydrogen bonds with the −OH groups of the PEG. Sensor operation was reported to be reversible and reproducible. In [15.100], artificial neural networks were used for analyte species and concentration identification with polymer-coated optically read-out microcantilevers. The analytes detected were carbon dioxide, dichloromethane, diiso-propylmethylphosphonate (DIMP ), dioxane, ethanol, water, 2-propanol, methanol, trichloroethylene, and trichloromethylene. In [15.101], the chemical sensing performance of a silicon resonant microcantilever sensor was investigated in dependence on the thickness of the sensitive coating. For a coating thickness of 1, 4, and 21 μm of PEUT a limit of detection of 30 ppm was found for ethanol. A new concept of a parylene micromembrane array for chemical sensing was presented in [15.102] using the capacitive method. The parylene membrane was suspended over a metal pad patterned on the substrate. The pad and part of the membrane that was metal-coated served as electrodes for capacitive measurement. The top electrode located on the membrane was chemically modified by application of a gold layer and self-assembled thiol monolayers (−COOH, −CH3 and −OH) for detection of analyte molecules. Successful detection of 2-propanol and toluene was reported. In [15.103], a sensitive self-oscillating cantilever array was described for quantitative and qualitative analysis of organic vapor mixtures. The cantilevers were electromagnetically actuated and the resonance frequency was measured using a frequency counter. Sensor response was reproducible and reversible. Using a PEUT coating the smallest measured concentration was 400 ppm, but the limit of detection was well below 1 ppm. In [15.104], a combination of gas chromatography with a microcantilever sensor array for enhanced selectivity was reported. Test VOC mixtures composed of acetone, ethanol, and trichloroethylene in pentane, as well as methanol with acetonitrile in pentane were first separated in a gas chromatography column and then detected using microcantilevers coated with responsive phases such as 3-aminopropyltriethoxy silane, copper phtalocyanine, and methyl-β-cyclodextrin. Analytes detected included pentane, methanol, acetonitrile, acetone, ethanol, and trichloroethylene. In [15.105], results were presented on independent component analysis (ICA ) of ethanol, propanol, and DIMP using a cantilever coated with molecular recognition phases (MRP ), whereby ICA proved its feature extraction ability for components in mixtures.
Toxins
Detection of the organochlorine insecticide compound dichlorodiphenyltrichloroethane (DDT ) has been reported using a synthetic hapten of the pesticide as a recognition site conjugated with bovine serum albumin (BSA) covalently immobilized on the gold-coated side of the cantilever by using thiol self-assembled monolayers [15.106].
Explosives, Chemical Warfare, and Biohazards
Security measures require inexpensive, highly selective and very sensitive small sensors that can be mass-produced and microfabricated. Such low-cost sensors could be arranged as a sensor grid for large area coverage of sensitive infrastructure, such as airports, public buildings, or traffic infrastructure. Threats may be of chemical, biological, radioactive, or explosive nature. Microcantilever sensors are reported to offer very high sensitivities for explosives detection. Photomechanical chemical microsensors based on adsorption-induced and photo-induced stress changes due to the presence of diisopropyl methyl phosphonate (DIMP ), which is a model compound for phosphorous-containing chemical warfare agents, and trinitrotoluene (TNT ), an explosive, were reported [15.107]. Further explosives frequently used include pentaerythritol tetranitrate (PETN ) and hexahydro-1,3,5-triazine (RDX), often also with plastic fillers [15.108]. These compounds are very stable, if no detonator is present. Their explosive power, however, is very large, and moreover, the vapor pressures of PETN and RDX are very low, in the range of ppb and ppt. By functionalizing microcantilevers with self-assembled monolayers of 4-mercaptobenzoic acid (4-MBA) PETN was detected at a level of 1400 ppt and RDX at a level of 290 ppt [15.109]. TNT was found to readily stick to Si surfaces, suggesting the use of microcantilevers for TNT detection, taking advantage of the respective adsorption/desorption kinetics [15.110, 15.111]. Detection of TNT via deflagration on a microcantilever was described by Pinnaduwage et al. [15.111]. They used piezoresistive microcantilevers where the cantilever deflection was measured optically via beam deflection. TNT vapor from a generator placed 5 mm away from the microcantilever was observed to adsorb on its surface resulting in a decrease of resonance frequency. Application of an electrical pulse (10 V, 10 ms) to the piezoresistive cantilever resulted in deflagration of the TNT vapor and a bump in the cantilever bending signal. This bump was found to be related to the heat produced during deflagration. The amount of heat released is proportional to the area of the bump in the time versus bending signal diagram of the process. The deflagration was found to be complete, as the same resonance frequency as before the experiment was observed. The amount of TNT mass involved was determined as 50 pg. The technique was later extended to the detection of PETN and RDX, where much slower reaction kinetics was observed [15.109, 15.112]. Traces of 2,4-dinitrotoluene (DNT) in TNT can also be used for detection of TNT, because it is the major impurity in production-grade TNT. Furthermore, DNT is a decomposition product of TNT. The saturation concentration of DNT in air at 20∘C is 25 times higher than that of TNT. DNT was reported detectable at the 300 ppt level using polysiloxane polymer layers [15.113]. Microfabrication of electrostatically actuated resonant microcantilever beams in CMOS technology for detection of the nerve agent stimulant dimethylmethylphosphonate (DMMP ) using polycarbosilane-coated beams [15.114] is an important step towards an integrated platform based on silicon microcantilevers, which besides compactness might also include telemetry [15.115]. Cu2+/l-cysteine bilayer-coated microcantilever demonstrated high sensitivity and selectivity toward organo-phosphorus compounds in aqueous solution. The microcantilever was found to undergo bending upon exposure to nerve agent simulant DMMP at concentrations as low as 10−15 M due to the complexation of the phosphonyl group and the Cu2+/l-cysteine bilayer on the microcantilever surface [15.116, 15.117].
Biochemical Environment
pH
Control of pH is often important in biochemical reactions. Therefore, this section concerns measurement of pH using microcantilevers. The interfacial stress of self-assembled monolayers of mercaptohexadecanoic acid and hexadecanethiol depends on pH values and ionic strength [15.49]. SiO2 and silicon nitride microcantilevers were also found to exhibit a deflection dependency with pH when coated with 4-aminobutyltriethoxysilane, 11-mercaptoundecanoic acid and Au/Al-coated over a pH range between 2 and 12. Aminosilane-modified SiO2/Au cantilevers performed robustly over a pH range between 2 and 8 (49 nm deflection/pH unit), while Si3N4/Au cantilevers performed well at a pH between 2 and 6 as well as between 8 and 12 (30 nm deflection/pH unit) [15.118]. Microcantilevers with poly(methacrylic acid) (PMAA ) and poly(ethylene glycol) dimethacrylate coating were shown to be sensitive to pH changes [15.119]. Also hydrogel coatings were found to be sensitive to pH [15.120]. The dependence of the micromechanical responses to different ionic strength and ion species present in the aqueous environment was discussed in [15.121], highlighting the critical role of counter- and co-ions on surface stress.
Glucose
Glucose sensing via microcantilevers is achieved by coating the cantilevers with the enzyme glucose oxidase on gold [15.122] or via polyethyleneimine (PEI ) conjugation [15.123]. Glucose concentrations between 0.2 and 20 mM could be detected [15.124]. In another study a detection range between 2 and 50 mM was reported for glucose. No signal was observed for fructose, mannose, and galactose [15.125].
Hydrogen Peroxide (H2O2)
Hydrogen peroxide is detected at the nM level using multilayer modified microcantilevers functionalized through a layer-by-layer nanoassembly technique via intercalation of the enzyme horseradish peroxidase. The magnitudes of bending were found to be proportional to the concentrations of hydrogen peroxide [15.126].
DNA, RNA
Specific DNA hybridization detection was observed via surface stress changes related to transduction of receptor-ligand binding into a direct nanomechanical response of microfabricated cantilevers without the need for external labeling or amplification. The differential deflection of the cantilevers was found to provide a true molecular recognition signal despite large responses of individual cantilevers. Hybridization of complementary oligonucleotides shows that a single base mismatch between two 12-mer oligonucleotides is clearly detectable [15.17]. The findings were confirmed or modeled by several groups [15.127, 15.128]. Hybridization in a complex nonspecific background was observed in a complement concentration range between 75 nM and 2 μM [15.50], following Langmuir model kinetics [15.129]. Enzymatic processes were directly performed on a microcantilever functionalized with DNA incorporating a Hind III restriction endonuclease site, followed by digestion with Hind III to produce DNA comprising a single-stranded end on the cantilever surface. Ligase was used to couple a second DNA molecule with a compatible end to the DNA on the cantilever [15.130]. Using gold nanoparticle-labeled DNA, microcantilevers have been used to detect DNA strands with a specific sequence in dynamic mode, whereby a concentration of 23 pM could still be detected, as well as a single base pair mismatch [15.131]. Whereby adsorption of thiol-functionalized single-stranded DNA is easily observed, hybridization cannot be observed if long hydrocarbon spacer molecules between single-strand DNA and the thiol anchor are used [15.132]. DNA hybridization was also observed using piezoresistive cantilevers [15.129, 15.133]. A different technique to read out the microcantilever deflections in an array was reported in [15.134]. There the optical beam deflection technique was combined with the scanning of a laser beam illuminating the cantilevers of an array sequentially. DNA hybridization has also been reported using polymer SU-8 cantilevers [15.135]. Mukhopadhyay et al. reported 20 nM hybridization sensitivity using piezoresistive cantilevers and DNA sequences with an overhang extension distal to the surface [15.136]. A larger array comprising 20 microcantilevers was described in [15.137]. Moreover, the authors presented integration of the array with microfluidics. Surface stress changes in response to thermal dehybridization, or melting, has been reported [15.138]. The dependence of salt concentration and hybridization efficiency was discussed in [15.139]. Two different DNA-binding proteins, the transcription factors SP1 and NF-kappa B were investigated in [15.140]. Phase transition and stability issues of DNA were discussed in [15.141]. Differential gene expression of the gene 1-8U, a potential marker for cancer progression or viral infections, has been observed in a complex background. The measurements provided results within minutes at the picomolar level without target amplification, and were sensitive to base mismatches [15.142].
Proteins and Peptides
Microfabricated cantilevers were utilized to detect adsorption of low-density lipoproteins (LDL ) and their oxidized form (oxLDL) on heparin, and to detect adsorption of bovine serum albumine and Immunoglobuline G (IgG ) [15.143]. In [15.144] the activity, stability, lifetime, and re-usability of monoclonal antibodies to myoglobin covalently immobilized onto microfabricated cantilever surfaces was investigated. Using piezoresistive microcantilevers the interaction of anti-bovine serum albumin (a-BSA) with bovine serum albumin (BSA) was studied [15.145]. Continuous label-free detection of two cardiac biomarker proteins (creatin kinase and myoglobin) has been demonstrated using an array of microfabricated cantilevers functionalized with covalently anchored anti-creatin kinase and anti-myoglobin antibodies [15.51]. Label-free protein detection has been reported using a microcantilever functionalized with DNA aptamer receptors for Taq DNA polymerase [15.146]. Label-free detection of C-reactive protein (CRP ) using resonant frequency shift in piezoresistive cantilevers was described in [15.147], utilizing the specific binding characteristics of CRP antigen to its antibody, which is immobilized with Calixcrown SAMs on Au. In [15.148], the authors discuss receptors on microcantilevers for serotonin that are insensitive to its biological precursor with a similar tryptophan structure. Using single-chain fragment antibodies instead of complete antibodies allowed the limit of detection to be lowered to concentrations of about 1 nM [15.149]. In [15.150], detection of prostate-specific antigen (PSA ) and C-reactive protein was reported. Detection of the human oestrogen receptor in free and oestradiol-bound conformation can be distinguished [15.151]. The Ca2+ binding protein calmodulin changes its conformation in presence or absence of Ca2+ resulting in a microcantilever deflection change [15.152]. No effect was observed upon exposure to K+ and Mg2+. Detection of activated cyclic adenosine monophosphate (cyclic AMP)-dependent protein kinase (PKA ) was performed in dynamic mode employing a peptide derived from the heat-stable protein kinase inhibitor (PKI ) in [15.153]. Detection of streptavidin at 1−10 nM concentration was reported using biotin-coated cantilevers in [15.154]. Using GST (glutathione-S-transferase) for detection of GST antibodies, a sensitivity of 40 nM was obtained [15.155]. A two-dimensional multiplexed real-time, label-free antibody-antigen binding assay by optically detecting nanoscale motions of two-dimensional arrays of microcantilever beams was presented in [15.156]. Prostate-specific antigen was detected at 1 ng ∕ mL using antibodies covalently bound to one surface of the cantilevers. Conformational changes in membrane protein patches of bacteriorhodopsin proteoliposomes were observed with microcantilevers through prosthetic retinal removal (bleaching) [15.157]. Using an analog of the myc-tag decapeptide, binding of anti-myc-tag antibodies was reported [15.158].
Lipid Bilayers, Liposomes, Cells
Cantilever array sensors can sense the formation by vesicle fusion of supported phospholipid bilayers of 1,2-dioleoyl-sn-glycero-3-phosphocholine (DOPC ) on their surface and can monitor changes in mechanical properties of lipid bilayers [15.159]. Liposomes are detected based on their interaction with protein C2A which recognizes the phosphatidylserine (PS) exposed on the surface of the liposome [15.160]. Individual Escherichia coli (E. coli) O157:H7 cell-antibody binding events using microcantilevers operated in dynamic mode have been reported [15.161]. The contractile force of self-organized cardiomyocytes was measured on biocompatible poly(dimethylsiloxane) cantilevers, representing a microscale cell-driven motor system [15.162]. Resonating cantilevers were used to detect individual phospholipid vesicle adsorption in liquid. A resonance frequency shift corresponding to an added mass of 450 pg has been measured [15.163].
Spores, Bacteria, and Viruses
Micromechanical cantilever arrays have been used for quantitative detection of vital fungal spores of Aspergillus niger and Saccharomyces cerevisiae. The specific adsorption and growth on concanavalin A, fibronectin, or immunoglobulin G cantilever surfaces was investigated. Maximum spore immobilization, germination, and mycelium growth was observed on the immunoglobulin G-functionalized cantilever surfaces, as measured from shifts in resonance frequency within a few hours, being much faster than with standard petri dish cultivation [15.164]. Short peptide ligands can be used to efficiently capture Bacillus subtilis (a simulant of Bacillus anthracis) spores in liquids. Fifth-mode resonant frequency measurements were performed before and after dipping microcantilever arrays into a static B. subtilis solution showing a substantial decrease in frequency for binding-peptide-coated microcantilevers as compared to that for control peptide cantilevers [15.165].
Medical
A bioassay of prostate-specific antigen (PSA) using microcantilevers has been presented in [15.166], covering a wide range of concentrations from 0.2 ng ∕ ml to 60 μg ∕ ml in a background of human serum albumin (HSA ). Detection has been confirmed by another group using microcantilevers in resonant mode [15.167, 15.168]. The feasibility of detecting severe acute respiratory syndrome-associated coronavirus (SARS-CoV) using microcantilever technology was studied in [15.169] by showing that the feline coronavirus (FIP) type I virus can be detected by a microcantilever modified by feline coronavirus (FIP) type I antiviral antiserum. A method for quantification of a prostate cancer biomarker in urine without sample preparation using monoclonal antibodies was described in [15.170].
Microcantilever Sensorsto Measure Physical Properties
Besides chemical and biochemical sensing, microcantilevers can also detect changes in physical properties of surrounding media, such as gas or liquid, or of layers deposited on the cantilever itself.
Density and Viscosity
A piezoelectric unimorph cantilever as a liquid viscosity-and-density sensor was tested using water-glycerol solutions of different compositions, whereby the resonance frequency decreased while the width of the resonance peak increased with increasing glycerol content [15.171]. The viscosity of complex organic liquids with non-Newtonian behavior was studied in [15.172] over a wide range from 10 to 500 mm2 ∕ s. Simultaneous determination of density and viscosity of water-ethanol mixtures based on resonance curves of microcantilevers was reported in [15.173]. A detailed theoretical study of viscoelastic effects on the frequency shift of microcantilever chemical sensors was presented in [15.174]. Microcantilever deflection as a function of flow speed of viscous fluids was investigated in [15.175]. Viscosity of sugar solutions has been tested using microcantilevers [15.176].
Gas and Flow Sensing
Gas sensing not only involves chemical detection, but also pressure and flow sensing . Brown et al. [15.177] studied the behavior of magnetically actuated oscillating microcantilevers at large deflections and found hysteresis behavior at resonance. The amplitude at the actuation frequency changes, depending on pressure due to damping. The authors used cantilever-in-cantilever (CIC ) structures, and observed changes in deflection as gas pressure was varied. At atmospheric pressure, damping is large and the oscillation amplitude is relative small and hysteresis effects are absent. At lower pressure, abrupt changes in the oscillation amplitude occur with changes in the driving frequency. Since the change of amplitude and driving frequency, at which they occur is pressure dependent, these quantities can be used for accurate determination of gas pressure, demonstrated in the range between 10−3 and 102 mbar. Brown et al. [15.178] emphasized that microelectromechanical system pressure sensors will have a wide range of applications, especially in the automotive industry. Piezoresistive-cantilever-based deflection measurement has major advantages over diaphragms. The pressure range has been extended to 15−1450 mbar by means of design geometry adaptation. Su et al. [15.179] presented highly sensitive ultrathin piezoresistive silicon microcantilevers for gas velocity sensing, whereby the deflection increased with airflow distribution in a steel pipe. The detection principle was based on normal pressure drag producing bending of the cantilever. The minimum flow speed measured was 0.07 m ∕ s, which is comparable to classical hot-wire anemometers. Mertens et al. [15.180] have investigated the effects of temperature and pressure on microcantilever resonance response in helium and nitrogen. Resonance response as a function of pressure showed three different regimes, which correspond to molecular flow, transition regimes and viscous flow, whereby the frequency variation of the cantilever is mainly due to changes in the mean free path of gas molecules. Effects observed allow measurement of pressures between 10−2−106 Pa. Mortet et al. [15.181] presented a pressure sensor based on a piezoelectric bimorph microcantilever with a measurement range between 0.1 and 8.5 bar. The resonance frequency shift was constant for pressures below 0.5 bar. For higher pressures the sensitivity was typically a few ppm ∕ mbar, but depended on the mode number. Sievilä et al. [15.182] presented a cantilever paddle within a frame that operated like a moving mirror to detect displacements in the oscillating cantilever using a He/Ne laser in a Michelson interferometer configuration, whereby the cantilever acted as a moving mirror element in one path of the interferometer. A fixed mirror served as a reference in the other arm of the interferometer.
Thermal Expansion
The thermal expansion of TaOxNy thin films deposited on a microcantilever was measured to examine the residual stress and the thermal expansion coefficient by observing changes in radius of curvature [15.183]. Thermal drift issues of resonating microcantilevers were discussed in detail in [15.184].
Infrared
Microcantilevers can also be used as uncooled, microcantilever-based infrared (IR) imaging devices by monitoring the bending of the microcantilever as a function of the IR radiation intensity incident on the cantilever surface. The infrared (thermal) image of the source is obtained by rastering a single microfabricated cantilever across the image formed at the focal plane of a concave mirror [15.185, 15.186, 15.187]. The method was later refined such that photons are detected using the stress caused by photoelectrons emitted from a Pt film surface in contact with a semiconductor microstructure, which forms a Schottky barrier. The photo-induced bending of the Schottky barrier microstructure is due to electronic stress produced by photoelectrons diffusing into the microstructure [15.188]. The performance of IR imaging via microcantilevers has been enhanced by one-fold leg and two-fold leg beam structures with absorber plates [15.189, 15.190, 15.191].
Recent Developments
More than two decades after the first reports on the use of cantilevers as sensors the field is still active with a substantial number of research groups working and publishing. A new trend is the integration of novel materials as sensing layers or the direct use of them as nanomechanical structures. Mass sensing in ultrahigh vacuum down to the yoctogram (10−24 g) range by employing a frequency-modulation mixing technique for the readout of a carbon nanotube resonator has recently been demonstrated by Chaste et al. [15.192]. Electrochemistry is reported to be a way to control the surface of a microcantilever biosensor [15.193], as the topography of the functionalized cantilever surface seems to influence the efficiency of detection [15.194]. In biochemical measurements the work by Mukhopadhyay et al. [15.195] represents major progress in reliable recognition of DNA by using modified versions of DNA like PNA (peptide nucleic acid) and LNA (locked nuclei acid) having different sugar backbones. Especially for detection of single base mismatches PNA and LNA produce more reliable results [15.196]. The effects of hydration might play an important role in DNA hybridization [15.197]. Ndieyira et al. [15.198] report on nanomechanical detection of antibiotic resistance in bacteria by observing antibiotic-mucopeptide binding, even in blood serum [15.199]. Significant progress in high-throughput screening with cantilever sensors combined with a DVD-ROM-based optical readout technique has been reported by the Boisen group [15.200]. Detection of femtomolar concentrations of oligonucleotides in a complex background of total cellular RNA extracts from cell lines without labeling or amplification has been achieved by Mishra et al. [15.201] giving the perspective of RNA pharmacokinetics, nucleic acid biomarker assays, and miRNA quantification for disease monitoring and diagnosis. Huber et al. [15.202, 15.203] demonstrated application of cantilever sensor arrays for detection of melanoma, based on the presence of a predominant mutation in the BRAF gene. Detection of this single-point mutation allows one to screen melanoma patients for eligibility for treatment with a specific drug which only works if this point mutation is present. Detection and monitoring of Aspergillus niger growth directly on an oscillating cantilever using the first two flexural resonance modes has been observed in [15.204]. Even single spore growth has been observed within 10 h and is reported in [15.205]. A very ingenious way to detect motility of bacteria has been described by Longo et al. [15.206]. They show that fluctuations (noise) in the dc signal of cantilevers onto which low numbers of bacteria have been attached, characterize their metabolism. The technique quantitatively screens (within minutes) the response of bacteria such as Escherichia coli and Staphylococcus aureus to antibiotics. Living bacteria produced larger cantilever fluctuations than bacteria exposed to antibiotics [15.207]. A major contribution to the problem of chemical sensitivity of cantilever sensors has been published by the Thundat group. By using photothermal spectroscopy molecules adsorbing on a bimetallic cantilever can be qualitatively identified [15.208]. The technique is even capable of distinguishing both anti and gauche conformers of EtOH based on wavelength-dependent cantilever deflections [15.209]. Deeper theoretical understanding of viscoelastic phenomena in vibrating nanostructures is described in [15.210].
Conclusions and Outlook
Cantilever-sensor array techniques have turned out to be a very powerful and highly sensitive tool to study physisorption and chemisorption processes, as well as to determine material-specific properties such as heat transfer during phase transitions. Experiments in liquids have provided new insights into such complex biochemical reactions as the hybridization of DNA or molecular recognition in antibody-antigen systems or proteomics.
Future developments must go towards technological applications, in particular to find new ways to characterize real-world samples such as clinical samples. The development of medical diagnosis tools requires an improvement of the sensitivity of a large number of genetic tests to be performed with small amounts of single donor-blood or body-fluid samples at low cost. From a scientific point of view, the challenge lies in optimizing cantilever sensors to improve their sensitivity to the ultimate limit: the detection of individual molecules.
Several fundamentally new concepts in microcantilever sensing are described in the recent literature, and these could help to achieve these goals: the issue of low quality factor of resonating microcantilevers in liquid has been elegantly solved by fabrication of a hollow cantilever that can be filled with biochemical liquids. Confining the fluid to the inside of a hollow cantilever also allows direct integration with conventional microfluidic systems, and significantly increases sensitivity by eliminating high damping and viscous drag [15.211]. Biochemical selectivity can be enhanced by using enantioselective receptors [15.212]. Other shapes for micromechanical sensors like microspirals could be advantageous for biochemical detection [15.213]. Miniaturization of microcantilevers down to true nanometric dimensions, for example by using single-wall carbon nanotubes [15.214] or graphene sheets [15.215] will further increase sensitivity. Reports on optomechanical coupling to graphene-based oscillators via microwaves are already available [15.216]. Single-layer graphene films have also been applied as pressure sensors [15.217].
What is still lacking after two decades of development is the ease of use of cantilever array sensors. Complicated alignment and calibration procedures should be avoided and preparatory steps before measurement should be automatized. Functionalization and measurement protocols must be standardized, so that every user gets the same results when doing the same experiment. Array-to-array variability must be reduced and evaluation of results must be done in a transparent and reproducible way. We should still keep in mind that we are measuring with cantilever sensors an indirect mechanically transduced response and not a primary physical quantity. Nevertheless, nanomechanical cantilever array sensors offer possibilities to monitor molecular processes that are inaccessible or barely measurable using traditional techniques.
Acknowledgements
We thank R. McKendry (University College London, London, U.K.), J. Zhang, A. Bietsch, V. Barwich, M. Ghatkesar, T. Braun, F. Huber, N. Backmann, J.-P. Ramseyer, P. Oliva, H.R. Hidber, E. Meyer, and the late H.-J. Güntherodt (University of Basel, Basel, Switzerland) for valuable contributions and discussions, as well as U. Drechsler, M. Despont, H. Schmid, E. Delamarche, H. Wolf, R. Stutz, R. Allenspach, and P.F. Seidler (IBM Research, Zurich Research Laboratory, Rüschlikon, Switzerland). We are grateful for MSS collaboration with G. Yoshikawa, T. Akiyama, F. Loizeau, S. Gautsch, P. Vettiger, and Nico de Rooij. We acknowledge the continuous technical support from A. Tonin, R. Maffiolini (electronics workshop), H. Breitenstein, S. Martin and his crew (mechanical workshop) in the Department of Physics, University of Basel. We thank the Swiss Nanoscience Institute (SNI), NanoTera Program (projects 853_406, 20NA21_150957 and MSSdevices), the Cleven Foundation, and the Swiss National Science Foundation for financial support.
Contributor Information
Hans Peter Lang, Email: hans-peter.lang@unibas.ch.
Martin Hegner, Email: martin.hegner@tcd.ie.
Christoph Gerber, Email: christoph.gerber@unibas.ch.
References
- 15.1.Binnig G, Quate CF, Gerber C. Atomic force microscope. Phys. Rev. Lett. 1986;56:930–933. doi: 10.1103/PhysRevLett.56.930. [DOI] [PubMed] [Google Scholar]
- 15.2.Wilfinger RJ, Bardell PH, Chhabra DS. The Resonistor, a frequency sensitive device utilizing the mechanical resonance of a silicon substrate. IBM J. Res. Div. 1968;12:113–118. [Google Scholar]
- 15.3.Heng TMS. Trimming of microstrip circuits utilizing microcantilever air gaps. IEEE Trans. Microw. Theory Technol. 1971;19:652–654. [Google Scholar]
- 15.4.Petersen KE. Micromechanical membrane switches on silicon. IBM J. Res. Develop. 1979;23:376–385. [Google Scholar]
- 15.5.E.S. Kolesar: Electronic Nerve Agent Detector, United States Patent 4549427 (1983), filed Sep. 19
- 15.6.Itoh T, Suga T. Force sensing microcantilever using sputtered zinc-oxide thin-film. Appl. Phys. Lett. 1994;64:37–39. [Google Scholar]
- 15.7.Cleveland JP, Manne S, Bocek D, Hansma PK. A nondestructive method for determining the spring constant of cantilevers for scanning force microscopy. Rev. Sci. Instrum. 1993;64:403–405. [Google Scholar]
- 15.8.Thundat T, Warmack RJ, Chen GY, Allison DP. Thermal and ambient-induced deflections of scanning force microscope cantilevers. Appl. Phys. Lett. 1994;64:2894–2896. [Google Scholar]
- 15.9.Gimzewski JK, Gerber Ch, Meyer E, Schlittler RR. Observation of a chemical reaction using a micromechanical sensor. Chem. Phys. Lett. 1994;217:589–594. [Google Scholar]
- 15.10.Thundat T, Chen GY, Warmack RJ, Allison DP, Wachter EA. Vapor detection using resonating microcantilevers. Anal. Chem. 1995;67:519–521. [Google Scholar]
- 15.11.Lang HP, Berger R, Andreoli C, Brugger J, Despont M, Vettiger P, Gerber Ch, Gimzewski JK, Ramseyer J-P, Meyer E, Güntherodt H-J. Sequential position readout from arrays of micromechanical cantilever sensors. Appl. Phys. Lett. 1998;72:383–385. [Google Scholar]
- 15.12.Ibach H. Adsorbate-induced surface stress. J. Vac. Sci. Technol. A. 1994;12:2240–2245. [Google Scholar]
- 15.13.Berger R, Delamarche E, Lang HP, Gerber C, Gimzewski JK, Meyer E, Güntherodt H-J. Surface stress in the self-assembly of alkanethiols on gold. Science. 1997;276:2021–2024. [Google Scholar]
- 15.14.Barnes JR, Stephenson RJ, Welland ME, Gerber C, Gimzewski JK. Photothermal spectroscopy with femtojoule sensitivity based on micromechanics. Nature. 1994;372:79–81. [Google Scholar]
- 15.15.Stoney GG. The tension of metallic films deposited by electrolysis. Proc. R. Soc. London, Ser. A. 1909;82:172–177. [Google Scholar]
- 15.16.von Preissig FJ. Applicability of the classical curvature-stress relation for thin films on plate substrates. J. Appl. Phys. 1989;66:4262–4268. [Google Scholar]
- 15.17.Fritz J, Baller MK, Lang HP, Rothuizen H, Vettiger P, Meyer E, Güntherodt H-J, Gerber C, Gimzewski JK. Translating biomolecular recognition into nanomechanics. Science. 2000;288:316–318. doi: 10.1126/science.288.5464.316. [DOI] [PubMed] [Google Scholar]
- 15.18.Alvarez M, Carrascosa LG, Moreno M, Calle A, Zaballos A, Lechuga LM, Martinez-A C, Tamayo J. Nanomechanics of the formation of DNA self-assembled monolayers and hybridization on microcantilevers. Langmuir. 2004;20:9663–9668. doi: 10.1021/la0489559. [DOI] [PubMed] [Google Scholar]
- 15.19.Sarid D. Scanning Force Microscopy with Applications to Electric, Magnetic, and Atomic Forces. New York: Oxford Univ. Press; 1991. [Google Scholar]
- 15.20.Berger R, Lang HP, Gerber C, Gimzewski JK, Fabian JH, Scandella L, Meyer E, Güntherodt H-J. Micromechanical thermogravimetry. Chem. Phys. Lett. 1998;294:363–369. [Google Scholar]
- 15.21.Sader JE. Frequency response of cantilever beams immersed in viscous fluids with applications to the atomic force microscope. J. Appl. Phys. 1998;84:64–76. [Google Scholar]
- 15.22.Bachels T, Tiefenbacher F, Schafer R. Condensation of isolated metal clusters studied with a calorimeter. J. Chem. Phys. 1999;110:10008–10015. [Google Scholar]
- 15.23.Barnes JR, Stephenson RJ, Woodburn CN, O’Shea SJ, Welland ME, Rayment T, Gimzewski JK, Gerber C. A femtojoule calorimeter using micromechanical sensors. Rev. Sci. Instrum. 1994;65:3793–3798. [Google Scholar]
- 15.24.Brunt TA, Rayment T, O’Shea SJ, Welland ME. Measuring the surface stresses in an electrochemically deposited monolayer: Pb on Au(111) Langmuir. 1996;12:5942–5946. [Google Scholar]
- 15.25.Puers R, Lapadatu D. Electrostatic forces and their effects on capacitive mechanical sensors. Sens. Actuat. A. 1996;56:203–210. [Google Scholar]
- 15.26.Fricke J, Obermaier C. Cantilever beam accelerometer based on surface micromachining technology. J. Micromech. Microeng. 1993;3:190–192. [Google Scholar]
- 15.27.Lee C, Itoh T, Ohashi T, Maeda R, Suga T. Development of a piezoelectric self-excitation and self-detection mechanism in PZT microcantilevers for dynamic scanning force microscopy in liquid. J. Vac. Sci. Technol. B. 1997;15:1559–1563. [Google Scholar]
- 15.28.Göddenhenrich T, Lemke H, Hartmann U, Heiden C. Force microscope with capacitive displacement detection. J. Vac. Sci. Technol. A. 1990;8:383–387. [Google Scholar]
- 15.29.Brugger J, Buser RA, de Rooij NF. Micromachined atomic force microprobe with integrated capacitive read-out. J. Micromech. Microeng. 1992;2:218–220. [Google Scholar]
- 15.30.Schönenberger C, Alvarado SF. A differential interferometer for force microscopy. Rev. Sci. Instrum. 1989;60:3131–3134. [Google Scholar]
- 15.31.Cunningham MJ, Cheng ST, Clegg WW. A differential interferometer for scanning force microscopy. Meas. Sci. Technol. 1994;5:1254–1350. [Google Scholar]
- 15.32.Meyer G, Amer NM. Novel optical approach to atomic force microscopy. Appl. Phys. Lett. 1988;53:2400–2402. [Google Scholar]
- 15.33.Yoshikawa G, Akiyama T, Gautsch S, Vettiger P, Rohrer H. Nanomechanical membrane-type surface stress sensor. Nano Lett. 2011;11:1044–1048. doi: 10.1021/nl103901a. [DOI] [PubMed] [Google Scholar]
- 15.34.Loizeau F, Akiyama T, Gautsch S, Vettiger P, Yoshikawa G, de Rooij N. Membrane-type surface stress sensor with piezoresistive readout. Procedia Eng. 2012;47:1085–1088. [Google Scholar]
- 15.35.Loizeau F, Lang HP, Akiyama T, Gautsch S, Vettiger SP, Tonin A, Yoshikawa G, Gerber Ch, de Rooij N. 26th IEEE Int. Confe. Micro Electro Mech. Syst. (MEMS) 2013. Piezoresistive membrane-type surface stress sensors arranged in arrays for cancer diagnosis through breath analysis; pp. 621–624. [Google Scholar]
- 15.36.Yoshikawa G, Akiyama T, Loizeau F, Shiba K, Gautsch S, Nakayamam T, Vettiger P, de Rooij N, Aono M. Two dimensional array of piezoresistive nanomechanical membrane-type surface stress sensor (MSS) with improved sensitivity. Sensors. 2012;12:15873–15887. doi: 10.3390/s121115873. [DOI] [PMC free article] [PubMed] [Google Scholar]
- 15.37.Yoshikawa G. Nanomechanical sensors and membrane-type surface stress sensor (MSS) for medical, security and environmental applications. In: Ariga K, editor. Manipulation of Nanoscale Materials: An Introduction to Nanoarchitectonics, RSC Nanoscience and Nanotechnology. Cambridge: The Royal Society of Chemistry; 2012. pp. 428–448. [Google Scholar]
- 15.38.Yoshikawa G, Loizeau F, Lee CJY, Akiyama T, Shiba K, Gautsch S, Nakayama T, Vettiger P, de Rooij NF, Aono M. Double-side-coated nanomechanical membrane-type surface stress sensor (MSS) for one-chip-one-channel setup. Langmuir. 2013;29:7551–7556. doi: 10.1021/la3046719. [DOI] [PubMed] [Google Scholar]
- 15.39.Yoshikawa G, Lee CJY, Shiba K. Effects of coating materials on two dimensional stress-induced deflection of nanomechanical sensors. J. Nanosci. Nanotechnol. 2014;14:2908–2912. doi: 10.1166/jnn.2014.8604. [DOI] [PubMed] [Google Scholar]
- 15.40.Loizeau F, Akiyama T, Gautsch S, Vettiger P, Yoshikawa G, de Rooij NF. Comparing membrane- and cantilever-based surface stress sensors for reproducibility. Sens. Act. A. 2015;228:9–15. [Google Scholar]
- 15.41.Imamura G, Shiba K, Yoshikawa G. Finite element analysis on nanomechanical detection of small particles: Toward virus detection. Front. Microbiol. 2016;7:488. doi: 10.3389/fmicb.2016.00488. [DOI] [PMC free article] [PubMed] [Google Scholar]
- 15.42.Lang HP, Loizeau F, Hiou A, Rivals J-P, Romero P, Akiyama T, Gerber C, Meyer E. Proc. 2nd Int. Electron. Conf. Sens. Appl. 2015. Piezoresistive membrane surface stress sensors for characterization of breath samples of head & neck cancer patients. [DOI] [PMC free article] [PubMed] [Google Scholar]
- 15.43.Berger R, Gerber C, Gimzewski JK, Meyer E, Güntherodt H-J. Thermal analysis using a micromechanical calorimeter. Appl. Phys. Lett. 1996;69:40–42. [Google Scholar]
- 15.44.Scandella L, Binder G, Mezzacasa T, Gobrecht J, Berger R, Lang HP, Gerber C, Gimzewski JK, Koegler JH, Jansen JC. Combination of single crystal zeolites and microfabrication: Two applications towards zeolite nanodevices. Microporous Mesoporous Mater. 1998;21:403–409. [Google Scholar]
- 15.45.Berger R, Gerber C, Lang HP, Gimzewski JK. Micromechanics: a toolbox for femtoscale science: Towards a laboratory on a tip. Microelectron. Eng. 1997;35:373–379. [Google Scholar]
- 15.46.Lang HP, Berger R, Battiston FM, Ramseyer J-P, Meyer E, Andreoli C, Brugger J, Vettiger P, Despont M, Mezzacasa T, Scandella L, Güntherodt H-J, Gerber C, Gimzewski JK. A chemical sensor based on a micromechanical cantilever array for the identification of gases and vapors. Appl. Phys. A. 1998;66:S61–S64. [Google Scholar]
- 15.47.Baller MK, Lang HP, Fritz J, Gerber Ch, Gimzewski JK, Drechsler U, Rothuizen H, Despont M, Vettiger P, Battiston FM, Ramseyer J-P, Fornaro P, Meyer E, Güntherodt H-J. A cantilever array based artificial nose. Ultramicroscopy. 2000;82:1–9. doi: 10.1016/s0304-3991(99)00123-0. [DOI] [PubMed] [Google Scholar]
- 15.48.Cesaro-Tadic S, Dernick G, Juncker D, Buurman G, Kropshofer H, Michel B, Fattinger C, Delamarche E. High-sensitivity miniaturized immunoassays for tumor necrosis factor α using microfluidic systems. Lab Chip. 2004;4:563–569. doi: 10.1039/b408964b. [DOI] [PubMed] [Google Scholar]
- 15.49.Fritz J, Baller MK, Lang HP, Strunz T, Meyer E, Güntherodt H-J, Delamarche E, Gerber Ch, Gimzewski JK. Stress at the solid-liquid interface of self-assembled monolayers on gold investigated with a nanomechanical sensor. Langmuir. 2000;16:9694–9696. [Google Scholar]
- 15.50.McKendry R, Zhang J, Arntz Y, Strunz T, Hegner M, Lang HP, Baller MK, Certa U, Meyer E, Güntherodt H-J, Gerber C. Multiple label-free biodetection and quantitative DNA-binding assays on a nanomechanical cantilever array. Proc. Nat. Acad. Sci. USA. 2002;99:9783–9787. doi: 10.1073/pnas.152330199. [DOI] [PMC free article] [PubMed] [Google Scholar]
- 15.51.Arntz Y, Seelig JD, Lang HP, Zhang J, Hunziker P, Ramseyer J-P, Meyer E, Hegner M, Gerber C. Label-free protein assay based on a nanomechanical cantilever array. Nanotechnology. 2003;14:86–90. [Google Scholar]
- 15.52.Bietsch A, Hegner M, Lang HP, Gerber C. Inkjet deposition of alkanethiolate monolayers and DNA oligonucleotides on gold: Evaluation of spot uniformity by wet etching. Langmuir. 2004;20:5119–5122. doi: 10.1021/la049621m. [DOI] [PubMed] [Google Scholar]
- 15.53.Bietsch A, Zhang J, Hegner M, Lang HP, Gerber C. Rapid functionalization of cantilever array sensors by inkjet printing. Nanotechnology. 2004;15:873–880. [Google Scholar]
- 15.54.Lange D, Hagleitner C, Hierlemann A, Brand O, Baltes H. Complementary metal oxide semiconductor cantilever arrays on a single chip: Mass-sensitive detection of volatile organic compounds. Anal. Chem. 2002;74:3084–3085. doi: 10.1021/ac011269j. [DOI] [PubMed] [Google Scholar]
- 15.55.Savran CA, Burg TP, Fritz J, Manalis SR. Microfabricated mechanical biosensor with inherently differential readout. Appl. Phys. Lett. 2003;83:1659–1661. [Google Scholar]
- 15.56.Okuyama S, Mitobe Y, Okuyama K, Matsushita K. Hydrogen gas sensing using a Pd-coated cantilever. Jpn. J. Appl. Phys. 2000;39:3584–3590. [Google Scholar]
- 15.57.Fabre A, Finot E, Demoment J, Contreras S. Monitoring the chemical changes in Pd induced by hydrogen absorption using microcantilevers. Ultramicroscopy. 2003;97:425–432. doi: 10.1016/S0304-3991(03)00070-6. [DOI] [PubMed] [Google Scholar]
- 15.58.Baselt DR, Fruhberger B, Klaassen E, Cemalovic S, Britton CL, Patel SV, Mlsna TE, McCorkle D, Warmack B. Design and performance of a microcantilever-based hydrogen sensor. Sens. Act. B Chem. 2003;88:120–131. [Google Scholar]
- 15.59.Chou Y-I, Chiang H-C, Wang C-C. Study on Pd functionalization of microcantilever for hydrogen detection promotion. Sens. Act. B Chem. 2008;129:72–78. [Google Scholar]
- 15.60.Scandella L, Binder G, Mezzacasa T, Gobrecht J, Berger R, Lang HP, Gerber C, Gimzewski JK, Koegler JH, Jansen JC. Combination of single crystal zeolites and microfabrication: Two applications towards zeolite nanodevices. Microporous Mesoporous Mat. 1998;21:403–409. [Google Scholar]
- 15.61.Gunter RL, Delinger WD, Porter TL, Stewart R, Reed J. Hydration level monitoring using embedded piezoresistive microcantilever sensors. Med. Eng. Phys. 2005;27:215–220. doi: 10.1016/j.medengphy.2004.10.005. [DOI] [PubMed] [Google Scholar]
- 15.62.Shi X, Chen Q, Fang J, Varahramyan K, Ji HF. Al2O3-coated microcantilevers for detection of moisture at ppm level. Sens. Act. B Chem. 2008;129:241–245. [Google Scholar]
- 15.63.Zhou J, Li P, Zhang S, Long YC, Zhou F, Huang YP, Yang PY, Bao MH. Zeolite-modified microcantilever gas sensor for indoor air quality control. Sens. Act. B Chem. 2003;94:337–342. [Google Scholar]
- 15.64.Vidic A, Then D, Ziegler C. A new cantilever system for gas and liquid sensing. Ultramicroscopy. 2003;97:407–416. doi: 10.1016/s0304-3991(03)00068-8. [DOI] [PubMed] [Google Scholar]
- 15.65.Berger R, Delamarche E, Lang HP, Gerber C, Gimzewski JK, Meyer E, Guntherodt HJ. Surface stress in the self-assembly of alkanethiols on gold probed by a force microscopy technique. Appl. Phys. A Mater. 1998;66:S55–S59. [Google Scholar]
- 15.66.Datskos PG, Sauers I. Detection of 2-mercaptoethanol using gold-coated micromachined cantilevers. Sens. Act. B Chem. 1999;61:75–82. [Google Scholar]
- 15.67.Itakura AN, Berger R, Narushima T, Kitajima M. Low-energy ion-induced tensile stress of self-assembled alkanethiol monolayers. Appl. Phys. Lett. 2002;80:3712–3714. [Google Scholar]
- 15.68.Godin M, Williams PJ, Tabard-Cossa V, Laroche O, Beaulieu LY, Lennox RB, Grutter P. Surface stress, kinetics, and structure of alkanethiol self-assembled monolayers. Langmuir. 2004;20:7090–7096. doi: 10.1021/la030257l. [DOI] [PubMed] [Google Scholar]
- 15.69.Desikan R, Lee I, Thundat T. Effect of nanometer surface morphology on surface stress and adsorption kinetics of alkanethiol self-assembled monolayers. Ultramicroscopy. 2006;106:795–799. doi: 10.1016/j.ultramic.2005.11.012. [DOI] [PubMed] [Google Scholar]
- 15.70.Jeon S, Jung N, Thundat T. Nanomechanics of a self-assembled monolayer on microcantilever sensors measured by a multiple-point deflection technique. Sens. Act. B Chem. 2007;122:365–368. [Google Scholar]
- 15.71.Rijal K, Mutharasan R. Method for measuring the self-assembly of alkanethiols on gold at femtomolar concentrations. Langmuir. 2007;23:6856–6863. doi: 10.1021/la063768r. [DOI] [PubMed] [Google Scholar]
- 15.72.Kohale S, Molina SM, Weeks BL, Khare R, Hope-Weeks LJ. Monitoring the formation of self-assembled monolayers of alkanedithiols using a micromechanical cantilever sensor. Langmuir. 2007;23:1258–1263. doi: 10.1021/la062441n. [DOI] [PubMed] [Google Scholar]
- 15.73.Desikan R, Armel S, Meyer HM, Thundat T. Effect of chain length on nanomechanics of alkanethiol self-assembly. Nanotechnology. 2007;18:424028. [Google Scholar]
- 15.74.Rogers B, Manning L, Jones M, Sulchek T, Murray K, Beneschott B, Adams JD, Hu Z, Thundat T, Cavazos H, Minne SC. Mercury vapor detection with a self-sensing, resonating piezoelectric cantilever. Rev. Sci. Instrum. 2003;74:4899–4901. [Google Scholar]
- 15.75.Ji HF, Zhang YF, Purushotham VV, Kondu S, Ramachandran B, Thundat T, Haynie DT. 1,6-Hexanedithiol monolayer as a receptor for specific recognition of alkylmercury. Analyst. 2005;130:1577–1579. doi: 10.1039/b513144h. [DOI] [PubMed] [Google Scholar]
- 15.76.Kadam AR, Nordin GP, George MA. Use of thermally induced higher order modes of a microcantilever for mercury vapor detection. J. Appl. Phys. 2006;99:094905. [Google Scholar]
- 15.77.Kadam AR, Nordin GP, George MA. Comparison of microcantilever Hg sensing behavior with thermal higher order modes for as-deposited sputtered and thermally evaporated Au films. J. Vac. Sci. Technol. B. 2006;24:2271–2275. [Google Scholar]
- 15.78.Ji HF, Finot E, Dabestani R, Thundat T, Brown GM, Britt PF. A novel self-assembled monolayer (SAM) coated microcantilever for low level caesium detection. Chem. Commun. 2000;6:457–458. [Google Scholar]
- 15.79.Brunt TA, Rayment T, O’Shea SJ, Welland ME. Measuring the surface stresses in an electrochemically deposited metal monolayer: Pb on Au(111) Langmuir. 1996;12:5942–5946. [Google Scholar]
- 15.80.Mertens J, Finot E, Nadal MH, Eyraud V, Heintz O, Bourillot E. Detection of gas trace of hydrofluoric acid using microcantilever. Sens. Act. B Chem. 2004;99:58–65. [Google Scholar]
- 15.81.Tang YJ, Fang J, Xu XH, Ji HF, Brown GM, Thundat T. Detection of femtomolar concentrations of HF using an SiO2 microcantilever. Anal. Chem. 2004;76:2478–2481. doi: 10.1021/ac035140g. [DOI] [PubMed] [Google Scholar]
- 15.82.Mertens J, Finot E, Heintz O, Nadal M-H, Eyraud V, Cathelat A, Legay G, Bourillot E, Dereux A. Changes in surface stress, morphology and chemical composition of silica and silicon nitride surfaces during the etching by gaseous HF acid. Appl. Surf. Sci. 2007;253:5101–5108. [Google Scholar]
- 15.83.Porter TL, Vail TL, Eastman MP, Stewart R, Reed J, Venedam R, Delinger W. A solid-state sensor platform for the detection of hydrogen cyanide gas. Sens. Act. B Chem. 2007;123:313–317. [Google Scholar]
- 15.84.Ji HF, Thundat T, Dabestani R, Brown GM, Britt PF, Bonnesen PV. Ultrasensitive detection of CrO42− using a microcantilever sensor. Anal. Chem. 2001;73:1572–1576. doi: 10.1021/ac0013103. [DOI] [PubMed] [Google Scholar]
- 15.85.Xu XH, Thundat TG, Brown GM, Ji HF. Detection of Hg2+ using microcantilever sensors. Anal. Chem. 2002;74:3611–3615. doi: 10.1021/ac0255781. [DOI] [PubMed] [Google Scholar]
- 15.86.Cherian S, Mehta A, Thundat T. Investigating the mechanical effects of adsorption of Ca2+ ions on a silicon nitride microcantilever surface. Langmuir. 2002;18:6935–6939. [Google Scholar]
- 15.87.Cherian S, Gupta RK, Mullin BC, Thundat T. Detection of heavy metal ions using protein-functionalized microcantilever sensors. Biosens. Bioelectron. 2003;19:411–416. doi: 10.1016/s0956-5663(03)00226-4. [DOI] [PubMed] [Google Scholar]
- 15.88.Liu K, Ji HF. Detection of Pb2+ using a hydrogel swelling microcantilever sensor. Anal. Sci. 2004;20:9–11. doi: 10.2116/analsci.20.9. [DOI] [PubMed] [Google Scholar]
- 15.89.Dutta P, Chapman PJ, Datskos PG, Sepaniak MJ. Characterization of ligand-functionalized microcantilevers for metal ion sensing. Anal. Chem. 2005;77:6601–6608. doi: 10.1021/ac051082i. [DOI] [PubMed] [Google Scholar]
- 15.90.Tian F, Boiadjiev VI, Pinnaduwage LA, Brown GM, Thundat T. Selective detection of Cr(VI) using a microcantilever electrode coated with a self-assembled monolayer. J. Vac. Sci. Technol. A. 2005;23:1022–1028. [Google Scholar]
- 15.91.Boiadjiev VI, Brown GM, Pinnaduwage LA, Goretzki G, Bonnesen PV, Thundat T. Photochemical hydrosilylation of 11-undecenyltriethylammonium bromide with hydrogen-terminated Si surfaces for the development of robust microcantilever sensors for Cr(VI) Langmuir. 2005;21:1139–1142. doi: 10.1021/la047852n. [DOI] [PubMed] [Google Scholar]
- 15.92.Carrington NA, Yong L, Xue Z-L. Electrochemical deposition of sol-gel films for enhanced chromium(VI) determination in aqueous solutions. Anal. Chim. Acta. 2006;572:17–24. doi: 10.1016/j.aca.2006.05.020. [DOI] [PMC free article] [PubMed] [Google Scholar]
- 15.93.Velanki S, Kelly S, Thundat T, Blake DA, Ji HF. Detection of Cd(II) using antibody-modified microcantilever sensors. Ultramicroscopy. 2007;107:1123–1128. doi: 10.1016/j.ultramic.2007.01.011. [DOI] [PubMed] [Google Scholar]
- 15.94.Jensenius H, Thaysen J, Rasmussen AA, Veje LH, Hansen O, Boisen A. A microcantilever-based alcohol vapor sensor-application and response model. Appl. Phys. Lett. 2000;76:2815–2817. [Google Scholar]
- 15.95.Hierlemann A, Lange D, Hagleitner C, Kerness N, Koll A, Brand O, Baltes H. Application-specific sensor systems based on CMOS chemical microsensors. Sens. Act. B Chem. 2000;70:2–11. [Google Scholar]
- 15.96.Lange D, Hagleitner C, Hierlemann A, Brand O, Baltes H. Complementary metal oxide semiconductor cantilever arrays on a single chip: Mass-sensitive detection of volatile organic compounds. Anal. Chem. 2002;74:3084–3095. doi: 10.1021/ac011269j. [DOI] [PubMed] [Google Scholar]
- 15.97.Vancura C, Rüegg M, Li Y, Hagleitner C, Hierlemann A. Magnetically actuated complementary metal oxide semiconductor resonant cantilever gas sensor systems. Anal. Chem. 2005;77:2690–2699. doi: 10.1021/ac048378t. [DOI] [PubMed] [Google Scholar]
- 15.98.Fadel L, Lochon F, Dufour I, Français O. Chemical sensing: millimeter size resonant microcantilever performance. J. Micromech. Microeng. 2004;14:S23–S30. [Google Scholar]
- 15.99.Wright YI, Kar AK, Kim YW, Scholz C, George MA. Study of microcapillary pipette-assisted method to prepare polyethylene glycol-coated microcantilever sensors. Sens. Act. B. 2005;107:242–251. [Google Scholar]
- 15.100.Senesac LR, Dutta P, Datskos PG, Sepianiak MJ. Analyte species and concentration identification using differentially functionalized microcantilever arrays and artificial neural networks. Anal. Chim. Acta. 2006;558:94–101. [Google Scholar]
- 15.101.Lochon F, Fadel L, Dufour I, Rebière D, Pistré J. Silicon made resonant microcantilever: Dependence of the chemical sensing performances on the sensitive coating thickness. Mat. Sci. Eng. C. 2006;26:348–353. [Google Scholar]
- 15.102.Satyanarayana S, McCormick DT, Majumdar A. Parylene micro membrane capacitive sensor array for chemical and biological sensing. Sens. Act. B. 2006;115:494–502. [Google Scholar]
- 15.103.Then D, Vidic A, Ziegler C. A highly sensitive self-oscillating cantilever array for the quantitative and qualitative analysis of organic vapor mixtures. Sens. Act. B. 2006;117:1–9. [Google Scholar]
- 15.104.Chapman PJ, Vogt F, Dutta P, Datskos PG, Devault GL, Sepianiak MJ. Facile hyphenation of gas chromatography and a microcantilever array sensor for enhanced selectivity. Anal. Chem. 2007;79:364–370. doi: 10.1021/ac061389x. [DOI] [PubMed] [Google Scholar]
- 15.105.Archibald R, Datskos P, Devault G, Lamberti V, Lavrik N, Noid D, Sepianiak M, Dutta P. Independent component analysis of nanomechanical responses of cantilever arrays. Anal. Chim. Acta. 2007;584:101–105. doi: 10.1016/j.aca.2006.11.007. [DOI] [PubMed] [Google Scholar]
- 15.106.Alvarez M, Calle A, Tamayo J, Lechuga LM, Abad A, Montoya A. Development of nanomechanical biosensors for detection of the pesticide DDT. Biosens. Bioelectron. 2003;18:649–653. doi: 10.1016/s0956-5663(03)00035-6. [DOI] [PubMed] [Google Scholar]
- 15.107.Datskos PG, Sepaniak MJ, Tipple CA, Lavrik N. Photomechanical chemical microsensors. Sens. Act. B. 2001;76:393–402. [Google Scholar]
- 15.108.Pinnaduwage LA, Boiadjiev V, Hawk JE, Thundat T. Sensitive detection of plastic explosives with self-assembled monolayer-coated microcantilevers. Appl. Phys. Lett. 2003;83:1471–1473. [Google Scholar]
- 15.109.Pinnaduwage LA, Gehl A, Hedden DL, Muralidharan G, Thundat T, Lareau RT, Sulchek T, Manning L, Rogers B, Jones M, Adams JD. A microsensor for trinitrotoluene vapour. Nature. 2003;425:474–474. doi: 10.1038/425474a. [DOI] [PubMed] [Google Scholar]
- 15.110.Pinnaduwage LA, Yi D, Tian F, Thundat T, Lareau LT. Adsorption of trinitrotoluene on uncoated silicon micro-cantilever surfaces. Langmuir. 2004;20:2690–2694. doi: 10.1021/la035658f. [DOI] [PubMed] [Google Scholar]
- 15.111.Pinnaduwage LA, Wig A, Hedden DL, Gehl A, Yi D, Thundat T, Lareau RT. Detection of trinitrotoluene via deflagration on a microcantilever. J. Appl. Phys. 2004;95:5871–5875. [Google Scholar]
- 15.112.Pinnaduwage LA, Thundat T, Gehl A, Wilson SD, Hedden DL, Lareau RT. Desorption characteristics, of un-coated silicon microcantilever surfaces for explosive and common nonexplosive vapors. Ultramicroscopy. 2004;100:211–216. doi: 10.1016/j.ultramic.2003.11.006. [DOI] [PubMed] [Google Scholar]
- 15.113.Pinnaduwage LA, Thundat T, Hawk JE, Hedden DL, Britt R, Houser EJ, Stepnowski S, McGill RA, Bubb D. Detection of 2,4-dinitrotoluene using microcantilever sensors. Sens. Act. B. 2004;99:223–229. [Google Scholar]
- 15.114.Voiculescu I, Zaghloul ME, McGill RA, Houser EJ, Fedder GK. Electrostatically actuated resonant microcantilever beam in CMOS technology for the detection of chemical weapons. IEEE Sens. J. 2005;5:641–647. [Google Scholar]
- 15.115.Pinnaduwage LA, Ji HF, Thundat T. Moore’s law in homeland defense: An integrated sensor platform based on silicon microcantilevers. IEEE Sensors J. 2005;5:774–785. [Google Scholar]
- 15.116.Yang YM, Ji HF, Thundat T. Nerve agents detection using a Cu2+/L-cysteine bilayer-coated microcantilever. J. Am. Chem. Soc. 2003;125:1124–1125. doi: 10.1021/ja028181n. [DOI] [PubMed] [Google Scholar]
- 15.117.Ji HF, Yan XD, Zhang J, Thundat T. Molecular recognition of biowarfare agents using micromechanical sensors. Expert Rev. Mol. Diagn. 2004;4:859–866. doi: 10.1586/14737159.4.6.859. [DOI] [PubMed] [Google Scholar]
- 15.118.Ji HF, Hansen KM, Hu Z, Thundat T. Detection of pH variation using modified microcantilever sensors. Sens. Act. B Chem. 2001;72:233–238. [Google Scholar]
- 15.119.Bashir R, Hilt JZ, Elibol O, Gupta A, Peppas NA. Micromechanical cantilever as an ultrasensitive pH microsensor. Appl. Phys. Lett. 2002;81:3091–3093. [Google Scholar]
- 15.120.Zhang YF, Ji HF, Snow D, Sterling R, Brown GM. A pH sensor based on a microcantilever coated with intelligent hydrogel. Instrum. Sci. Technol. 2004;32:361–369. [Google Scholar]
- 15.121.Watari M, Galbraith J, Lang HP, Sousa M, Hegner M, Gerber Ch, Horton MA, McKendry RA. Investigating the molecular mechanisms of in-plane mechanochemistry on cantilever arrays. J. Am. Chem. Soc. 2007;129:601–609. doi: 10.1021/ja065222x. [DOI] [PubMed] [Google Scholar]
- 15.122.Subramanian A, Oden PI, Kennel SJ, Jacobson KB, Warmack RJ, Thundat T, Doktycz MJ. Glucose biosensing using an enzyme-coated microcantilever. Appl. Phys. Lett. 2002;81:385–387. [Google Scholar]
- 15.123.Yan XD, Ji HF, Lvov Y. Modification of microcantilevers using layer-by-layer nanoassembly film for glucose measurement. Chem. Phys. Lett. 2004;396:34–37. [Google Scholar]
- 15.124.Pei JH, Tian F, Thundat T. Glucose biosensor based on the microcantilever. Anal. Chem. 2004;76:292–297. doi: 10.1021/ac035048k. [DOI] [PubMed] [Google Scholar]
- 15.125.Yan XD, Xu XHK, Ji HF. Glucose oxidase multilayer modified microcantilevers for glucose measurement. Anal. Chem. 2005;77:6197–6204. doi: 10.1021/ac050801q. [DOI] [PubMed] [Google Scholar]
- 15.126.Yan XD, Shi XL, Hill K, Ji HF. Microcantilevers modified by horseradish peroxidase intercalated nano-assembly for hydrogen peroxide detection. Anal. Sci. 2006;22:205–208. doi: 10.2116/analsci.22.205. [DOI] [PubMed] [Google Scholar]
- 15.127.Hansen KM, Ji HF, Wu GH, Datar R, Cote R, Majumdar A, Thundat T. Cantilever-based optical deflection assay for discrimination of DNA single-nucleotide mismatches. Anal. Chem. 2001;73:1567–1571. doi: 10.1021/ac0012748. [DOI] [PubMed] [Google Scholar]
- 15.128.Hagan MF, Majumdar A, Chakraborty AK. Nanomechanical forces generated by surface grafted DNA. J. Phys. Chem. B. 2002;106:10163–10173. [Google Scholar]
- 15.129.Marie R, Jensenius H, Thaysen J, Christensen CB, Boisen A. Adsorption kinetics and mechanical properties of thiol-modified DNA-oligos on gold investigated by microcantilever sensors. Ultramicroscopy. 2002;91:29–36. doi: 10.1016/s0304-3991(02)00079-7. [DOI] [PubMed] [Google Scholar]
- 15.130.Stevenson KA, Mehta A, Sachenko P, Hansen KM, Thundat T. Nanomechanical effect of enzymatic manipulation of DNA on microcantilever surfaces. Langmuir. 2002;18:8732–8736. [Google Scholar]
- 15.131.Su M, Li SU, Dravid VP. Microcantilever resonance-based DNA detection with nanoparticle probes. Appl. Phys. Lett. 2003;82:3562–3564. [Google Scholar]
- 15.132.Alvarez M, Carrascosa LG, Moreno M, Calle A, Zaballos A, Lechuga LM, Martinez C, Tamayo J. Nanomechanics of the formation of DNA self-assembled monolayers and hybridization on microcantilevers. Langmuir. 2004;20:9663–9668. doi: 10.1021/la0489559. [DOI] [PubMed] [Google Scholar]
- 15.133.Gunter RL, Zhine R, Delinger WG, Manygoats K, Kooser A, Porter TL. Investigation of DNA sensing using piezoresistive microcantilever probes. IEEE Sens. J. 2004;4:430–433. [Google Scholar]
- 15.134.Alvarez M, Tamayo J. Optical sequential readout of microcantilever arrays for biological detection. Sens. Act. B Chem. 2005;106:687–690. [Google Scholar]
- 15.135.Calleja M, Nordstrom M, Alvarez M, Tamayo J, Lechuga LM, Boisen A. Highly sensitive polymer-based cantilever-sensors for DNA detection. Ultramicroscopy. 2005;105:215–222. doi: 10.1016/j.ultramic.2005.06.039. [DOI] [PubMed] [Google Scholar]
- 15.136.Mukhopadhyay R, Lorentzen M, Kjems J, Besenbacher F. Nanomechanical sensing of DNA sequences using piezoresistive cantilevers. Langmuir. 2005;21:8400–8408. doi: 10.1021/la0511687. [DOI] [PubMed] [Google Scholar]
- 15.137.Lechuga LM, Tamayo J, Alvarez M, Carrascosa LG, Yufera A, Doldan R, Peralias E, Rueda A, Plaza JA, Zinoviev K, Dominguez C, Zaballos A, Moreno M, Martinez C, Wenn D, Harris N, Bringer C, Bardinal V, Camps T, Vergnenegre C, Fontaine C, Diaz V, Bernad A. A highly sensitive microsystem based on nanomechanical biosensors for genomics applications. Sens. Act. B Chem. 2006;118:2–10. [Google Scholar]
- 15.138.Biswal SL, Raorane D, Chaiken A, Birecki H, Majumdar A. Nanomechanical detection of DNA melting on microcantilever surfaces. Anal. Chem. 2006;78:7104–7109. doi: 10.1021/ac052171y. [DOI] [PubMed] [Google Scholar]
- 15.139.Stachowiak JC, Yue M, Castelino K, Chakraborty A, Majumdar A. Chemomechanics of surface stresses induced by DNA hybridization. Langmuir. 2006;22:263–268. doi: 10.1021/la0521645. [DOI] [PubMed] [Google Scholar]
- 15.140.Huber F, Hegner M, Gerber C, Guntherodt HJ, Lang HP. Label free analysis of transcription factors using microcantilever arrays. Biosens. Bioelectron. 2006;21:1599–1605. doi: 10.1016/j.bios.2005.07.018. [DOI] [PubMed] [Google Scholar]
- 15.141.Biswal SL, Raorane D, Chaiken A, Majumdar A. Using a microcantilever array for detecting phase transitions and stability of DNA. Clin. Lab. Med. 2007;27:163–163. doi: 10.1016/j.cll.2006.12.005. [DOI] [PubMed] [Google Scholar]
- 15.142.Zhang J, Lang HP, Huber F, Bietsch A, Grange W, Certa U, McKendry R, Guentherodt H-J, Hegner M, Gerber C. Rapid and label-free nanomechanical detection of biomarker transcripts in human RNA. Nat. Nanotechnol. 2006;1:214–220. doi: 10.1038/nnano.2006.134. [DOI] [PubMed] [Google Scholar]
- 15.143.Moulin AM, O’Shea SJ, Welland ME. Microcantilever-based biosensors. Ultramicroscopy. 2000;82:23–31. doi: 10.1016/s0304-3991(99)00145-x. [DOI] [PubMed] [Google Scholar]
- 15.144.Grogan C, Raiteri R, O’Connor GM, Glynn TJ, Cunningham V, Kane M, Charlton M, Leech D. Characterisation of an antibody coated microcantilever as a potential immuno-based biosensor. Biosens. Bioelectron. 2002;17:201–207. doi: 10.1016/s0956-5663(01)00276-7. [DOI] [PubMed] [Google Scholar]
- 15.145.Kooser A, Manygoats K, Eastman MP, Porter TL. Investigation of the antigen antibody reaction between anti-bovine serum albumin (a-BSA) and bovine serum albumin (BSA) using piezoresistive microcantilever based sensors. Biosens. Bioelectron. 2003;19:503–508. doi: 10.1016/s0956-5663(03)00221-5. [DOI] [PubMed] [Google Scholar]
- 15.146.Savran CA, Knudsen SM, Ellington AD, Manalis SR. Micromechanical detection of proteins using aptamer-based receptor molecules. Anal. Chem. 2004;76:3194–3198. doi: 10.1021/ac049859f. [DOI] [PubMed] [Google Scholar]
- 15.147.Lee JH, Yoon KH, Hwang KS, Park J, Ahn S, Kim TS. Label free novel electrical detection using micromachined PZT monolithic thin film cantilever for the detection of C-reactive protein. Biosens. Bioelectron. 2004;20:269–275. doi: 10.1016/j.bios.2004.01.024. [DOI] [PubMed] [Google Scholar]
- 15.148.Zhang YF, Venkatachalan SP, Xu H, Xu XH, Joshi P, Ji HF, Schulte M. Micromechanical measurement of membrane receptor binding for label-free drug discovery. Biosens. Bioelectron. 2004;19:1473–1478. doi: 10.1016/j.bios.2003.12.011. [DOI] [PubMed] [Google Scholar]
- 15.149.Backmann N, Zahnd C, Huber F, Bietsch A, Pluckthun A, Lang HP, Güntherodt HJ, Hegner M, Gerber C. A label-free immunosensor array using single-chain antibody fragments. Proc. Natl. Acad. Sci. USA. 2005;102:14587–14592. doi: 10.1073/pnas.0504917102. [DOI] [PMC free article] [PubMed] [Google Scholar]
- 15.150.Wee KW, Kang GY, Park J, Kang JY, Yoon DS, Park JH, Kim TS. Novel electrical detection of label-free disease marker proteins using piezoresistive self-sensing micro-cantilevers. Biosens. Bioelectron. 2005;20:1932–1938. doi: 10.1016/j.bios.2004.09.023. [DOI] [PubMed] [Google Scholar]
- 15.151.Mukhopadhyay R, Sumbayev VV, Lorentzen M, Kjems J, Andreasen PA, Besenbacher F. Cantilever sensor for nanomechanical detection of specific protein conformations. Nano Lett. 2005;5:2385–2388. doi: 10.1021/nl051449z. [DOI] [PubMed] [Google Scholar]
- 15.152.Yan X, Hill K, Gao H, Ji HF. Surface stress changes induced by the conformational change of proteins. Langmuir. 2006;22:11241–11244. doi: 10.1021/la0605337. [DOI] [PubMed] [Google Scholar]
- 15.153.Kwon HS, Han KC, Hwang KS, Lee JH, Kim TS, Yoon DS, Yang EG. Development of a peptide inhibitor-based cantilever sensor assay for cyclic adenosine monophosphate-dependent protein kinase. Anal. Chim. Acta. 2007;585:344–349. doi: 10.1016/j.aca.2006.12.037. [DOI] [PubMed] [Google Scholar]
- 15.154.Shu W, Laue ED, Seshia AA. Investigation of biotin-streptavidin binding interactions using microcantilever sensors. Biosens. Bioelectron. 2007;22:2003–2009. doi: 10.1016/j.bios.2006.08.047. [DOI] [PubMed] [Google Scholar]
- 15.155.Dauksaite V, Lorentzen M, Besenbacher F, Kjems J. Antibody-based protein detection using piezoresistive cantilever arrays. Nanotechnology. 2007;18:125503. [Google Scholar]
- 15.156.Yue M, Stachowiak JC, Lin H, Datar R, Cote R, Majumdar A. Label-free protein recognition two-dimensional array using nanomechanical sensors. Nano Lett. 2008;8:520–524. doi: 10.1021/nl072740c. [DOI] [PubMed] [Google Scholar]
- 15.157.Braun T, Backmann N, Vogtli M, Bietsch A, Engel A, Lang HP, Gerber C, Hegner M. Conformational change of bacteriorhodopsin quantitatively monitored by microcantilever sensors. Biophys. J. 2006;90:2970–2977. doi: 10.1529/biophysj.105.072934. [DOI] [PMC free article] [PubMed] [Google Scholar]
- 15.158.Kim BH, Mader O, Weimar U, Brock R, Kern DP. Detection of antibody peptide interaction using microcantilevers as surface stress sensors. J. Vac. Sci. Technol. B. 2003;21:1472–1475. [Google Scholar]
- 15.159.Pera I, Fritz J. Sensing lipid bilayer formation and expansion with a microfabricated cantilever array. Langmuir. 2007;23:1543–1547. doi: 10.1021/la0624337. [DOI] [PubMed] [Google Scholar]
- 15.160.Hyun SJ, Kim HS, Kim YJ, Jung HI. Mechanical detection of liposomes using piezoresistive cantilever. Sens. Act. B Chem. 2006;117:415–419. [Google Scholar]
- 15.161.Ilic B, Czaplewski D, Zalalutdinov M, Craighead HG, Neuzil P, Campagnolo C, Batt C. Single cell detection with micromechanical oscillators. J. Vac. Sci. Technol. B. 2001;19:2825–2828. [Google Scholar]
- 15.162.Park J, Ryu J, Choi SK, Seo E, Cha JM, Ryu S, Kim J, Kim B, Lee SH. Real-time measurement of the contractile forces of self-organized cardiomyocytes on hybrid biopolymer microcantilevers. Anal. Chem. 2005;77:6571–6580. doi: 10.1021/ac0507800. [DOI] [PubMed] [Google Scholar]
- 15.163.Ghatnekar-Nilsson S, Lindahl J, Dahlin A, Stjernholm T, Jeppesen S, Hook F, Montelius L. Phospholipid vesicle adsorption measured in situ with resonating cantilevers in a liquid cell. Nanotechnology. 2005;16:1512–1516. [Google Scholar]
- 15.164.Nugaeva N, Gfeller KY, Backmann N, Lang HP, Duggelin M, Hegner M. Micromechanical cantilever array sensors for selective fungal immobilization and fast growth detection. Biosens. Bioelectron. 2005;21:849–856. doi: 10.1016/j.bios.2005.02.004. [DOI] [PubMed] [Google Scholar]
- 15.165.Dhayal B, Henne WA, Doorneweerd DD, Reifenberger RG, Low PS. Detection of Bacillus subtilis spores using peptide-functionalized cantilever arrays. J. Am. Chem. Soc. 2006;128:3716–3721. doi: 10.1021/ja0570887. [DOI] [PubMed] [Google Scholar]
- 15.166.Wu G, Datar RH, Hansen KM, Thundat T, Cote RJ, Majumdar A. Bioassay of prostate-specific antigen (PSA) using microcantilevers. Nature Biotechnol. 2001;19:856–860. doi: 10.1038/nbt0901-856. [DOI] [PubMed] [Google Scholar]
- 15.167.Hwang KS, Lee JH, Park J, Yoon DS, Park JH, Kim TS. In-situ quantitative analysis of a prostate-specific antigen (PSA) using a nanomechanical PZT cantilever. Lab Chip. 2004;4:547–552. doi: 10.1039/b410905h. [DOI] [PubMed] [Google Scholar]
- 15.168.Lee JH, Hwang KS, Park J, Yoon KH, Yoon DS, Kim TS. Immunoassay of prostate-specific antigen (PSA) using resonant frequency shift of piezoelectric nanomechanical microcantilever. Biosens. Bioelectron. 2005;20:2157–2162. doi: 10.1016/j.bios.2004.09.024. [DOI] [PubMed] [Google Scholar]
- 15.169.Velanki S, Ji H-F. Detection of feline coronavirus using microcantilever sensors. Meas. Sci. Technol. 2006;17:2964–2968. doi: 10.1088/0957-0233/17/11/015. [DOI] [PMC free article] [PubMed] [Google Scholar]
- 15.170.Maraldo D, Garcia FU, Mutharasan R. Method for quantification of a prostate cancer biomarker in urine without sample preparation. Anal. Chem. 2007;79:7683–7690. doi: 10.1021/ac070895z. [DOI] [PubMed] [Google Scholar]
- 15.171.Shih WY, Li XP, Gu HM, Shih WH, Aksay IA. Simultaneous liquid viscosity and density determination with piezoelectric unimorph cantilevers. J. Appl. Phys. 2001;89:1497–1505. [Google Scholar]
- 15.172.Agoston A, Keplinger F, Jakoby B. Evaluation of a vibrating micromachined cantilever sensor for measuring the viscosity of complex organic liquids. Sens. Act. A Phys. 2005;123-24:82–86. [Google Scholar]
- 15.173.McLoughlin N, Lee SL, Hahner G. Simultaneous determination of density and viscosity of liquids based on resonance curves of uncalibrated microcantilevers. Appl. Phys. Lett. 2006;89:184106. [Google Scholar]
- 15.174.Sampath U, Heinrich SM, Josse F, Lochon F, Dufour I, Rebiere D. Study of viscoelastic effect on the frequency shift of microcantilever chemical sensors. IEEE T. Ultrason. Ferr. 2006;53:2166–2173. doi: 10.1109/tuffc.2006.156. [DOI] [PubMed] [Google Scholar]
- 15.175.Jana A, Raman A, Dhayal B, Tripp SL, Reifenberger RG. Microcantilever mechanics in flowing viscous fluids. Appl. Phys. Lett. 2007;90:114110. [Google Scholar]
- 15.176.Hennemeyer M, Burghardt S, Stark R. Cantilever micro-rheometer for the characterization of sugar solutions. Sensors. 2008;8:10–22. doi: 10.3390/s8010010. [DOI] [PMC free article] [PubMed] [Google Scholar]
- 15.177.Brown KB, Ma Y, Allegretto W, Lawson RPW, Vermeulen FE, Robinson AM. Microstructural pressure sensor based on an enhanced resonant mode hysteresis effect. J. Vac. Sci. Technol. B. 2001;19:1628–1632. [Google Scholar]
- 15.178.Brown KB, Allegretto W, Vermeulen FE, Robinson AM. Simple resonating microstructures for gas pressure measurement. J. Micromech. Microeng. 2002;12:204–210. [Google Scholar]
- 15.179.Su Y, Evans AGR, Brunnschweiler A, Ensell G. Characterization of a highly sensitive ultra-thin piezoresistive silicon cantilever probe and its application in gas flow velocity sensing. J. Micromech. Microeng. 2002;12:780–785. [Google Scholar]
- 15.180.Mertens J, Finot E, Thundat T, Fabre A, Nadal MH, Eyraud V, Bourillot E. Effects of temperature and pressure on microcantilever resonance response. Ultramicroscopy. 2003;97:119–126. doi: 10.1016/S0304-3991(03)00036-6. [DOI] [PubMed] [Google Scholar]
- 15.181.Mortet V, Petersen R, Haenen K, D’Olieslaeger M. Wide range pressure sensor based on a piezoelectric bimorph microcantilever. Appl. Phys. Lett. 2006;88:133511. [Google Scholar]
- 15.182.Sievilä P, Rytkönen VP, Hahtela O, Chekurov N, Kauppinen J, Tittonen I. Fabrication and characterization of an ultrasensitive acousto-optical cantilever. J. Micromech. Microeng. 2007;17:852–859. [Google Scholar]
- 15.183.Jong CA, Chin TS, Fang WL. Residual stress and thermal expansion behavior of TaOxNy films by the micro-cantilever method. Thin Solid Films. 2001;401:291–297. [Google Scholar]
- 15.184.Shen F, Lu P, O’Shea SJ, Lee KH, Ng TY. Thermal effects on coated resonant microcantilevers. Sens. Act. A Phys. 2001;95:17–23. [Google Scholar]
- 15.185.Datskos PG, Oden PI, Thundat T, Wachter EA, Warmack RJ, Hunter SR. Remote infrared radiation detection using piezoresistive microcantilevers. Appl. Phys. Lett. 1996;69:2986–2988. [Google Scholar]
- 15.186.Oden PI, Datskos PG, Thundat T, Warmack RJ. Uncooled thermal imaging using a piezoresistive microcantilever. Appl. Phys. Lett. 1996;69:3277–3279. [Google Scholar]
- 15.187.Wachter EA, Thundat T, Oden PI, Warmack RJ, Datskos PG, Sharp SL. Remote optical detection using microcantilevers. Rev. Sci. Instrum. 1996;67:3434–3439. [Google Scholar]
- 15.188.Datskos PG, Rajic S, Datskou I. Detection of infrared photons using the electronic stress in metal-semiconductor cantilever interfaces. Ultramicroscopy. 2000;82:49–56. doi: 10.1016/s0304-3991(99)00140-0. [DOI] [PubMed] [Google Scholar]
- 15.189.Li CB, Jiao BB, Shi SL, Chen DP, Ye TC, Zhang QC, Guo ZY, Dong FL, Miao ZY. A novel uncooled substrate-free optical-readable infrared detector: design, fabrication and performance. Meas. Sci. Technol. 2006;17:1981–1986. [Google Scholar]
- 15.190.Yu X, Yi Y, Ma S, Liu M, Liu X, Dong L, Zhao Y. Design and fabrication of a high sensitivity focal plane array for uncooled IR imaging. J. Micromech. Microeng. 2008;18:057001. [Google Scholar]
- 15.191.Jiao B, Li C, Chen D, Ye T, Ou Y, Dong L, Zhang Q. An Optical Readout Method Based Uncooled Infrared Imaging System. Int. J. Infrared Milli. Waves. 2008;29:261–271. [Google Scholar]
- 15.192.Cheste J, Eichler A, Moser J, Ceballos C, Rurali R, Bachtold A. A nanomechanical mass sesnor with yoctogram resolution. Nat. Nanotechnol. 2012;7:301–304. doi: 10.1038/nnano.2012.42. [DOI] [PubMed] [Google Scholar]
- 15.193.Nagai Y, Carbajal JD, White JH, Sladek R, Grutter P, Lennox RB. An electrochemically controlled microcantilever biosensor. Langmuir: ACS J. Surf. Colloids. 2013;29:9951–9957. doi: 10.1021/la400975b. [DOI] [PubMed] [Google Scholar]
- 15.194.Haag A-L, Nagai Y, Lennox RB, Grütter P. Characterization of a gold coated cantilever surface for biosensing applications. EPJ Tech. Instrum. 2015;2:1–12. doi: 10.1140/epjti/s40485-014-0011-5. [DOI] [PMC free article] [PubMed] [Google Scholar]
- 15.195.Mishra S, Ghosh S, Mukhopadhyay R. Ordered self-assembled Locked Nucleic Acid (LNA) structures on gold(111) surface with enhanced single base mismatch recognition capability. Langmuir. 2012;28:4325–4333. doi: 10.1021/la204026j. [DOI] [PubMed] [Google Scholar]
- 15.196.Mishra S, Ghosh S, Mukhopadhyay R. Regulating on-surface LNA probe density for the highest target recognition efficiency. Langmuir. 2014;30:10389–10397. doi: 10.1021/la502860g. [DOI] [PubMed] [Google Scholar]
- 15.197.Domínguez CM, Kosaka PM, Mokry G, Pini V, Malvar O, del Rey M, Ramos D, San Paulo Á, Tamayo J, Calleja M. Hydration induced stress on DNA monolayers grafted on microcantilevers. Langmuir. 2014;30:10962–10969. doi: 10.1021/la501865h. [DOI] [PubMed] [Google Scholar]
- 15.198.Ndieyira JW, Watari M, Barrera AD, Zhou D, Vögtli M, Batchelor M, Cooper MA, Strunz T, Horton MA, Abell C, Rayment T, Aeppli G, McKendry RA. Nanomechanical detection of antibiotic–mucopeptide binding in a model for superbug drug resistance. Nat. Nanotech. 2008;3:691–696. doi: 10.1038/nnano.2008.275. [DOI] [PubMed] [Google Scholar]
- 15.199.Ndieyira JW, Kappeler N, Logan S, Cooper MA, Abell C, McKendry RA, Aeppli G. Surface-stress sensors for rapid and ultrasensitive detection of active free drugs in human serum. Nat. Nanotech. 2014;9:225–232. doi: 10.1038/nnano.2014.33. [DOI] [PubMed] [Google Scholar]
- 15.200.Bache M, Bosco FG, Brogger AL, Frohling KB, Alstrom TS, Hwu ET, Chen CH, Eugen-Olsen J, Hwang IS, Boisen A. Nanomechanical recognition of prognostic biomarker suPAR with DVD-ROM optical technology. Nanotechnology. 2013;24:444011. doi: 10.1088/0957-4484/24/44/444011. [DOI] [PubMed] [Google Scholar]
- 15.201.Mishra R, Hegner M. Effect of non-specific species competition from total RNA on the static mode hybridization response of nanomechanical assays of oligonucleotides. Nanotechnology. 2014;25:225501. doi: 10.1088/0957-4484/25/22/225501. [DOI] [PubMed] [Google Scholar]
- 15.202.Huber F, Lang HP, Backmann N, Rimoldi D, Gerber C. Direct detection of a BRAF mutation in total RNA from melanoma cells using cantilever arrays. Nat. Nanotechnol. 2013;8:125–129. doi: 10.1038/nnano.2012.263. [DOI] [PubMed] [Google Scholar]
- 15.203.Huber F, Lang HP, Zhang JY, Rimoldi D, Gerber C. Nanosensors for cancer detection. Swiss Med. Wkly. 2015;145:w14092. doi: 10.4414/smw.2015.14092. [DOI] [PubMed] [Google Scholar]
- 15.204.Maloney N, Lukacs G, Jensen J, Hegner M. Nanomechanical sensors for single microbial cell growth monitoring. Nanoscale. 2014;6:8242–8249. doi: 10.1039/c4nr01610f. [DOI] [PubMed] [Google Scholar]
- 15.205.Maloney N, Lukacs G, Ball SL, Hegner M. Device for filamentous fungi growth monitoring using the multimodal frequency response of cantilevers. Rev. Sci. Instrum. 2014;85:015003. doi: 10.1063/1.4854655. [DOI] [PubMed] [Google Scholar]
- 15.206.Longo G, Alonso-Sarduy L, Marques Rio L, Bizzini A, Trampuz A, Notz J, Dietler G, Kasas S. Rapid detection of bacterial resistance to antibiotics using AFM cantilevers as nanomechanical sensors. Nat. Nanotech. 2013;8:522–526. doi: 10.1038/nnano.2013.120. [DOI] [PubMed] [Google Scholar]
- 15.207.Kasas S, Ruggeri FS, Benadiba C, Maillard C, Stupar P, Tournu H, Dietler G, Longo G. Detecting nanoscale vibrations as signature of life. Proc. Natl. Acad. Sci. (USA) PNAS. 2015;112:378–381. doi: 10.1073/pnas.1415348112. [DOI] [PMC free article] [PubMed] [Google Scholar]
- 15.208.Finot E, Rouger V, Markey L, Seigneuric R, Nadal MH, Thundat T. Visible photothermal deflection spectroscopy using microcantilevers. Sens. Act. B. 2012;169:222–228. [Google Scholar]
- 15.209.Ghoraishi MS, Hawk JE, Phani A, Khan MF, Thundat T. Clustering mechanism of ethanol-water mixtures investigated with photothermal microfluidic cantilever deflection spectroscopy. Sci. Rep. 2016;6:23966. doi: 10.1038/srep23966. [DOI] [PMC free article] [PubMed] [Google Scholar]
- 15.210.Pelton M, Chakraborty D, Malachosky E, Guyot-Sionnest P, Sader JE. Viscoelastic flows in simple liquids generated by vibrating nanostructures. Phys. Rev. Lett. 2013;111:244502. doi: 10.1103/PhysRevLett.111.244502. [DOI] [PubMed] [Google Scholar]
- 15.211.Burg TP, Manalis SR. Suspended microchannel resonators for biomolecular detection. Appl. Phys. Lett. 2003;83:2698–2700. [Google Scholar]
- 15.212.Dutta P, Tipple C, Lavrik N, Datskos P. Enantioselective sensors based on antibody-mediated nanomechanics. Anal. Chem. 2003;75:2342–2348. doi: 10.1021/ac034031z. [DOI] [PubMed] [Google Scholar]
- 15.213.Ji HF, Lu YQ, Du HW, Xu XH, Thundat T. Spiral springs and microspiral springs for chemical and biological sensing. Appl. Phys. Lett. 2006;88:063504. [Google Scholar]
- 15.214.Singh G, Rice P, Mahajan RL. Fabrication and mechanical characterization of a force sensor based on an individual carbon nanotube. Nanotechnology. 2007;18:475501. [Google Scholar]
- 15.215.Sakhaee-Pour A, Ahmadian MT, Vafai A. Applications of single-layered graphene sheets as mass sensors and atomistic dust detectors. Solid State Commun. 2008;145:168–172. [Google Scholar]
- 15.216.Song X, Oksanen M, Li J, Hakonen PJ, Sillanpää MA. Graphene optomechanics realized at microwave frequencies. Phys. Rev. Lett. 2014;113:027404. doi: 10.1103/PhysRevLett.113.027404. [DOI] [PubMed] [Google Scholar]
- 15.217.Dolleman RJ, Davidovikj D, Cartamil-Bueno SJ, van der Zant HS, Steeneken PG. Graphene squeeze-film pressure sensors. Nano Lett. 2016;16:568–571. doi: 10.1021/acs.nanolett.5b04251. [DOI] [PubMed] [Google Scholar]