Abstract
Objective
To determine whether serum neurofilament light chain (sNfL) levels are associated with recent MRI activity in patients with relapsing-remitting MS (RRMS).
Methods
This observational study included 163 patients (405 samples) with early RRMS from the Study of Early interferon-beta1a (IFN-β1a) Treatment (SET) cohort and 179 patients (664 samples) with more advanced RRMS from the Genome-Wide Association Study of Multiple Sclerosis (GeneMSA) cohort. Based on annual brain MRI, we assessed the ability of sNfL cutoffs to reflect the presence of combined unique active lesions, defined as new/enlarging lesion compared with MRI in the preceding year or contrast-enhancing lesion. The probability of active MRI lesions among patients with different sNfL levels was estimated with generalized estimating equations models.
Results
From the sNfL samples ≥90th percentile, 81.6% of the SET (OR = 3.4, 95% CI = 1.8-6.4) and 48.9% of the GeneMSA cohort samples (OR = 2.6, 95% CI = 1.7-3.9) was associated with radiological disease activity on MRI. The sNfL level between the 10th and 30th percentile was reflective of negligible MRI activity: 1.4% (SET) and 6.5% (GeneMSA) of patients developed ≥3 active lesions, 5.8% (SET) and 6.5% (GeneMSA) developed ≥2 active lesions, and 34.8% (SET) and 11.8% (GeneMSA) showed ≥1 active lesion on brain MRI. The sNfL level <10th percentile was associated with even lower MRI activity. Similar results were found in a subgroup of clinically stable patients.
Conclusions
Low sNfL levels (≤30th percentile) help identify patients with MS with very low probability of recent radiologic disease activity during the preceding year. This result suggests that in future, sNfL assessment may substitute the need for annual brain MRI monitoring in considerable number (23.1%–36.4%) of visits in clinically stable patients.
Standard clinical follow-up in patients with MS includes regular assessment for new neurologic signs and symptoms of MS. However, only a small proportion of CNS lesions, detected with MRI, are symptomatic.1,2 Thus, MRI is the most commonly used, sensitive surrogate of subclinical MS activity.3
Nevertheless, serial MRI follow-up has its limitations, including the unsolved challenges of accurate measurement of brain atrophy, the need for standardized MRI scanning protocols, cost, and the fact that MRI is frequently not covering the spinal cord in routine settings.4,5 These limitations, together with a continued need for an accessible measure of neurodegeneration, have stimulated a search for new sensitive biomarkers.
Neurofilaments (NfLs) are the most promising biomarker of neuroaxonal injury in MS.6–8 Increased concentration of the NfL light chain in the blood and the CSF are closely associated with relapse activity, worsening of disability, occurrence of active MRI lesions and predicts brain and spinal cord atrophy.9–14 NfL light chain has recently become more accessible, as reliable methods for quantification of NfL light chain levels in serum (sNfL) have emerged.10,13
However, its potential role as a new and easily accessible biomarker of subclinical disease activity has been less studied. In this context, the role of sNfL in substitution of monitoring for detection of subclinical disease activity in MRI in certain clinical scenarios is still to be established.
In this study, we investigated the capacity of sNfL assessment as a marker of radiologic disease activity, including the sensitivity and specificity of different sNfL cutoffs in identifying the presence or absence of combined unique active lesions on brain MRI during the preceding year. We performed this study in 2 observational cohorts of patients with relapsing-remitting MS (RRMS): a discovery cohort of patients from the Study of Early interferon-beta1a (IFN-β1a) Treatment (SET), and a validation cohort of patients from the Genome-Wide Association Study of Multiple Sclerosis (GeneMSA).
Methods
Study population
SET cohort
The SET was an investigator-initiated, prospective observational study that involved 8 centers (NCT01592474) in the Czech Republic.15–17 Enrollment started in October 2005 and was completed in July 2009.
In this cohort were included patients with complete sNfL and MRI data, age 18–55 years, enrollment within 4 months from the demyelinating event, Expanded Disability Status Scale (EDSS) score ≤3.5, at least 2 T2 hyperintense lesions on MRI performed before steroid treatment, and with ≥2 CSF-restricted oligoclonal bands at the screening visit.
SET patients were originally diagnosed with clinically isolated syndrome according to the McDonald 2005 criteria.18 Patients' diagnosis was reclassified to RRMS based on the 2017 McDonald criteria.19 All patients were treated with IV steroids following screening and subsequently started the treatment at baseline with 30 mg of IM IFN-β1a once a week (Avonex).
GeneMSA cohort
Patients were recruited in Basel as part of a prospective multicenter study initiated in 2003 (GeneMSA).9,20,21
In this cohort were included 179 patients with complete sNfL and MRI data, who were recruited at the Neurologic Clinic and Policlinic, University Hospital Basel (Switzerland) between June 2004 and October 2005.
The GeneMSA cohort consisted of patients with RRMS. A small proportion (4.5%) of the GeneMSA patients were originally diagnosed with clinically isolated syndrome according to the McDonald 2001 criteria.22 Diagnosis of these patients was reclassified to RRMS based on the 2017 McDonald criteria.19
Ethical statement
The SET protocol was approved by the Medical Ethics Committees of the General University Hospital in Prague and by the local ethical committees in the participating centers, and all patients gave their written informed consent. All patients from the GeneMSA cohort provided written informed consent, and the study was approved by the local ethics committee.
MRI acquisition and analysis
SET cohort
The SET protocol stipulates brain MRI scans at baseline and at 12, 24, and 36 months, using a standardized protocol performed on the single 1.5-Tesla scanner (Gyroscan, Philips). Axial brain acquisitions included fluid-attenuated inversion recovery, T1-weighted images (T1-WIs), and pre- and post-contrast T1 spin-echo images. Semiautomated subtraction image methodology was used to identify combined unique active lesions (active lesions later in the text), defined as current new contrast-enhancing lesions on T1-weighted scans and new or enlarging lesions on T2-weighted scans occurred during the preceding year. A new or enlarging lesion on T2-weighted images was defined as a rounded or oval lesion (≥3 mm of size) arising from an area previously considered as normal-appearing brain tissue and/or showing an identifiable increase in size from a previously stable-appearing lesion.17 Image analyses were performed at Buffalo Neuroimaging Analysis Center, United States.15,17
GeneMSA cohort
Brain MRI scans were performed on all patients at baseline and then yearly in a 1.5-Tesla scanner (Magnetom Avanto, Siemens) equipped with a 12-element head matrix coil. MRI scans were performed on a single scanner at baseline and then annually over 78 months (median). Axial brain acquisitions included a double-echo proton density/T2-weighted sequence, T1-WI (magnetization prepared rapid acquisition with gradient echo), and T1 pre- and post-contrast spin-echo images. Active brain MRI lesions were identified and marked by consensus reading on simultaneously viewed T2-weighted and proton density–weighted images. Qualitative analysis for the presence of gadolinium enhancement was performed on post-contrast T1-WI. Image analyses were performed in the Medical Image Analysis Centre in Basel, Switzerland.9 The details of the MRI acquisition and analysis are provided in supplementary appendix e-1, links.lww.com/NXI/A233.
Serum neurofilament light chain measurements
In the SET cohort, serum samples were collected at 12, 24, and 36 months from baseline on the same day as the MRI examination. In the GeneMSA cohort, serum samples were collected annually over 78 months (median) on the same day as the MRI examination. In both cohorts, the samples were stored at −80°C following standard procedures.23 sNfL levels were measured using a homebrew Single Molecule Array assay at the University Hospital Basel as described previously.13 Interassay coefficients of variation for 3 native serum samples were below 10% (i.e., 7.8%, 8.8%, and 5.5% for 7.0 pg/mL). The mean intra-assay coefficient of variation of duplicate determinations for concentration was 6.4%. One sample (of 405) showed an sNfL value below 1.3 pg/mL (i.e., the lower limit of quantification) and was excluded. Measurements were performed on coded samples by personnel blinded to clinical and MRI data.
Statistical analysis
All analyses were performed using the R statistical software (R-project.org) and SPSS 22.0 (IBM, Armonk, NY). Statistical analysis of the SET cohort data was performed in the CORe Unit (University of Melbourne) and of the GeneMSA cohort data in the Clinical Trial Unit (University of Basel). sNfL levels were grouped into different categories using age-specific percentiles derived from a normative data set of healthy controls. Supplementary table e-1, links.lww.com/NXI/A234, shows the relationship between sNfL levels and age-specific sNfL percentiles.13
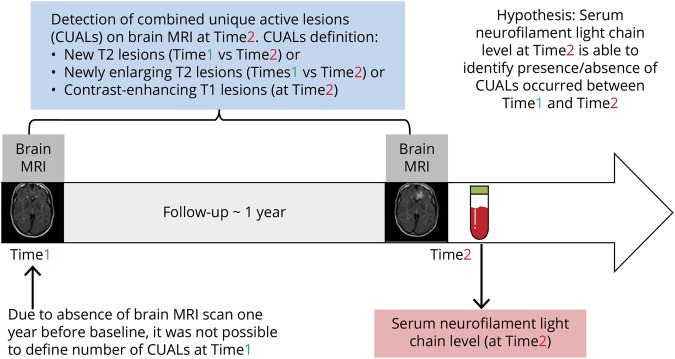
The sensitivity, specificity, and area under the receiver operating characteristic curve with their 95% CIs (DeLong method)24 of different predefined sNfL percentile cutoffs (sNfL deciles) for detection of ≥1, ≥2, or ≥3 active MRI lesions during the preceding year were assessed in the pooled analysis of all available data (figure 1). In other words, we investigated the capacity of sNfL at a given time point to identify the presence or absence of combined unique active lesions on brain MRI, defined as occurrence of current new contrast-enhancing T1 lesions, new or enlarging T2 lesions during the previous year. In addition to the pooled analysis of all available data, in the SET cohort we have separately evaluated the sensitivity and specificity of sNfL percentile cutoffs as a marker of MRI activity for each year of follow-up. Next, conditional probabilities of sNfL percentile ranges for detection of ≥1, ≥2, or ≥3 active MRI lesions were assessed in both cohorts.
Figure 1. Study design.
Finally, we estimated the probability of active MRI lesions among patients with different sNfL levels. sNfL percentile ranges with similar sensitivity and specificity were combined into 3 sNfL subgroups (>90th, 31th–90th, and <31th percentile). The presence of active MRI lesions was treated as a binary-dependent and sNfL percentile category as a binary-independent variable. ORs and 95% CIs were estimated with logistic generalized estimating equation models adjusted for age, sex, time point, disability status (only in the sensitivity analysis), number of relapses during the preceding year, and current treatment status (with therapies categorized as low efficacy [dimethyl fumarate, glatiramer acetate, and interferon-β]; high or moderately high efficacy [fingolimod, mitoxantrone, and natalizumab]; or no disease-modifying treatment [DMT]). The sNfL between the 31th and 90th percentile was chosen as the reference category.
The primary analyses were computed in the discovery cohort (SET) and validated in the validation cohort (GeneMSA). A sensitivity analysis was completed in a subgroup of clinically stable patients with no relapses or disability progression during the preceding year. The Benjamini-Hochberg procedure with p < 0.05 was used to control the false discovery rate.
Data availability
Anonymized data not published within this article will be made available by request from any qualified investigator.
Results
Baseline and follow-up clinical characteristics
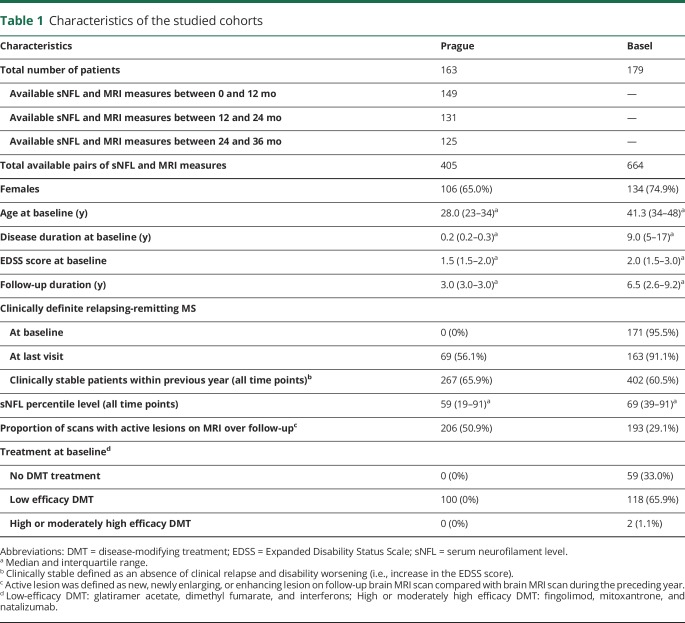
Table 1 describes demographic, clinical, and MRI characteristics of the patient cohorts at baseline and during the follow-up. Of the 220 patients with RRMS enrolled in the SET cohort, 163 had sNfL (405 samples) and MRI follow-up data available ≥1 time point between baseline and 36 months. Of the 259 patients enrolled in the GeneMSA cohort, 179 patients with RRMS had sNfL (664 samples) and MRI follow-up data available at baseline and minimum of 1 additional time point. In the SET cohort, 376 (92.8%) samples were assessed during IFN-β1a treatment. Of the 120 (67%) patients in the GeneMSA treated with DMT, the median time on the DMT at baseline was 44.4 months (interquartile range 18.5–66.4 months).
Table 1.
Characteristics of the studied cohorts
Sensitivity and specificity of sNfL for identification of brain MRI activity
SET cohort
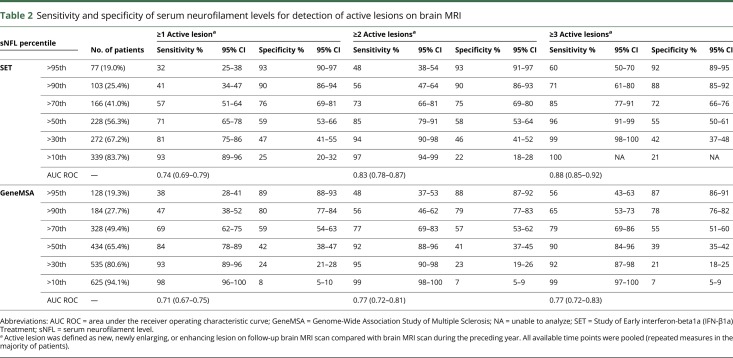
Higher levels of sNfL correlated with greater numbers of active brain MRI lesions (figure 2). sNfL greater than the 90th percentile was measured in 103 (25.4%) samples and identified patients with any active brain MRI lesions during the preceding year with 90% (95% CI = 86%–94%) specificity, patients with ≥2 active lesions with 90% (95% CI = 86%–93%) specificity, and patients with ≥3 active lesions with 88% (95% CI = 85%–92%) specificity. sNfL ≤30th percentile was observed in 133 (32.8%) samples and identified patients with active MRI lesions with 81% (95% CI = 75%–86%) sensitivity, patients with <2 active lesions with 94% (95% CI = 90%–98%) sensitivity, and patients with <3 active lesions with 99% (95% CI = 99%–100%) sensitivity (table 2). Separate analysis of time points did not show important differences (supplementary table e-2, links.lww.com/NXI/A234).
Figure 2. Proportion of brain MRI scans with 1, 2, or ≥3 active lesions by serum neurofilament percentile subgroups.
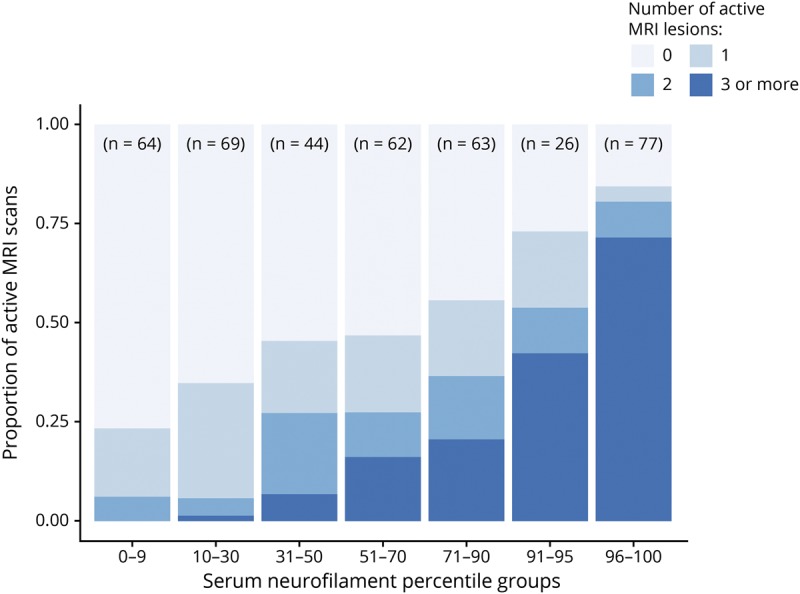
The SET cohort. SET = Study of Early interferon-beta1a (IFN-β1a) Treatment
Table 2.
Sensitivity and specificity of serum neurofilament levels for detection of active lesions on brain MRI
GeneMSA
Similar to the SET cohort, in the GeneMSA cohort, higher sNfL levels correlated with greater numbers of MRI lesions (figure 3). sNfL greater than the 90th percentile was found in 184 (27.7%) samples and identified patients with any active MRI lesions during the preceding year with 80% (95% CI = 77%–85%) specificity, patients with ≥2 active lesions with 79% (95% CI = 77%–83%) specificity, and patients with ≥3 active lesions with 78% (95% CI = 76%–83%) specificity. sNfL ≤30th percentile was observed in 129 (19.4%) of samples and identified patients with active MRI lesions with 93% (95% CI = 89%–96%) sensitivity, patients with <2 active lesions with 95% (95% CI = 91%–98%) sensitivity, and patients with <3 active lesions with 92% (95% CI = 87%–97%) sensitivity (table 2). Separate analysis of time points did not show important differences (supplementary table e-3, links.lww.com/NXI/A234).
Figure 3. Proportion of brain MRI scans with 1, 2, or ≥3 active lesions by serum neurofilament percentile subgroups.
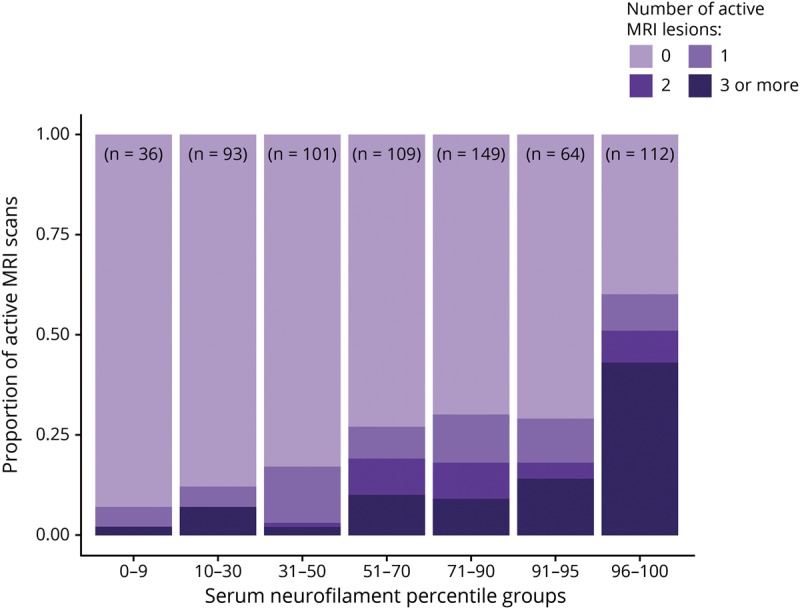
The GeneMSA cohort. GeneMSA = Genome-Wide Association Study of Multiple Sclerosis.
Although there was a trend for slightly lower specificity and higher sensitivity of sNfL levels in the GeneMSA cohort, 95% CIs, especially for sensitivity, overlapped considerably between the 2 cohorts (table 2).
sNfL as a marker of brain MRI activity at the individual level
SET cohort
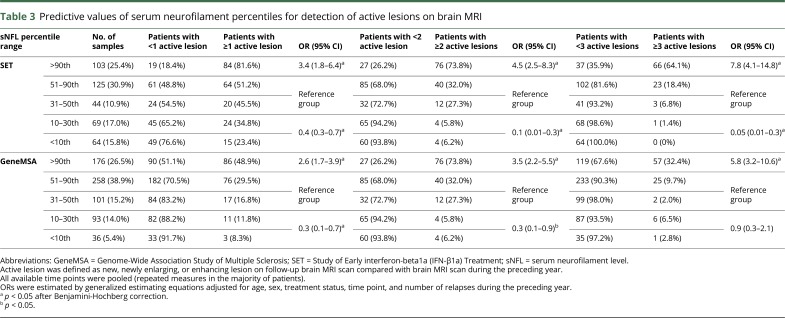
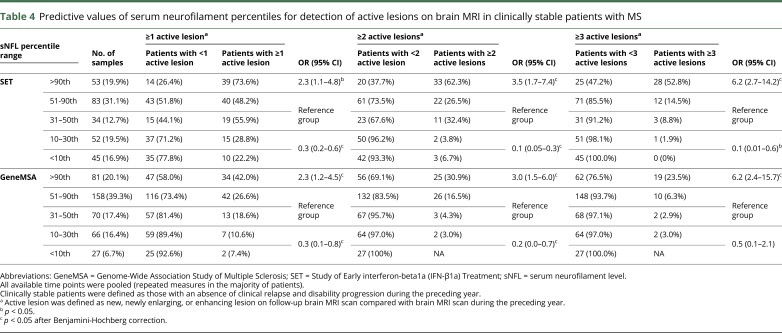
At the individual level, sNfL greater than the 90th percentile indicated a high probability of past MRI activity: 84 of 103 (81.6%) patients developed ≥1 active lesion, 76 (73.8%) developed ≥2 active lesions, and 66 (64.1%) developed ≥3 active lesions. In multivariable-adjusted analysis, sNfL above the 90th percentile was associated with a greater probability of having ≥3 active lesions compared with the 31–90th percentile (OR = 7.8; 95% CI = 4.1–14.8; p < 0.0001). Among the patients with sNfL between the 10th and 30th percentile, 24 (34.8%) developed ≥1 active lesion, 4 (5.8%) developed ≥2 active lesions, and only 1 (1.4%) developed ≥3 active lesions during the preceding year. Even lower radiologic disease activity was observed in patients with sNfL <10th percentile (table 3). In multivariable-adjusted analysis, sNfL ≤30th percentile was associated with a lower probability of having ≥3 active lesions compared with the 31–90th percentile (OR = 0.05; 95% CI = 0.01–0.3; p < 0.002). Similar results were observed in the sensitivity analysis of 267 (65.9%) samples from clinically stable patients (table 4).
Table 3.
Predictive values of serum neurofilament percentiles for detection of active lesions on brain MRI
Table 4.
Predictive values of serum neurofilament percentiles for detection of active lesions on brain MRI in clinically stable patients with MS
GeneMSA cohort
sNfL above the 90th percentile was reflective of higher MRI activity compared with lower sNfL levels. Eighty-six (48.9%) patients had developed ≥1 active lesion, 69 (39.2%) developed ≥2 active lesions, and 57 (32.4%) developed ≥3 active lesions. In multivariable-adjusted analysis, sNfL greater than the 90th percentile was associated with a greater probability of having ≥3 active lesions on MRI compared with the 31–90th percentile (OR = 5.8; 95% CI = 3.2–10.6; p < 0.01). Among the patients with sNfL between the 10th and 30th percentile, only 11 (11.8%) developed ≥1 active lesion, 6 (6.5%) developed ≥2 active lesions, and 6 (6.5%) developed ≥3 active lesions during the preceding year. Again, lower radiologic disease activity was observed in patients with sNfL <10th percentile, where: 3 (8.3%) developed ≥1 active lesion, 1 (2.8%) developed ≥2 active lesions, and 1 (2.8%) developed ≥3 active lesions during the preceding year (table 3). In multivariable-adjusted analysis, sNfL <31th percentile was associated with a lower probability of having ≥1 (OR = 0.3; 95% CI = 0.1–0.7; p < 0.01) and ≥2 (OR = 0.3; 95% CI = 0.1–0.9; p = 0.02) active lesions compared with the 31–90th percentile. The above observations were confirmed in the sensitivity analysis of 402 (60.5%) measures from clinically stable patients with no relapses or disability progression during the previous year (table 4). A sensitivity analysis in which all models were adjusted also for the EDSS score did not show considerable differences in the estimates (data not shown).
Discussion
In this longitudinal study of RRMS, high serum concentrations of NfL reflected increased recent radiologic disease activity defined as occurrence of combined unique new, enlarging, or contrast-enhancing lesions on brain MRI in the previous 12 months. On the contrary, low sNfL levels were associated with negligible MRI activity. Results of the study were validated in an independent MS cohort and in a subgroup of clinically stable patients.
Of the patients with activity during the previous 12 months detected by brain MRI, 41%–47% had sNfL levels exceeding the 90th percentile. At the individual level, sNfL greater than the 90th percentile was indicative of high MRI activity: 64.1% and 32.4% of patients developed ≥3 active lesions, 73.8% and 39.2% of patients developed ≥2 active lesions, and 81.6% and 48.9% of patients showed ≥1 active lesion on MRI in the SET and GeneMSA cohorts, respectively. However, a considerable proportion of patients showed high sNfL in the absence of any reported brain MRI activity (18.4% in the discovery cohort and 51.1% in the validation cohort). These instances could represent occasions when the amount of brain inflammatory activity was below the detection threshold of brain MRI (inflammation of normal-appearing white and gray matter),25,26 where inflammation was localized with in the spinal cord or where the source of sNfL was accelerated global brain tissue loss due to neurodegenerative processes. In both cohorts, sNfL greater than the 90th percentile was associated with approximately 3 times higher probability of having any active MRI lesion compared with the 31–90th percentile. Patients with sNfL >90th percentile had also approximately 4 times higher probability of having ≥2 and 6–8 times higher probability of having ≥3 active MRI lesions compared with the 31–90th percentile. Importantly, 90% (SET) and 80% (GeneMSA) of the patients with no detected MRI activity had sNfL lower than the 90th percentile.
Based on the observations summarized above, we interpret the findings of high sNfL (adjusted for age) as an indicator of a high likelihood of disease activity that should prompt further investigations with detailed imaging of the whole neuraxis.9 In these instances, MRI may help explain elevated sNfL, but may also add clinically relevant information with regard to the location and extent of lesion activity.27,28 Moreover, sNfL as a marker is not specific to MS lesion activity but may also reflect neuroaxonal damage due to other reasons.6 Last but not least, increased sNfL levels were associated with an increased risk of future disease activity.9,11–14 Therefore, patients with high sNfL levels without concurrent MRI or clinical evidence of disease activity should be followed closely to detect early indicators of treatment failure. Frequent screening for high (or increasing) sNfL levels may assist physicians with clinical decision making by providing information about high probability of recent, ongoing, and future subclinical disease activity.
It should be noted that a high sNfL level was strongly associated with brain MRI activity, but the sensitivity of the high sNfL levels for detection of MRI activity during the preceding year was expectedly lower. This suggests that MRI activity was reported also in instances with sNfL lower than the 90th percentile. This can be explained by the time course of sNfL levels following neuroaxonal injury. sNfL levels peak at 1 month and return to baseline at 6 months after neuroaxonal injury. Therefore, sNfL levels reflect only recent or ongoing MRI activity and are not sensitive to neuroaxonal injury occurring before more that 6–9 months.7,14,29
From the clinical perspective, a low sNfL level represented a very informative finding. sNfL ≤30th percentile was reflective of negligible MRI activity: approximately 0.8%–5.4% of the patients developed ≥3 active lesions, 5.4%–6.0% developed ≥2 active lesions, and 10.9%–29.3% showed ≥1 active lesion. In both cohorts, sNfL ≤30th percentile was associated with approximately 3 times lower probability of any recent MRI activity compared with the 31–90th percentile. The lower probability of lesion MRI activity in patients with sNfL ≤30th percentile levels was also observed for occurrence of ≥2 and ≥3 active MRI lesions, with the relative odds of a clinically significant brain MRI activity in the SET cohort being extremely low (20 times lower in the ≤30th percentile than the 31–90th percentile). In fact, 81% (SET) and 93% (GeneMSA) of the patients with any brain MRI activity had sNfL levels in excess of the 30th percentile, and 93% (SET) and 98% (GeneMSA) of the patients with any brain MRI activity had sNfL levels in excess of the 10th percentile.
Only a very few patients with sNfL ≤30th percentile showed clinically significant amount of MRI activity, defined as ≥3 (or even ≥2) active MRI lesions.30 In the cohort with clinically stable disease, the proportion of patients with low sNfL levels and MRI activity is even lower. We therefore suggest that assessment of sNfL may substitute the need for annual brain MRI monitoring in clinically stable patients with low sNfL levels (≤30th percentile). This constituted a considerable proportion of the MRI scans from patients with clinically stable disease included in this study: 36.4% in the SET and 23.1% in the GeneMSA cohort. However, one should remember that a small amount of MRI activity (1 active lesion) in the last year can be detected even in patients with such low sNfL levels. This could be mostly attributed to only transient increase of sNfL levels following neuroaxonal injury, which may not correlate with detected MRI activity, if lesion formation occurred more that 6–9 months ago.7,14,29
In general, the discovery (SET) cohort showed slightly lower sNfL levels but higher proportion of active MRI scans (51% vs 29%) than the validation (GeneMSA) cohort. In the GeneMSA cohort, we found a lower number of active MRI lesions, which is in agreement with previous research that showed decreasing incidence of MRI activity over disease course.25 Considering younger age and shorter disease duration of the SET cohort, a higher proportion of active MRI scans in the SET cohort is therefore not surprising.
The 2 studied MS cohorts used different scanning protocols and techniques for detection of active MRI lesions. The cohorts also differed slightly in terms of the disease burden, clinical and radiologic disease activity, and sNfL levels over follow-up. It is therefore reassuring that similar optimal cutoffs for sNfL were identified in the 2 cohorts. In the SET cohort, we observed a trend for marginally higher specificity and lower sensitivity of sNfL than in the GeneMSA cohort, which was consistent throughout the follow-up. The 95% CIs for sensitivity overlapped considerably between the 2 cohorts. One can speculate that these trends were secondary to the differences in disease burden, disease activity, DMT, or differences in MRI protocols. In the preliminary subanalysis of the GeneMSA cohort, we found a trend for slightly higher accuracy of sNfL marker of MRI activity in patients with younger age and short disease duration and lower accuracy of sNfL cutoffs in patients with older age and long disease duration. These trends remain to be investigated in further studies and larger cohorts.
The ability to detect active MRI lesions is influenced by a variety of technical, rater- and patient-related factors.31,32 Therefore, variability in the sensitivity of the scanning protocols was likely. We have mitigated the risk of reporting error for MRI activity by using also a more rigorous requirement of higher number of active MRI lesions as our study outcome. Moreover, 3-dimensional subtracted images after image registration, with thin-slice thickness, were analyzed by semiautomatic techniques (SET) or by experienced MRI raters (GeneMSA). These techniques detect considerably higher number of active lesions compared with imaging used in clinical practice.31,33 Therefore, in the context of clinical practice, sNfL levels may show a very good sensitivity even in detection of single active MRI lesion. This needs to be investigated in future studies.
Second, although the levels of sNfL were interpreted in the context of its gradual increase with age (through the use of normative reference data), we did not adjust for other potential confounders of sNfL. The differences in sNfL levels between the 2 studied cohort support that in MS, other disease-specific factors may codetermine sNfL. Among these, disease duration, time since disease activity, disability, differences in DMT, and comorbidities would be the likely candidates. Although the SET patients initiated DMT at baseline, potential effect of delayed treatment response resulting in decoupling between sNfL levels at 12 months and MRI activity during the preceding year was not observed. Also, we did not find an effect of disability on the relationship between sNfL levels and MRI activity. Another important question requiring better understanding is the dynamics of rising and decreasing sNfL levels following lesion formation and disease activity. Finally, a large normative database for sNfL in MS patients is needed.
NfL is a promising biomarker of neuroaxonal injury6–8 strongly associated with measures of disease activity in MS.9–14 Given that a considerable number of patients with high sNfL levels did not have detectable lesion activity on brain MRI, further studies are needed to clarify the origin of increased sNfL in patients with radiologically stable brain MRI. Based on the results of previous research, we hypothesize that active spinal cord lesions,9 accelerated loss of brain volume, or subclinical inflammation of normal-appearing white and gray matter may play a role.25,26 If this hypothesis is correct, sNfL may, in addition, qualify as a sensitive surrogate biomarker of inflammation and axonal loss.9
sNfL is a cumulative indicator of neuronal damage over weeks to months.7,14,29 Future studies are required to investigate the benefit of more frequent sNfL assessment (e.g., 6-monthly), which may represent a sensitive and accessible method for capturing subclinical disease activity in routine follow-up. Finally, assessment of the relationship between sNfL and MRI activity in different subgroups is needed to allow generalization of the results to the prevalent MS population.
This study, using discovery-validation design in 2 large MS centers, demonstrates that low levels of sNfL help identify patients with MS with no clinically relevant radiologic disease activity. In future, sNfL monitoring may potentially supplement the need for annual brain MRI monitoring in a proportion of patients with clinically stable MS and with low sNfL levels. Further research is required to understand whether high sNfL levels in the absence of new or enlarging brain lesions may signal subclinical disease activity in patients, who would otherwise be considered stable.
Acknowledgment
The authors thank the patients who participated in this study. They thank the other clinical centers and investigators who participated in the SET: (1) M. Vachova, S. Machalicka, and J. Kotalova from KZ a.s. Hospital, Teplice; (2) Y. Benesova, P. Praksova, and P. Stourac from University Hospital, Brno, Bohunice; (3) M. Dufek from St. Anne's University Hospital, Brno; (4) E. Meluzinova, J. Pikova, and E. Houzvickova from Charles University in Prague, 2nd Faculty of Medicine, Motol; (5) D. Zimova from Charles University in Prague, 3rd Faculty of Medicine, Kralovske Vinohrady; (6) J. Sucha from University Hospital, Plzeň; and (7) V. Sladkova and J. Mares from University Hospital, Olomouc.
Glossary
- DMT
disease-modifying treatment
- EDSS
Expanded Disability Status Scale
- GeneMSA
Genome-Wide Association Study of Multiple Sclerosis
- IFN-β1a
interferon-beta1a
- NfL
neurofilament
- RRMS
relapsing-remitting MS
- SET
Study of Early interferon-beta1a (IFN-β1a) Treatment
- sNfL
serum neurofilament light chain
- T1-WI
T1-weighted image
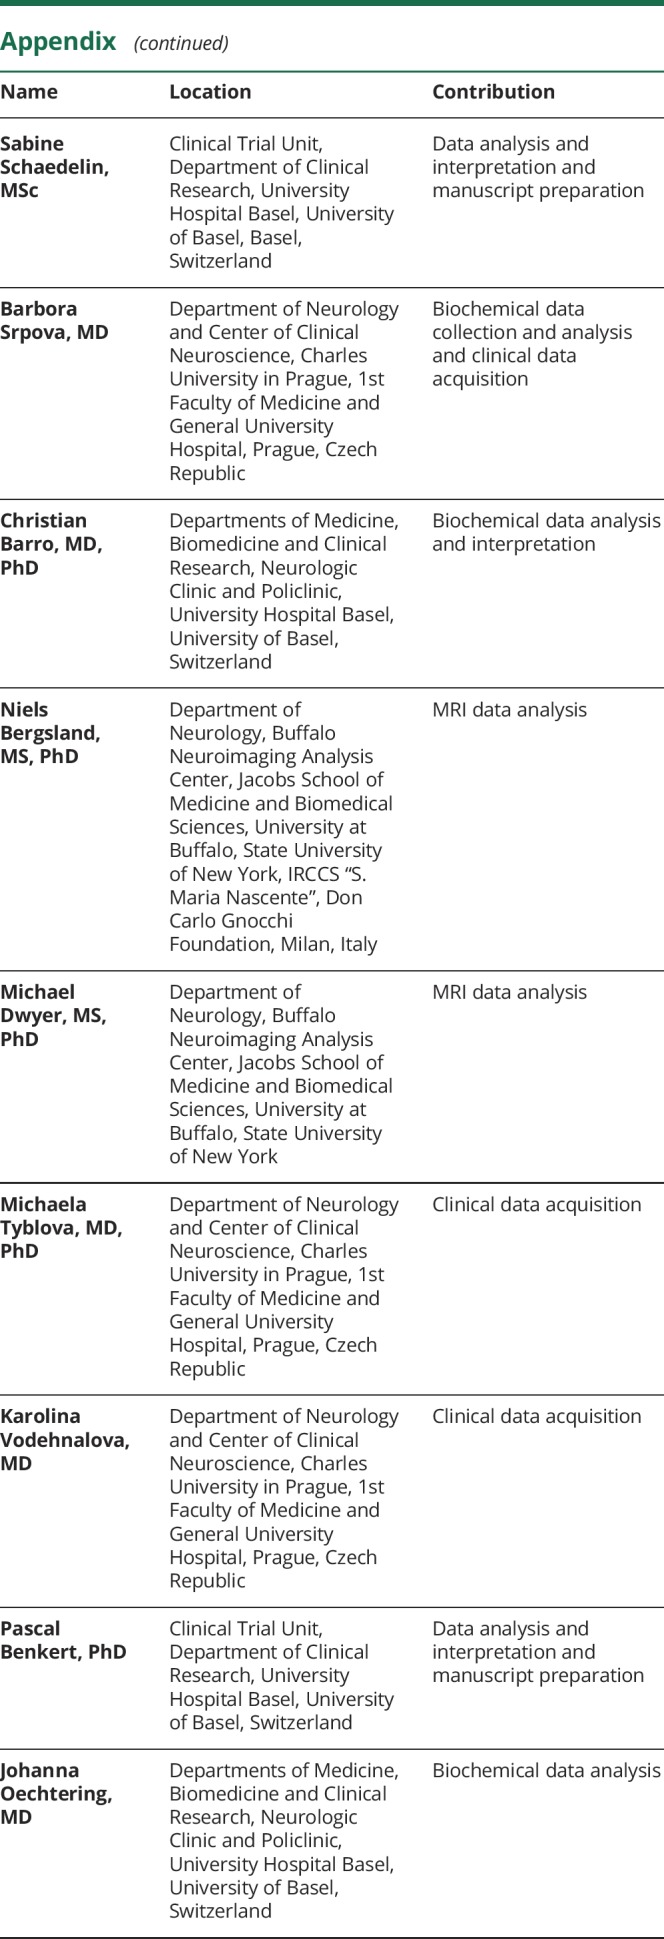
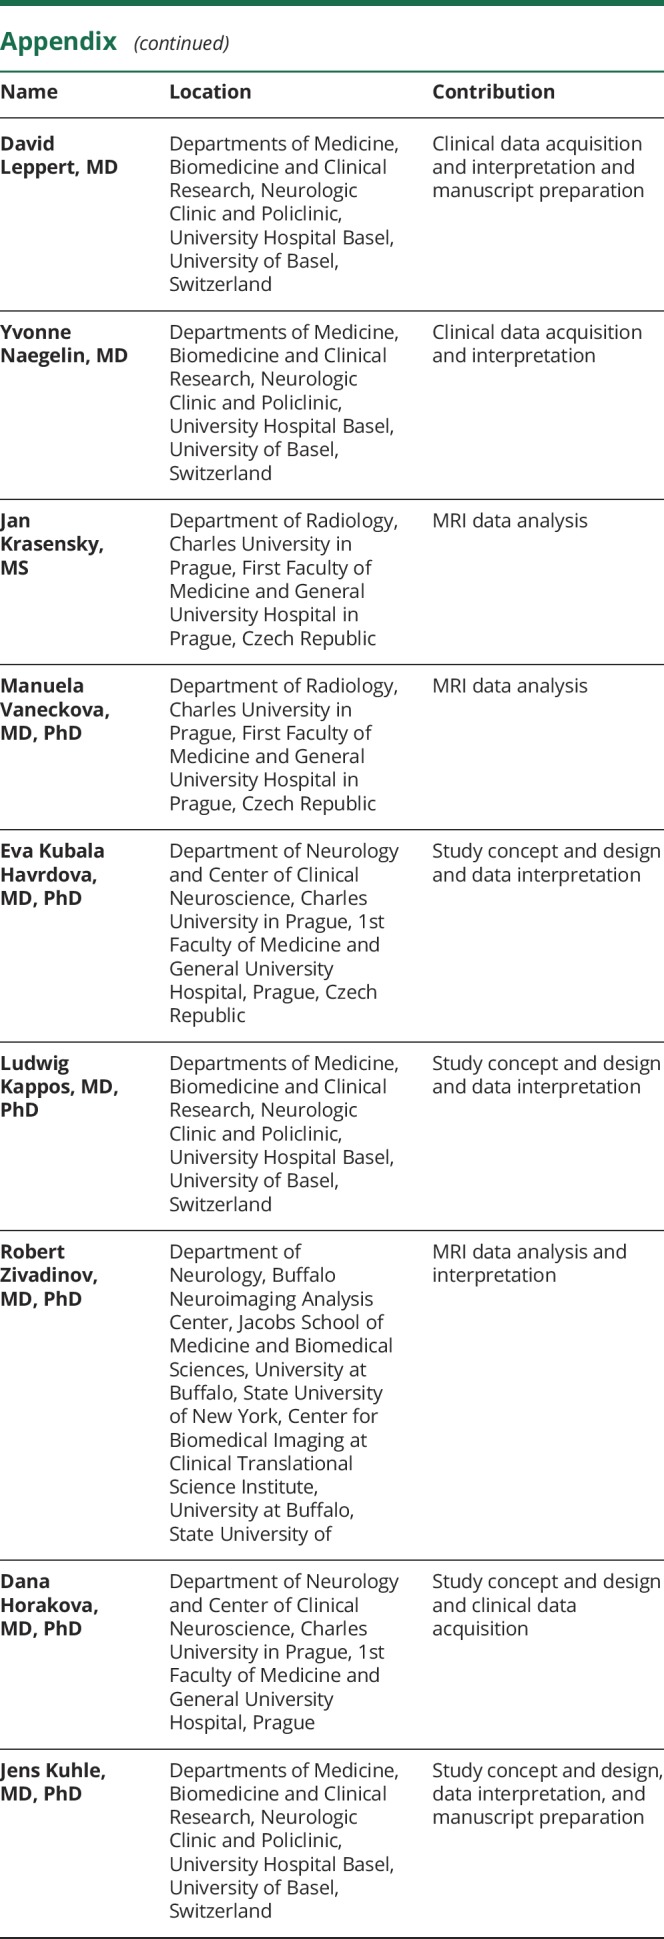
Appendix. Authors

Study funding
This study was funded by the Charles University Grant Agency (GAUK) 230217, Czech Ministry of Education project Progres Q27/LF1, Czech Ministry of Health project RVO-VFN64165, and AZV grants NV18-08-00062 and NV18-04-00168. The SET was supported by Biogen.
Disclosure
T. Uher received financial support for conference travel and honoraria from Biogen Idec, Novartis, Roche, Genzyme, and Merck Serono and support for research activities from Biogen Idec and Sanofi (GZ-2017-11718). S. Schaedelin reports no disclosures relevant to the manuscript. B. Srpova received compensation for traveling and conference fees from Novartis, Sanofi Genzyme, and Biogen. C. Barro received conference travel grant from Teva and Novartis. N. Bergsland reports no disclosures relevant to the manuscript. M. Dwyer received personal compensation from Claret Medical and EMD Serono and research grant support from Novartis. M. Tyblova received compensation for travel and honoraria from Biogen Idec, Sanofi, Teva, and Merck Serono. K. Vodehnalova received compensation for traveling and conference fees from Biogen, Novartis, and Merck. P. Benkert reports no disclosures relevant to the manuscript. J. Oechtering received travel grants from Biogen Idec, Novartis, and Bayer and served on an advisory board by Roche. D. Leppert was employee of Novartis (until January 2019) and received personal compensation for consulting and speaking and travel reimbursement from Quanterix, Orion, and Sanofi. Y. Naegelin: her employer, the University Hospital Basel received payments for lecturing from Celgene GmbH and Teva Pharma AG that were exclusively used for research support, not related to this study. J. Krasensky received financial support for research activities from Biogen Idec. M. Vaneckova received speaker honoraria and consultant fees from Biogen Idec, Novartis, Merck L. Serono, and Teva and support for research activities from Biogen Idec. E. Kubala Havrdova received speaker honoraria and consultant fees from Biogen Idec, Merck Serono, Novartis, Genzyme, Teva, Actelion, and Receptos and support for research activities from Biogen Idec and Merck Serono. L. Kappos: institution (University Hospital Basel) received and used exclusively for research support steering committee, advisory board, consultancy fees from Actelion, Addex, Bayer HealthCare, Biogen, Biotica, Genzyme, Lilly, Merck, Mitsubishi, Novartis, Ono Pharma, Pfizer, Receptos, Sanofi, Santhera, Siemens, Teva, and UCB; speaker fees from Bayer HealthCare, Biogen, Merck, Novartis, Sanofi, and Teva; support of educational activities from Bayer HealthCare, Biogen, CSL Behring, Genzyme, Merck, Novartis, Sanofi, and Teva; and grants from Bayer HealthCare, Biogen, F. Hoffmann-La Roche Ltd, Merck, Novartis, the European Union, the Roche Research Foundations, the Swiss Multiple Sclerosis Society, and the Swiss National Research Foundation. R. Zivadinov received personal compensation from EMD Serono, Genzyme-Sanofi, Claret Medical, Celgene, and Novartis for speaking and consultant fees. He received financial support for research activities from Teva Pharmaceuticals, Biogen Idec, Genzyme-Sanofi, Novartis, Claret Medical, Intekrin, and IMS Health. R. Zivadinov serves on editorial boards of J Alzh Dis, BMC Med, BMC Neurol, Vein and Lymphatics, and Clinical CNS Drugs. D. Horakova received compensation for travel, speaker honoraria, and consultant fees from Biogen Idec, Novartis, Merck Serono, Bayer Schering, and Teva and support for research activities from Biogen Idec. J. Kuhle received speaker fees, research support, travel support, and/or served on advisory boards by ECTRIMS, Swiss MS Society, Swiss National Research Foundation (320030_160221), University of Basel, Bayer, Biogen, Genzyme, Merck, Novartis, Protagen AG, Roche, and Teva. T. Kalincik served on scientific advisory boards of Roche, Genzyme-Sanofi, Novartis, Merck, and Biogen and steering committee for Brain Atrophy Initiative by Genzyme; received conference travel support and/or speaker honoraria from WebMD Global, Novartis, Biogen, Genzyme-Sanofi, Teva, BioCSL, and Merck; and received research support from Biogen. Go to Neurology.org/NN for full disclosures.
References
- 1.Barkhof F, Scheltens P, Frequin ST, et al. Relapsing-remitting multiple sclerosis: sequential enhanced MR imaging vs clinical findings in determining disease activity. AJR Am J Roentgenol 1992;159:1041–1047. [DOI] [PubMed] [Google Scholar]
- 2.Zecca C, Disanto G, Sormani MP, et al. Relevance of asymptomatic spinal MRI lesions in patients with multiple sclerosis. Mult Scler 2016;22:782–791. [DOI] [PubMed] [Google Scholar]
- 3.Rovira A, Wattjes MP, Tintore M, et al. Evidence-based guidelines: MAGNIMS consensus guidelines on the use of MRI in multiple sclerosis-clinical implementation in the diagnostic process. Nat Rev Neurol 2015;11:471–482. [DOI] [PubMed] [Google Scholar]
- 4.Rocca MA, Battaglini M, Benedict RH, et al. Brain MRI atrophy quantification in MS: from methods to clinical application. Neurology 2017;88:403–413. [DOI] [PMC free article] [PubMed] [Google Scholar]
- 5.Zivadinov R, Jakimovski D, Gandhi S, et al. Clinical relevance of brain atrophy assessment in multiple sclerosis. Implications for its use in a clinical routine. Expert Rev Neurother 2016;16:777–793. [DOI] [PubMed] [Google Scholar]
- 6.Khalil M, Teunissen CE, Otto M, et al. Neurofilaments as biomarkers in neurological disorders. Nat Rev Neurol 2018;14:577–589. [DOI] [PubMed] [Google Scholar]
- 7.Lycke JN, Karlsson JE, Andersen O, Rosengren LE. Neurofilament protein in cerebrospinal fluid: a potential marker of activity in multiple sclerosis. J Neurol Neurosurg Psychiatry 1998;64:402–404. [DOI] [PMC free article] [PubMed] [Google Scholar]
- 8.Yabe JT, Chylinski T, Wang FS, et al. Neurofilaments consist of distinct populations that can be distinguished by C-terminal phosphorylation, bundling, and axonal transport rate in growing axonal neurites. J Neurosci 2001;21:2195–2205. [DOI] [PMC free article] [PubMed] [Google Scholar]
- 9.Barro C, Benkert P, Disanto G, et al. Serum neurofilament as a predictor of disease worsening and brain and spinal cord atrophy in multiple sclerosis. Brain 2018;141:2382–2391. [DOI] [PubMed] [Google Scholar]
- 10.Novakova L, Zetterberg H, Sundstrom P, et al. Monitoring disease activity in multiple sclerosis using serum neurofilament light protein. Neurology 2017;89:2230–2237. [DOI] [PMC free article] [PubMed] [Google Scholar]
- 11.Dalla Costa G, Martinelli V, Sangalli F, et al. Prognostic value of serum neurofilaments in patients with clinically isolated syndromes. Neurology 2019;92:e733–e741. [DOI] [PMC free article] [PubMed] [Google Scholar]
- 12.Sellebjerg F, Royen L, Soelberg Sorensen P, Oturai AB, Jensen PEH. Prognostic value of cerebrospinal fluid neurofilament light chain and chitinase-3-like-1 in newly diagnosed patients with multiple sclerosis. Mult Scler 2019;1444–1451. [DOI] [PubMed] [Google Scholar]
- 13.Disanto G, Barro C, Benkert P, et al. Serum neurofilament light: a biomarker of neuronal damage in multiple sclerosis. Ann Neurol 2017;81:857–870. [DOI] [PMC free article] [PubMed] [Google Scholar]
- 14.Kuhle J, Kropshofer H, Haering DA, et al. Blood neurofilament light chain as a biomarker of MS disease activity and treatment response. Neurology 2019;92:e1007–e1015. [DOI] [PMC free article] [PubMed] [Google Scholar]
- 15.Kalincik T, Vaneckova M, Tyblova M, et al. Volumetric MRI markers and predictors of disease activity in early multiple sclerosis: a longitudinal cohort study. PLoS One 2012;7:e50101. [DOI] [PMC free article] [PubMed] [Google Scholar]
- 16.Uher T, Horakova D, Kalincik T, et al. Early magnetic resonance imaging predictors of clinical progression after 48 months in clinically isolated syndrome patients treated with intramuscular interferon beta-1a. Eur J Neurol 2015;22:1113–1123. [DOI] [PubMed] [Google Scholar]
- 17.Zivadinov R, Havrdova E, Bergsland N, et al. Thalamic atrophy is associated with development of clinically definite multiple sclerosis. Radiology 2013;268:831–841. [DOI] [PubMed] [Google Scholar]
- 18.Polman CH, Reingold SC, Edan G, et al. Diagnostic criteria for multiple sclerosis: 2005 revisions to the “McDonald Criteria”. Ann Neurol 2005;58:840–846. [DOI] [PubMed] [Google Scholar]
- 19.Thompson AJ, Banwell BL, Barkhof F, et al. Diagnosis of multiple sclerosis: 2017 revisions of the McDonald criteria. Lancet Neurol 2018;17:162–173. [DOI] [PubMed] [Google Scholar]
- 20.Baranzini SE, Wang J, Gibson RA, et al. Genome-wide association analysis of susceptibility and clinical phenotype in multiple sclerosis. Hum Mol Genet 2009;18:767–778. [DOI] [PMC free article] [PubMed] [Google Scholar]
- 21.Bove R, Chitnis T, Cree BA, et al. SUMMIT (Serially Unified Multicenter Multiple Sclerosis Investigation): creating a repository of deeply phenotyped contemporary multiple sclerosis cohorts. Mult Scler 2018;24:1485–1498. [DOI] [PMC free article] [PubMed] [Google Scholar]
- 22.McDonald WI, Compston A, Edan G, et al. Recommended diagnostic criteria for multiple sclerosis: guidelines from the International Panel on the diagnosis of multiple sclerosis. Ann Neurol 2001;50:121–127. [DOI] [PubMed] [Google Scholar]
- 23.Teunissen CE, Petzold A, Bennett JL, et al. A consensus protocol for the standardization of cerebrospinal fluid collection and biobanking. Neurology 2009;73:1914–1922. [DOI] [PMC free article] [PubMed] [Google Scholar]
- 24.DeLong ER, DeLong DM, Clarke-Pearson DL. Comparing the areas under two or more correlated receiver operating characteristic curves: a nonparametric approach. Biometrics 1988;44:837–845. [PubMed] [Google Scholar]
- 25.Frischer JM, Weigand SD, Guo Y, et al. Clinical and pathological insights into the dynamic nature of the white matter multiple sclerosis plaque. Ann Neurol 2015;78:710–721. [DOI] [PMC free article] [PubMed] [Google Scholar]
- 26.Moll NM, Rietsch AM, Thomas S, et al. Multiple sclerosis normal-appearing white matter: pathology-imaging correlations. Ann Neurol 2011;70:764–773. [DOI] [PMC free article] [PubMed] [Google Scholar]
- 27.Krieger SC, Cook K, De Nino S, Fletcher M. The topographical model of multiple sclerosis: a dynamic visualization of disease course. Neurol Neuroimmunol Neuroinflamm 2016;3:e279 doi: 10.1212/NXI.0000000000000279. [DOI] [PMC free article] [PubMed] [Google Scholar]
- 28.Galassi S, Prosperini L, Logoteta A, et al. A lesion topography-based approach to predict the outcomes of patients with multiple sclerosis treated with Interferon Beta. Mult Scler Relat Disord 2016;8:99–106. [DOI] [PubMed] [Google Scholar]
- 29.Bergman J, Dring A, Zetterberg H, et al. Neurofilament light in CSF and serum is a sensitive marker for axonal white matter injury in MS. Neurol Neuroimmunol Neuroinflamm 2016;3:e271. doi: 10.1212/NXI.0000000000000271. [DOI] [PMC free article] [PubMed] [Google Scholar]
- 30.Sormani MP, Gasperini C, Romeo M, et al. Assessing response to interferon-beta in a multicenter dataset of patients with MS. Neurology 2016;87:134–140. [DOI] [PubMed] [Google Scholar]
- 31.Moraal B, Wattjes MP, Geurts JJ, et al. Improved detection of active multiple sclerosis lesions: 3D subtraction imaging. Radiology 2010;255:154–163. [DOI] [PubMed] [Google Scholar]
- 32.Erbayat Altay E, Fisher E, Jones SE, Hara-Cleaver C, Lee JC, Rudick RA. Reliability of classifying multiple sclerosis disease activity using magnetic resonance imaging in a multiple sclerosis clinic. JAMA Neurol 2013;70:338–344. [DOI] [PMC free article] [PubMed] [Google Scholar]
- 33.Tan IL, van Schijndel RA, Fazekas F, et al. Improved interobserver agreement for visual detection of active T2 lesions on serial MR scans in multiple sclerosis using image registration. J Neurol 2001;248:789–794. [DOI] [PubMed] [Google Scholar]
Associated Data
This section collects any data citations, data availability statements, or supplementary materials included in this article.
Data Availability Statement
Anonymized data not published within this article will be made available by request from any qualified investigator.


