Abstract
Objective
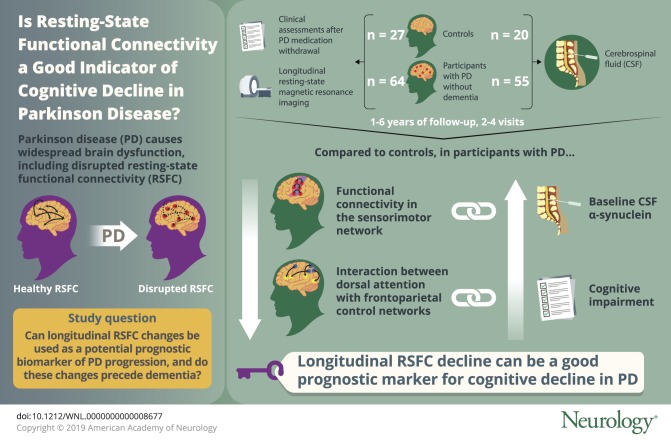
To evaluate resting-state functional connectivity as a potential prognostic biomarker of Parkinson disease (PD) progression. The study examined longitudinal changes in cortical resting-state functional connectivity networks in participants with PD compared to controls as well as in relation to baseline protein measures and longitudinal clinical progression.
Methods
Individuals with PD without dementia (n = 64) and control participants (n = 27) completed longitudinal resting-state MRI scans and clinical assessments including full neuropsychological testing after overnight withdrawal of PD medications (“off”). A total of 55 participants with PD and 20 control participants also completed baseline β-amyloid PET scans and lumbar punctures for CSF protein levels of α-synuclein, β-amyloid, and tau. Longitudinal analyses were conducted with multilevel growth curve modeling, a type of mixed-effects model.
Results
Functional connectivity within the sensorimotor network and the interaction between the dorsal attention network with the frontoparietal control network decreased significantly over time in participants with PD compared to controls. Baseline CSF α-synuclein protein levels predicted decline in the sensorimotor network. The longitudinal decline in the dorsal attention–frontoparietal internetwork strength correlated with the decline in cognitive function.
Conclusions
These results indicate that α-synuclein levels may influence longitudinal declines in motor-related functional connectivity networks. Further, the interaction between cortical association networks declines over time in PD prior to dementia onset and may serve as a prognostic marker for the development of dementia.
Formation of midbrain Lewy bodies, containing aggregated α-synuclein, results in dopaminergic cell loss and motor deficits in Parkinson disease (PD), whereas cortical Lewy bodies likely contribute to dementia.1,2 β-amyloid (Aβ) accumulation,3,4 as well as serotonergic, norepinephrine, and cholinergic system deficits,5–7 also may occur with PD. This heterogeneous neuropathophysiology causes widespread brain dysfunction and a variety of clinical manifestations, including dementia in up to 80% of PD cases.8 Prognostic biomarkers reflecting the underlying pathophysiology and clinical progression are greatly needed.
Resting-state functional connectivity (RSFC) MRI may provide the link between neuropathophysiology and behavioral dysfunction. Both whole-brain and sensorimotor network (SMN) RSFC relate to CSF α-synuclein,9,10 providing direct evidence that PD neuropathology disrupts RSFC. Moreover, altered striatal and cortical motor RSFC correlates with motor severity11,12 and disruption of dorsal attention and frontoparietal networks relates to cognitive dysfunction in PD.13 However, only one study currently reports longitudinal whole-brain RSFC declines in PD associated with cognitive decline and dementia.14 Thus, longitudinal changes in specific RSFC networks, the role of proteinopathy in longitudinal RSFC changes, and whether RSFC changes precede dementia onset remain to be determined.
Therefore, we investigated longitudinal RSFC network changes in participants with PD without dementia and control participants, in relation to baseline protein levels and longitudinal clinical progression. We hypothesize that RSFC network integrity decreases longitudinally in participants with PD prior to dementia onset and that α-synuclein and Aβ predict RSFC decline. To test these hypotheses, participants completed a baseline lumbar puncture and Aβ PET scan, longitudinal RSFC, and clinical assessments.
Methods
Standard protocol approvals, registrations, and patent consents
The Washington University in St. Louis Human Research Protection Office and Radioactive Drug Research Committee approved this study. All participants provided written informed consent.
Participants
As part of an ongoing longitudinal study, 77 participants with PD and 37 control participants completed longitudinal RSFC scans and longitudinal clinical assessments between January 2010 and July 2016. Portions of the cross-sectional data have been reported9,15–17; the present study includes additional participants (original cross-sectional RSFC analyses included 43 participants with PD and 22 controls9) and new longitudinal data. Follow-up periods ranged from 1 to 6 years, with 2–4 visits depending on time since enrollment. Idiopathic PD diagnosis was based on modified UK PD Society Brain Bank criteria.18 Dementia was assessed with the Clinical Dementia Rating (CDR),19 a global score of 0 = normal, 0.5 = cognitive decline, and ≥1 = dementia, with higher total scores (sum of boxes) indicating increased impairment. Six participants with PD were excluded owing to dementia (CDR ≥ 1) at baseline. Nine participants with PD converted to dementia (CDR = 1) during the follow-up period. Analyses were conducted both with and without these participants to test for RSFC changes prior to dementia onset. Exclusion criteria included neurologic diagnosis other than PD, head injury with loss of consciousness >5 minutes or neurologic sequelae, severe psychiatric disorders (e.g., schizophrenia), treatment with dopaminergic blocking or depleting drugs, or inability to complete MRI. Age-matched controls were recruited through participants with PD (e.g., spouses/partners). Additional criteria for controls included normal neurologic examination, intact cognition (CDR = 0), no first-degree family history of PD, and no evidence of preclinical Alzheimer disease20 based on Aβ PET (Pittsburgh compound B), as described.15 Six controls were excluded (1 with CDR = 0.5; 5 with elevated cortical Aβ PET). All remaining controls had normal cognition (CDR = 0 and Mini-Mental State Examination ≥ 24) at baseline and follow-up visits. Thus, 71 participants with PD and 31 control participants were analyzed further.
Protein measures
Due to refusal or ineligibility (e.g., on blood thinners), only a subset of participants (55 PD and 20 controls) completed a lumbar puncture for CSF α-synuclein, Aβ, and tau protein levels. CSF protein levels were quantified using commercially available sandwich ELISAs kits (Covance [Princeton, NJ] for α-synuclein; Innotest from Fujirebio [Malvern, PA] for Aβ and tau), as described.16 All participants completed baseline Aβ PET (Pittsburgh compound B), with the mean cortical binding potential (MCBP) as the primary measure of Aβ PET.15
Motor and cognitive assessments
Longitudinal clinical assessments included motor examinations, full neuropsychological testing, and CDR evaluations. Motor severity was assessed using the Unified Parkinson’s Disease Rating Scale motor evaluation (UPDRS-III total score)21 “off” PD medications. Participants also completed neuropsychological testing, assessing attention (Digit Span22; Digit Symbol22), memory (Logical Memory23; California Verbal Learning Test–II short form24), language (Boston Naming Test25), visuospatial (Judgement of Line Orientation26; Hooper Visual Organization Test27) and executive function (Trail-Making Test28; Stroop Inhibition29; Verbal Fluency Switching29), as described15,17 while “off” medication.30 Age-adjusted scaled scores were converted to z scores and averaged across cognitive domains to create a global cognition metric (average cognitive z score). Participants completed motor and cognitive assessments at each study visit; change in motor and cognitive function was computed as the change in UPDRS-III total score, CDR sum of boxes, and average cognitive z score from the first to the last time point coinciding with RSFC scans.
Resting-state functional connectivity
MRI scans were completed “off” PD medications (3T Siemens [Munich, Germany] Trio; 12-channel head coil). Structural scans included T1-weighted magnetization-prepared rapid gradient echo (repetition time [TR] 2,400 ms, inversion time [TI] 1,000 ms, echo time [TE] 16 ms, flip angle 8°, 0.9 mm3) and T2-weighted MRI (TE 455 ms, TR 3,200 ms, 1 mm3). Participants completed up to 3 RSFC runs, depending on time and participant tolerance (200 volumes/run, TE 27 ms, TR 2,200 ms, field of view 256 mm, flip angle 90°, 4 mm3), with eyes closed but awake (confirmed verbally). RSFC runs with observable, sustained movement (e.g., tremor) were excluded.
Standard fMRI preprocessing methods,9,11,31 using in-house processing scripts, include compensation for systematic, slice-dependent time shifts, elimination of odd–even slice intensity differences due to interleaved acquisition, rigid-body correction for head motion within and across runs, and normalization of signal intensity to a mode value of 1,000. Functional data were coregistered across visits, with functional data from follow-up scans registered to functional data from the first RSFC time point, to ensure that observed longitudinal changes were not attributable to differences in atlas registration across time points. Atlas transformation occurred by composition of affine transforms derived by a sequence of coregistrations of the fMRI volumes, structural scans, and an atlas representative template created from equal numbers of participants with PD and control participants to minimize registration bias of MRI scans.9,11 Head motion correction was applied in a single resampling that generated volumetric time series in 3 mm3 atlas space. Standard RSFC preprocessing analyses11,31 included spatial smoothing (6 mm full width half maximum) and temporal low-pass filtering (<0.1 Hz). Nuisance regressors included 6 rigid body measures derived from head motion correction, white matter and CSF signals, and mean whole-brain signal, to reduce physiologic noise32 and motion artifacts.33,34
RSFC quality assurance
Motion artifacts and movement confounds were minimized through strict quality assurance measures and motion scrubbing.34,35 Motion criteria were head motion <1.0 mm root mean squared per run; voxel-wise temporal SD averaged over the brain (after full preprocessing) ≤0.5%; and frame-to-frame signal intensity changes (DVARS35) ≤0.3%. Each run required 50 useable volumes and each participant needed ≥150 useable volumes for a minimum of 5.5 minutes of RSFC data. Four control participants and 7 participants with PD were excluded due to excessive motion.
Network-level RSFC
Network-level RSFC analyses focused on 5 previously defined cortical networks: default mode network (DMN), dorsal attention network (DAN), frontoparietal control network (FPCN), salience network (SAL), and SMN.9,36,37 Networks were chosen based on their relevance for the neuropsychological (DMN, DAN, FPCN, SAL) and sensorimotor (SMN) aspects of PD and previously demonstrated association with CSF proteins.9 Each network was defined by a set of expanded seed regions (figure 1), using the same approach as established with our previous cross-sectional analyses9 and previously established network definitions.9,36,37 Specifically, the DMN included posterior cingulate/precuneus, medial prefrontal cortex (PFC), left and right lateral parietal cortex, and left and right inferior temporal regions; DAN included left and right frontal eye fields, left and right middle temporal area, and both left and right anterior and posterior intraparietal sulcus; FPCN (previously labeled as the control network in our original cross-sectional analyses9) included dorsal medial PFC, left and right anterior PFC, and left and right superior parietal cortex; SAL included dorsal anterior cingulate cortex, left and right anterior PFC, left and right insula, and left and right lateral parietal cortex; SMN included left and right motor cortex, supplemental motor area, and left and right primary visual and auditory cortex.
Figure 1. Resting-state functional connectivity (RSFC) network regions.

The expanded seed regions for each RSFC network are displayed as a representative slice for each network. Colors indicate the respective RSFC networks as follows: blue = default mode network (DMN); red = dorsal attention network (DAN); green = frontoparietal control network (FPCN); purple = salience network (SAL); teal = sensorimotor network (SMN). See table e-1 in Campbell et al.9 for a list of seed region coordinates.
To generate regions of interest, a seed-based approach was first applied using 5-mm radius spheres centered on Talairach atlas coordinates as previously defined for the key nodes of each network listed above.15,32,33 Individual-level Fisher z transformed correlation maps for each seed were averaged across groups. Expanded seed regions were defined as voxels satisfying |z| > 3 in the group correlation maps. Using expanded seed regions avoids potential small atlas registration errors and minor individual deviations in peak RSFC locations, similar to a parcel-based approach.38 Composite scores, representing intranetwork (within) and internetwork (between) RSFC, were computed as the mean of Fisher z transformed correlations between seed region pairs for each network.9,37 The intranetwork and internetwork composite scores for each participant, at each time point, were analyzed as measures of network-level RSFC.
Statistical analyses
A series of growth models, a type of longitudinal mixed-effects analysis, were conducted using multilevel modeling to test between-group differences in longitudinal network-level RSFC. This statistical approach allows for variability in the number and duration of longitudinal data points and permits maximal utilization of data analysis without restricting the analyses to a common set of time points as with other approaches (e.g., repeated-measures analyses of variance). Growth was defined as a linear trend with random slopes, modeled as a random effect. Standardized age, education, sex, and disease duration were included as covariates. Time was modeled as months since first RSFC time point and reported as annualized estimates (e.g., change per year) for convenience of interpretation. When examining group effects, controls were set as the reference group (i.e., 0). Model estimates represent a change in the outcome (e.g., SMN) with a 1-unit change of the variable (e.g., 1 year, control to PD group). Interaction terms involving time test the differences in trajectories between groups (e.g., control vs PD) or levels of continuous predictors (e.g., 1 SD above and below the mean). Time interactions were examined for the PD group, protein levels, and changes in motor and cognitive function. To limit the number of statistical comparisons, analyses involving protein levels and behavior were restricted to RSFC networks with significant time by group interactions. Data were analyzed using R39 with growth models fit using the lme4 package.40 All tests were 2-tailed and p ≤ 0.05 was considered statistically significant.
Data availability
Data presented in this report will be made available to research investigators upon request to the corresponding author.
Results
Participants
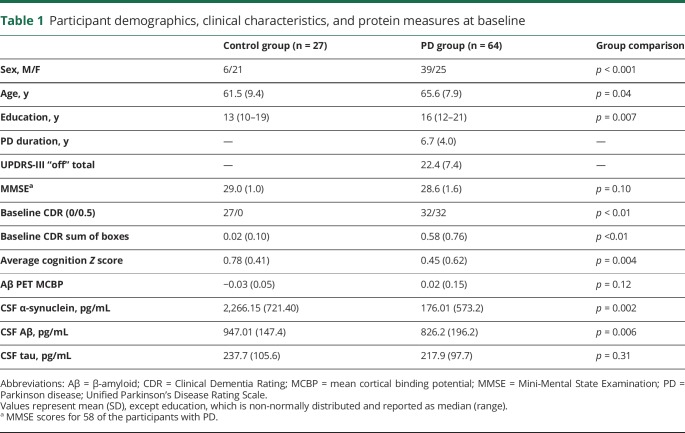
Sixty-four participants with PD without dementia and 27 controls had useable RSFC data for ≥2 time points (21 PD, 10 controls with ≥3; 6 PD with 4). At the first RSFC time point, the PD group was older (F1,87 = 4.57, p = 0.04), more educated (nonparametric Mann-Whitney U test due to non-normally distributed values; U = 556.5, z = −2.72, p = 0.007), and had more men (χ2 = 11.39, df = 1, p = 0.001) (see table 1 for demographic and clinical information). Therefore, age, education, and sex were included as covariates in group comparisons of RSFC data.
Table 1.
Participant demographics, clinical characteristics, and protein measures at baseline
Cross-sectional analyses
CSF α-synuclein and Aβ were significantly lower in the PD group than in controls (nonparametric Mann-Whitney U test; α-synuclein: U = 315, z = −3.05, p = 0.002; Aβ: U = 343, z = −2.72, p = 0.006), but there were no group differences in total tau (p = 0.31) or Aβ PET (MCBP; p = 0.12) (table 1). The PD group also demonstrated significantly lower (weaker) SMN RSFC (analysis of covariance [ANCOVA] with age, sex, education covariates; F1,88 = 6.93, p = 0.01). In addition, the PD group demonstrated significantly reduced FPCN-SMN internetwork RSFC (ANCOVA; F1,88 = 4.03, p = 0.05). None of the other networks or internetwork interactions significantly differed between groups (ps ≥ 0.07) at baseline. Finally, lower CSF α-synuclein correlated with reduced SMN strength in PD (n = 55, r = 0.35, p = 0.009). Thus, baseline cross-sectional results are consistent with our previous findings.9,15,16
Longitudinal network-level RSFC
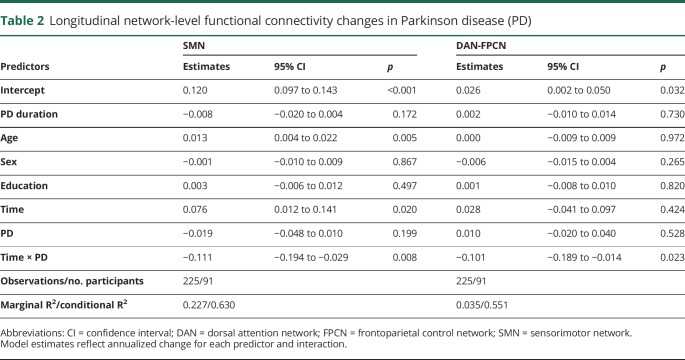
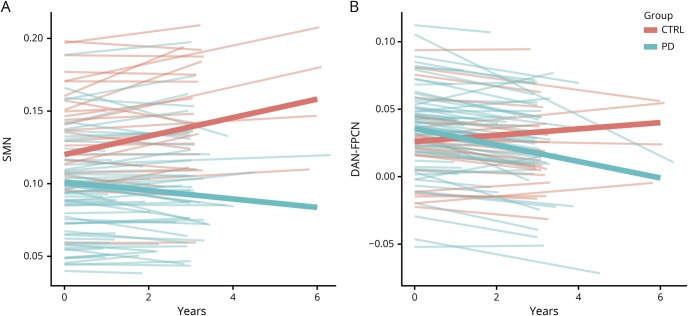
Multilevel growth models, with age, sex, education, and disease duration covariates, compared longitudinal network-level RSFC changes between groups (e.g., time by group). There was a significant group by time effect for within-network SMN integrity, with the PD group declining slightly in contrast to the slight increase for controls (annualized estimates = −0.11, t = −2.64, p = 0.008; table 2, figure 2A). Splitting the PD group based on cognitive status at baseline (PD CDR = 0, n = 36; PD CDR = 0.5, n = 28; control CDR = 0, n = 27) revealed that both the cognitively normal (annualized estimates = −0.099, SE = 0.047, t = −2.14, p = 0.035) and cognitively impaired groups (annualized estimates = −0.137, SE = 0.065, t = −2.11, p = 0.022) showed significant SMN differences compared to controls but not each other (annualized estimates = −0.36, SE = 0.052, t = 0.69, p = 0.49). Importantly, excluding participants who developed dementia (n = 9) resulted in no substantive changes; the PD group declined more rapidly in SMN compared to controls, prior to dementia onset (annualized estimates = −0.105, SE = 0.043, t = −2.45, p = 0.016).
Table 2.
Longitudinal network-level functional connectivity changes in Parkinson disease (PD)
Figure 2. Longitudinal network-level resting-state functional connectivity (RSFC) decline in Parkinson disease (PD).
(A) Linear growth curve models reveal a significant group × time interaction for the sensorimotor network (SMN) network, indicating longitudinal decline of SMN RSFC strength for the PD group (blue lines). (B) The interaction, or internetwork RSFC, between dorsal attention network (DAN) and frontoparietal control network (FPCN) declines longitudinally in the PD group (blue lines).
There was also a significant group by time interaction for DAN-FPCN trajectories (figure 2B). Participants with PD evidenced greater declines in DAN-FPCN compared to controls (annualized estimates = −0.102, SE = 0.045, t = −2.29, p = 0.02). Again, both participants with PD with normal cognition (n = 36; annualized estimates = −0.109, SE = 0.054, t = −2.03, p = 0.045) and those with cognitive decline at baseline showed this effect (n = 28; annualized estimates = −0.099, SE = 0.051, t = −1.96, p = 0.056) and were not significantly different from each other (annualized estimates = −0.013, SE = 0.064, t = −0.22, p = 0.83). Further, excluding participants who developed dementia (n = 9) yielded a significant group by time interaction (annualized estimates = −0.100, SE = 0.046, t = −2.16, p = 0.035), indicating DAN-FPCN internetwork RSFC declines prior to dementia onset.
Proteinopathy and longitudinal RSFC
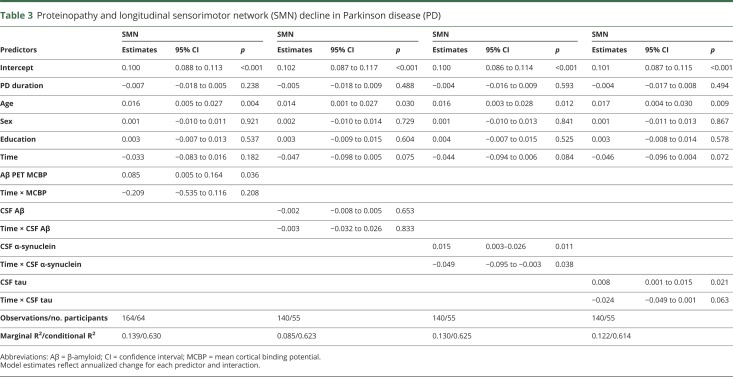
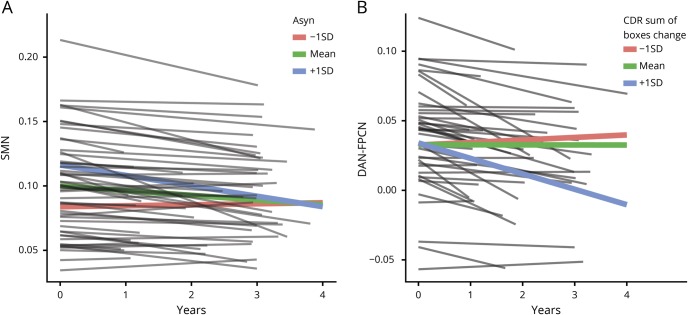
Growth models testing the interaction between baseline proteins (CSF α-synuclein, Aβ, tau; Aβ PET) and longitudinal RSFC network changes for participants with PD were restricted to only the RSFC networks with significant group by time effects (SMN; DAN-FPCN) to limit the number of statistical tests. No associations were found between proteins and DAN-FPCN (all ps > 0.52). As seen in table 3, however, SMN showed a number of associations. Surprisingly, PD with higher cortical Aβ PET binding (e.g., MCBP) had higher SMN RSFC, while there were no significant effects of CSF Aβ. However, as expected, participants with PD with lower CSF α-synuclein, and tau, had lower SMN at baseline. Interestingly, those with higher baseline CSF α-synuclein declined more rapidly across the study period in SMN strength compared to those with lower levels, who remained relatively stable across time (annualized estimates = −0.049, SE = 0.023, t = 2.09, p = 0.022; figure 3A). Participants with PD with higher CSF α-synuclein had higher baseline SMN RSFC, but within-network SMN integrity declined over time to match those patients with PD with lower CSF α-synuclein.
Table 3.
Proteinopathy and longitudinal sensorimotor network (SMN) decline in Parkinson disease (PD)
Figure 3. Proteinopathy, longitudinal resting-state functional connectivity (RSFC), and cognitive decline in Parkinson disease (PD).
(A) Within the PD group, sensorimotor network (SMN) RSFC strength declines the most for those with higher levels of CSF α-synuclein (i.e., +1 SD above the mean; blue line), while SMN RSFC strength is already reduced and remains relatively stable for those with lower levels (i.e., −1 SD below the mean; red line) of CSF α-synuclein. (B) Dorsal attention network (DAN)-FPCN internetwork strength declined the most among participants with PD with increased cognitive impairment (i.e., +1 SD above the mean; blue line), as measured by increased Clinical Dementia Rating (CDR) sum of boxes scores.
PD progression and longitudinal RSFC
Across the study period, motor severity increased (UPDRS-III “off” total mean change = 4.37, SD = 10.62; t [63] = 4.36, p < 0.001), and global cognition declined (CDR sum of boxes mean change = 0.71, SD = 1.36; t [60] = 4.07, p < 0.001; average cognitive Z score mean change = −0.12, SD = 0.41; t [63] = 2.44, p = 0.018). Baseline protein levels were mostly not associated with behavioral changes, except for CDR sum of boxes and CSF Aβ (r = −0.34, p < 0.01); participants with PD with lower CSF Aβ had worse cognitive function over time. Finally, SMN decline did not relate to increased motor severity (UPDRS-III “off” total, p = 0.66) or cognitive impairment (CDR sum of boxes, p = 0.90; average cognitive z score, p = 0.91). In contrast, DAN-FPCN decline related to cognitive decline (CDR sum of boxes; annualized estimates = −0.005, SE = 0.002, t = 2.47, p = 0.015; figure 3B). Participants with increased cognitive difficulties showed greater declines in DAN-FPCN functional connectivity.
Discussion
RSFC network integrity declines longitudinally in PD and relates to baseline CSF protein levels. Specifically, SMN intranetwork and DAN-FPCN internetwork RSFC decreased longitudinally in participants with PD without dementia, prior to dementia onset. In fact, baseline CSF α-synuclein levels predicted the longitudinal decline in SMN integrity. Further, longitudinal decline in DAN-FPCN interactions corresponded with increased cognitive impairment. These results suggest that network-level RSFC provides a sensitive measure of PD progression and that altered network-level RSFC precedes cognitive impairment and dementia onset.
Longitudinal SMN decline in PD
Functional connectivity within the SMN declines longitudinally in participants with PD without dementia, consistent with previous reports of cross-sectional SMN deficits9,17 and the characteristic motor deficits in PD. One other study also reported longitudinal decline in RSFC of motor and occipital regions in PD.14 Here, we found reduced network-level SMN integrity relates to baseline CSF α-synuclein. Notably, higher baseline CSF α-synuclein predicted greater SMN decline, while PD with lower CSF α-synuclein evidenced reduced, but stable, SMN RSFC. In other words, those with lower CSF α-synuclein already had lower SMN RSFC, while those with relatively higher CSF α-synuclein demonstrated longitudinal decline in SMN integrity.
Although motor function also declined during this time period, the rate of decline did not relate to CSF α-synuclein or reduced SMN RSFC. One possible explanation is that declining SMN integrity relates to specific motor features, such as gait and balance, that are not well-captured by the UPDRS-III ratings. Alternatively, these changes may not temporally co-occur and instead progress at different, perhaps even nonlinear, rates. Longitudinal RSFC changes in additional motor-related regions and networks should also be investigated, especially subcortical and cerebellar regions, which may relate to worsening motor severity.
Longitudinal DAN-FPCN decline in PD
The strength of the interaction between DAN and FPCN also declined longitudinally for participants with PD, prior to dementia onset. Extensive previous research demonstrates the roles of DAN and FPCN in top-down control of goal-directed behaviors.41,42 Thus, longitudinal decline in DAN-FPCN coupling may reflect decreased cognitive flexibility and reduced top-down cognitive control in PD. In fact, DAN-FPCN decline fits with the classic observation that individuals with PD often rely on externally driven cues and task demands, demonstrating greater difficulty on tasks requiring internally generated thoughts and strategies.43 Further, recent research suggests that DAN-FPCN internetwork RSFC may regulate visuospatial attention,44 another area of cognitive dysfunction with PD.45 Finally, longitudinal DAN-FPCN decline correlated with increased global cognitive impairment in PD, consistent with the notion that reduced DAN-FPCN coupling reflects cognitive dysfunction and precedes dementia onset.
Surprisingly, DAN-FPCN decline did not correlate with baseline protein levels. This may reflect the lack of regional specificity with CSF measures of soluble protein levels as an indirect measure of brain accumulation. Alternatively, these results could suggest that proteinopathy may not be the sole or primary pathology affecting this network interaction. Instead, neurotransmitter deficits, especially dopaminergic and cholinergic systems,7,30 may play a larger role in disruption of cognitively related associative networks in PD.
Longitudinal RSFC in aging and Alzheimer disease (AD)
The selective pattern of intranetwork and internetwork RSFC decline in PD differs from the pattern observed during healthy aging. For example, healthy older adults demonstrate decreased intranetwork RSFC and increased internetwork RSFC compared to younger adults, primarily affecting associative networks.46 The increased internetwork RSFC observed with healthy aging, representing network desegregation,46 is in contrast to the more selective network-level reduction of RSFC in PD17 as further evidenced by the longitudinal decline in both SMN and DAN-FPCN shown here.
The longitudinal RSFC declines in SMN and DAN-FPCN for individuals with PD also contrast with the central findings of DMN deficits in AD. Not only does the DMN decline longitudinally with AD,47 but interactions between DMN and FPCN also decline.48 Cross-sectional studies similarly demonstrate DMN deficits with increased cognitive impairment associated with AD.37 Interestingly, this may be preceded by an initial increase in DMN RSFC with mild cognitive impairment,49 prior to dementia onset. Additional longitudinal studies with direct comparison between AD and PD are needed to determine disease-specific RSFC markers.
Proteinopathy and RSFC
The relationship between CSF α-synuclein and longitudinal SMN decline follows the known pathology and predominant motor deficits in PD. For example, 2 previous cross-sectional studies report reduced RSFC in relation to CSF α-synuclein levels in PD.9,10 However, despite numerous studies implicating abnormal Aβ in PD,3,4,16 Aβ levels were not related to longitudinal RSFC decline in PD. In fact, PD with higher cortical Aβ PET binding had stronger SMN RSFC at baseline, contrary to the expected detrimental effect of abnormal Aβ. Most of the research on Aβ and RSFC, in the context of AD, focuses on the DMN, with the general finding that lower CSF Aβ relates to lower DMN RSFC.50 Even though CSF Aβ was significantly lower in participants with PD than controls, there were no group differences in DMN RSFC.
The relative lack of an association between Aβ and RSFC in PD raises the question of the functional significance of Aβ for PD. Although one argument might be that soluble Aβ monomers measured with CSF do not adequately reflect neuropathologic Aβ accumulation, the PET measure of fibrillar Aβ also did not correlate with RSFC decline in PD. Instead, CSF Aβ predicted longitudinal cognitive decline in PD. Measures of other Aβ conformations, such as CSF Aβ oligomers or PET tracers for diffuse Aβ plaques, will permit better assessment of the role of Aβ in PD. Thus, it remains unclear if Aβ pathology contributes, either uniquely or in combination with α-synuclein, to PD progression or is secondary to α-synuclein pathology. Additional research on the potential unique and combined effects of Aβ in the context of PD is needed.
Strengths and limitations
The present study provides new insights on RSFC and the relationship between proteinopathy and brain function in PD. This study represents one of the few longitudinal studies of RSFC in PD; many studies, even on aging and AD, use cross-sectional analyses to compare across groups (e.g., young, middle age, older; normal, impaired, dementia).37,46 Using a relatively large sample, with multiple time points (>2) for better estimation of change over time, we demonstrate network-level RSFC declines in PD. Our focus on both intranetwork and internetwork-level RSFC, rather than region or whole-brain RSFC, represents an important advance on previous research, especially in light of recent evidence of prominent internetwork RSFC reductions in PD.17 We employed rigorous methodology to control for potential confounds, including removal of motion artifacts, exclusion of potential preclinical AD controls, and age and disease duration covariates in sophisticated growth curve analyses. Importantly, this study focused on a well-characterized sample of participants with PD without dementia to identify potential antecedent markers of dementia. Finally, using multimodal biomarkers represents a crucial step for understanding the functional consequences of neuropathology and is at the forefront of PD research.
The present study focused on a limited set of cortical networks; larger sample sizes and more advanced statistical approaches would be required to examine longitudinal connectome-level RSFC. Larger sample sizes also would be necessary to detect subtle changes and potential subgroup differences. Although we attempted to restrict the number of analyses, we did not apply a formal multiple comparison correction and results should be interpreted with some caution. We also recognize that PD neuropathology involves more than just proteinopathy and can include neuroinflammation, atrophy, and neurotransmitter deficits. Despite these relative limitations, this study provides important new information regarding longitudinal RSFC changes and the potential role of proteinopathy in brain dysfunction with PD.
Network-level RSFC declines longitudinally in PD and may serve as a biomarker of PD progression. The greatest decline in SMN integrity occurred in participants with PD with less severely depleted CSF α-synuclein, suggesting that SMN integrity tracks severity of α-synuclein neuropathology. Longitudinal CSF measurements will be needed to further clarify this relationship. Further, longitudinal disruption of the interaction between DAN and FPCN associative networks related to cognitive decline, which may yield an antecedent biomarker for development of dementia. Surprisingly, neither Aβ PET nor CSF Aβ levels related to longitudinal RSFC changes in PD, raising further questions regarding the role of Aβ in the context of PD. Overall, this study emphasizes the role of α-synuclein pathology in brain dysfunction and provides initial evidence for network-level RSFC as a prognostic biomarker for PD progression.
Study funding
NINDS (NS097437, NS075321, NS097799, NS41509, NS058714, NS48924, P30 NS048056) and NIH NCRR (UL1RR024992); American Parkinson Disease Association (APDA) Advanced Research Center for PD at WUSTL; Greater St. Louis Chapter of the APDA; McDonnell Center for Systems Neuroscience; Barnes Jewish Hospital Foundation (Clinical Translational Research Award; Elliot Stein Family Fund; PD Research Fund).
Disclosure
M.C. Campbell receives salary and research support from NIH, American Parkinson Disease Association (APDA) Advanced Research Center for PD at WUSTL, and Greater St. Louis Chapter of the APDA. J.J. Jackson receives salary and research support from NIH and Washington University. J.M. Koller receives salary and research support from NIH. A.Z. Snyder receives salary and research support from NIH. P.T. Kotzbauer receives salary and research support from NIH, Michael J. Fox Foundation, ALS Association, ALS Finding a Cure, INADcure Foundation, Jasper Valentijn Foundation, and Biogen. He also receives research and speaking fees from AbbVie and consulting fees from Merck. J.S. Perlmutter receives salary and research support from NIH, Washington University, APDA, Greater St. Louis Chapter of the APDA, McDonnell Center for Higher Brain Function, Barnes-Jewish Hospital Foundation, Huntington's Disease Society of America, CHDI, Michael J. Fox Foundation, Fixel Foundation, Oertli Foundation, and Riney Foundation. He also received honoraria from the American Academy of Neurology, Rochester, Emory, Parkinson Disease Foundation, Columbia, St Louis University, University of Pennsylvania, Harvard University, and University of Michigan. Go to https://n.neurology.org/lookup/doi/10.1212/WNL.0000000000008677 for full disclosures.
Acknowledgment
The authors thank the study participants and the research coordinators and nurse coordinator Johanna Hartlein, NP, for assistance with recruitment and data collection.
Glossary
- Aβ
β-amyloid
- AD
Alzheimer disease
- ANCOVA
analysis of covariance
- CDR
Clinical Dementia Rating
- DAN
dorsal attention network
- DMN
default mode network
- FPCN
frontoparietal control network
- MCBP
mean cortical binding potential
- PD
Parkinson disease
- PFC
prefrontal cortex
- RSFC
resting-state functional connectivity
- SAL
salience network
- SMN
sensorimotor network
- TE
echo time
- TI
inversion time
- TR
repetition time
- UPDRS
Unified Parkinson’s Disease Rating Scale
Appendix. Authors

References
- 1.Halliday G, Lees A, Stern M. Milestones in Parkinson's disease: clinical and pathologic features. Mov Disord 2011;26:1015–1021. [DOI] [PubMed] [Google Scholar]
- 2.Braak H, Ghebremedhin E, Rüb U, Bratzke H, Del Tredici K. Stages in the development of Parkinson's disease-related pathology. Cell Tissue Res 2004;318:121–134. [DOI] [PubMed] [Google Scholar]
- 3.Kotzbauer PT, Cairns NJ, Campbell MC, et al. Pathologic accumulation of alpha-synuclein and Abeta in Parkinson disease patients with dementia. Arch Neurol 2012;69:1326–1331. [DOI] [PMC free article] [PubMed] [Google Scholar]
- 4.Hall S, Surova Y, Öhrfelt A, Zetterberg H, Lindqvist D, Hansson O. CSF biomarkers and clinical progression of Parkinson disease. Neurology 2015;84:57–63. [DOI] [PMC free article] [PubMed] [Google Scholar]
- 5.Kehagia AA, Barker RA, Robbins TW. Neuropsychological and clinical heterogeneity of cognitive impairment and dementia in patients with Parkinson's disease. Lancet Neurol 2010;9:1200–1213. [DOI] [PubMed] [Google Scholar]
- 6.Buddhala C, Loftin SK, Kuley BM, et al. Dopaminergic, serotonergic, and noradrenergic deficits in Parkinson disease. Ann Clin Transl Neurol 2015;2:949–959. [DOI] [PMC free article] [PubMed] [Google Scholar]
- 7.Bohnen NI, Albin RL. The cholinergic system and Parkinson disease. Behav Brain Res 2011;221:564–573. [DOI] [PMC free article] [PubMed] [Google Scholar]
- 8.Aarsland D, Andersen K, Larsen JP, Lolk A, Kragh-Sorensen P. Prevalence and characteristics of dementia in Parkinson disease: an 8-year prospective study. Arch Neurol 2003;60:387–392. [DOI] [PubMed] [Google Scholar]
- 9.Campbell MC, Koller JM, Snyder AZ, Buddhala C, Kotzbauer PT, Perlmutter JS. CSF proteins and resting-state functional connectivity in Parkinson disease. Neurology 2015;84:2413–2421. [DOI] [PMC free article] [PubMed] [Google Scholar]
- 10.Madhyastha TM, Askren MK, Zhang J, Leverenz JB, Montine TJ, Grabowski TJ. Group comparison of spatiotemporal dynamics of intrinsic networks in Parkinson's disease. Brain 2015;138:2672–2686. [DOI] [PMC free article] [PubMed] [Google Scholar]
- 11.Hacker CD, Perlmutter JS, Criswell SR, Ances BM, Snyder AZ. Resting state functional connectivity of the striatum in Parkinson's disease. Brain 2012;135:3699–3711. [DOI] [PMC free article] [PubMed] [Google Scholar]
- 12.Helmich RC, Derikx LC, Bakker M, Scheeringa R, Bloem BR, Toni I. Spatial remapping of cortico-striatal connectivity in Parkinson's disease. Cereb Cortex 2010;20:1175–1186. [DOI] [PubMed] [Google Scholar]
- 13.Baggio HC, Segura B, Sala-Llonch R, et al. Cognitive impairment and resting-state network connectivity in Parkinson's disease. Hum Brain Mapp 2015;36:199–212. [DOI] [PMC free article] [PubMed] [Google Scholar]
- 14.Olde Dubbelink KT, Schoonheim MM, Deijen JB, Twisk JW, Barkhof F, Berendse HW. Functional connectivity and cognitive decline over 3 years in Parkinson disease. Neurology 2014;83:2046–2053. [DOI] [PubMed] [Google Scholar]
- 15.Foster ER, Campbell MC, Burack MA, et al. Amyloid imaging of Lewy body-associated disorders. Mov Disord 2010;25:2516–2523. [DOI] [PMC free article] [PubMed] [Google Scholar]
- 16.Buddhala C, Campbell MC, Perlmutter JS, Kotzbauer PT. Correlation between decreased CSF alpha-synuclein and Abeta(1)(-)(4)(2) in Parkinson disease. Neurobiol Aging 2015;36:476–484. [DOI] [PMC free article] [PubMed] [Google Scholar]
- 17.Gratton C, Koller JM, Shannon W, et al. Emergent functional network effects in Parkinson disease. Cereb Cortex 2019;29:2509–2523. [DOI] [PMC free article] [PubMed] [Google Scholar]
- 18.Hughes AJ, Daniel SE, Kilford L, Lees AJ. Accuracy of clinical diagnosis of idiopathic Parkinson's disease: a clinico-pathological study of 100 cases. J Neurol Neurosurg Psychiatry 1992;55:181–184. [DOI] [PMC free article] [PubMed] [Google Scholar]
- 19.Morris JC. The clinical dementia rating (CDR): current version and scoring rules. Neurology 1993;43:2412–2414. [DOI] [PubMed] [Google Scholar]
- 20.Sperling RA, Aisen PS, Beckett LA, et al. Toward defining the preclinical stages of Alzheimer's disease: recommendations from the National Institute on Aging-Alzheimer's Association Workgroups on Diagnostic Guidelines for Alzheimer's disease. Alzheimers Dement 2011;7:280–292. [DOI] [PMC free article] [PubMed] [Google Scholar]
- 21.Fahn S, Elton RL; Committee MotUD. Unified Parkinson's Disease Rating Scale. In: Fahn S, Marsden CD, Goldstein M, Calne DB, eds. Recent Developments in Parkinson's Disease. New York: Macmillan; 1987:153–163. [Google Scholar]
- 22.Wechsler D. Wechsler Adult Intelligence Scale–III.San Antonio: Psychological Corporation; 1997. [Google Scholar]
- 23.Wechsler D. Wechsler Memory Scale III. San Antonio: Psychological Corporation; 1997. [Google Scholar]
- 24.Delis D, Kaplan E, Kramer J, Ober B. California Verbal Learning Test II. San Antonio: Psychological Corporation; 2000. [Google Scholar]
- 25.Kaplan E, Goodglass H, Weintraub S. Boston Naming Test, 2nd ed. Austin: Pro-ED; 2001. [Google Scholar]
- 26.Lezak MD. Howieson DB, Bigler ED, Tranel D. Neuropsychological Assessment, vol 4. 2004; xiv, 1016. [Google Scholar]
- 27.Hooper HE. Hooper Visual Organization Test (VOT). Los Angeles: Hooper; 1983. [Google Scholar]
- 28.Lezak MD. Neuropsychological Assessment, 3rd ed. Oxford: Oxford University Press; 1995. [Google Scholar]
- 29.Delis DC, Kaplan E, Kramer JH. Delis Kaplan Executive Function System. San Antonio: Psychological Corporation: 2001. [Google Scholar]
- 30.Cools R. Dopaminergic modulation of cognitive function-implications for L-DOPA treatment in Parkinson's disease. Neurosci Biobehav Rev 2006;30:1–23. [DOI] [PubMed] [Google Scholar]
- 31.Fox MD, Snyder AZ, Vincent JL, Corbetta M, Van Essen DC, Raichle ME. The human brain is intrinsically organized into dynamic, anticorrelated functional networks. Proc Natl Acad Sci USA 2005;102:9673–9678. [DOI] [PMC free article] [PubMed] [Google Scholar]
- 32.Macey PM, Macey KE, Kumar R, Harper RM. A method for removal of global effects from fMRI time series. Neuroimage 2004;22:360–366. [DOI] [PubMed] [Google Scholar]
- 33.Power JD, Mitra A, Laumann TO, Snyder AZ, Schlaggar BL, Petersen SE. Methods to detect, characterize, and remove motion artifact in resting state fMRI. Neuroimage 2014;84:320–341. [DOI] [PMC free article] [PubMed] [Google Scholar]
- 34.Ciric R, Wolf DH, Power JD, et al. Benchmarking of participant-level confound regression strategies for the control of motion artifact in studies of functional connectivity. Neuroimage 2017;154:174–187. [DOI] [PMC free article] [PubMed] [Google Scholar]
- 35.Power JD, Barnes KA, Snyder AZ, Schlaggar BL, Petersen SE. Spurious but systematic correlations in functional connectivity MRI networks arise from subject motion. Neuroimage 2012;59:2142–2154. [DOI] [PMC free article] [PubMed] [Google Scholar]
- 36.Raichle ME. The restless brain. Brain Connect 2011;1:3–12. [DOI] [PMC free article] [PubMed] [Google Scholar]
- 37.Brier MR, Thomas JB, Snyder AZ, et al. Loss of intranetwork and internetwork resting state functional connections with Alzheimer's disease progression. J Neurosci 2012;32:8890–8899. [DOI] [PMC free article] [PubMed] [Google Scholar]
- 38.Gordon EM, Laumann TO, Adeyemo B, Huckins JF, Kelley WM, Petersen SE. Generation and evaluation of a cortical area parcellation from resting-state correlations. Cereb Cortex 2016;26:288–303. [DOI] [PMC free article] [PubMed] [Google Scholar]
- 39.R: A Language and Environment for Statistical Computing [computer program]. R Foundation for Statistical Computing; 2010. [Google Scholar]
- 40.Bates D, Maechler M, Bolker B, Walker S. Fitting linear mixed-effects models using lme4. J Stat Softw 2015;67:1–48. [Google Scholar]
- 41.Dosenbach NU, Fair DA, Miezin FM, et al. Distinct brain networks for adaptive and stable task control in humans. Proc Natl Acad Sci USA 2007;104:11073–11078. [DOI] [PMC free article] [PubMed] [Google Scholar]
- 42.Spreng RN, Sepulcre J, Turner GR, Stevens WD, Schacter DL. Intrinsic architecture underlying the relations among the default, dorsal attention, and frontoparietal control networks of the human brain. J Cogn Neurosci 2013;25:74–86. [DOI] [PMC free article] [PubMed] [Google Scholar]
- 43.Brown RG, Marsden CD. Internal versus external cues and the control of attention in Parkinson's disease. Brain 1988;111:323–345. [DOI] [PubMed] [Google Scholar]
- 44.Dixon ML, De La Vega A, Mills C, et al. Heterogeneity within the frontoparietal control network and its relationship to the default and dorsal attention networks. Proc Natl Acad Sci USA 2018;115:E1598–E1607. [DOI] [PMC free article] [PubMed] [Google Scholar]
- 45.Gasca-Salas C, Estanga A, Clavero P, et al. Longitudinal assessment of the pattern of cognitive decline in non-demented patients with advanced Parkinson's disease. J Parkinson's Dis 2014;4:677–686. [DOI] [PubMed] [Google Scholar]
- 46.Chan MY, Park DC, Savalia NK, Petersen SE, Wig GS. Decreased segregation of brain systems across the healthy adult lifespan. Proc Natl Acad Sci USA 2014;111:E4997–E5006. [DOI] [PMC free article] [PubMed] [Google Scholar]
- 47.Damoiseaux JS, Prater KE, Miller BL, Greicius MD. Functional connectivity tracks clinical deterioration in Alzheimer's disease. Neurobiol Aging 2012;33:828, e819–e830. [DOI] [PMC free article] [PubMed] [Google Scholar]
- 48.Hafkemeijer A, Möller C, Dopper EG, et al. A longitudinal study on resting state functional connectivity in behavioral variant frontotemporal dementia and Alzheimer's disease. J Alzheimers Dis 2017;55:521–537. [DOI] [PubMed] [Google Scholar]
- 49.Serra L, Cercignani M, Mastropasqua C, et al. Longitudinal changes in functional brain connectivity predicts conversion to Alzheimer's disease. J Alzheimers Dis 2016;51:377–389. [DOI] [PubMed] [Google Scholar]
- 50.Wang L, Brier MR, Snyder AZ, et al. Cerebrospinal fluid Abeta42, phosphorylated Tau181, and resting-state functional connectivity. JAMA Neurol 2013;70:1242–1248. [DOI] [PMC free article] [PubMed] [Google Scholar]
Associated Data
This section collects any data citations, data availability statements, or supplementary materials included in this article.
Data Availability Statement
Data presented in this report will be made available to research investigators upon request to the corresponding author.


