

Supplemental Digital Content is available in the text.
Keywords: chronic kidney disease; diabetes mellitus; hypertension; hypertension, renovascular; kidney
Abstract
Lowering blood pressure (BP) can lead to an initial decline in estimated glomerular filtration rate (eGFR). However, there is debate how much eGFR decline is acceptable. We performed a post hoc analysis of ACCORD-BP (Action to Control Cardiovascular Risk in Diabetes-Blood Pressure) and SPRINT (Systolic Blood Pressure Intervention Trial), which randomized patients to intensive or standard systolic BP-targets. We determined the relation between initial decline in mean arterial pressure and eGFR. Subsequently, we stratified patients to BP-target and initial eGFR decrease and assessed the relation with annual eGFR decline after 1 year. A total of 13 266 patients with 41 126 eGFR measurements were analyzed. Up to 10 mm Hg of BP-lowering, eGFR did not change. Hereafter, there was a linear decrease of 3.4% eGFR (95% CI, 2.9%–3.9%) per 10 mm Hg mean arterial pressure decrease. The observed eGFR decline based on 95% of the subjects varied from 26% after 0 mm Hg to 46% with a 40 mm Hg mean arterial pressure decrease. There was no difference in eGFR slope (P=0.37) according to initial eGFR decline and BP-target, with a decrease of 1.24 (95% CI, 1.09–1.39), 1.20 (95% CI, 0.97–1.43), and 1.14 (95% CI, 0.77–1.50) in the 5%, 5% to 20%, and >20% stratum during intensive and 0.95 (95% CI, 0.81–1.09), 1.23 (95% CI, 0.97–1.49), and 1.17 (95% CI, 0.65–1.69) mL/minute per 1.73 m2 per year during standard treatment. In patients at high cardiovascular risk with and without diabetes mellitus, we found no association between initial eGFR and annual eGFR decline during BP-lowering treatment. Our results support that an eGFR decrease up to 20% after BP lowering can be accepted and suggest that the limit can be extended up to 46% depending on the achieved BP reduction.
Registration—
URL: https://www.clinicaltrials.gov; Unique identifier: NCT00000620, NCT01206062.
See Editorial, pp 1163–1164
When blood pressure (BP) is acutely lowered by antihypertensive treatment, renal function often declines. There is debate to what extent such a decrease in renal function can be accepted.1 An initial decline in renal function can be attributed to a reduction in glomerular hyperfiltration because of lower glomerular perfusion pressure but carries the risk of iatrogenic renal ischemia.2 Guidelines therefore recommend that tapering of BP-lowering therapy should be considered when the initial increase in serum creatinine exceeds >30%, corresponding to an estimated glomerular filtration rate (eGFR) decrease of ≈20%.3–5 Multiple observational studies have shown that an initial decrease in renal function is associated with an increased risk of cardiovascular morbidity and all-cause mortality, but recent studies, including our own, suggest that the increased risk in adverse outcomes may not be causally related to a decrease in BP.6–8 In contrast, hypertension is an important risk factor and accelerator for the development of chronic kidney disease (CKD).9,10 In patients with diabetic and nondiabetic CKD, BP-lowering therapy is effective in the prevention of progression of CKD and death.11,12 Moreover, BP-lowering treatment is important for the prevention of cardiovascular disease in patients with and without CKD.13 It is therefore important to know the normal range of the initial eGFR decrease that is observed following initiation or intensification of antihypertensive therapy.14
The ACCORD-BP (Action to Control Cardiovascular Risk in Diabetes-Blood Pressure) study and SPRINT (Systolic Blood Pressure Intervention Trial) randomized patients at increased cardiovascular disease (CVD) risk with and without diabetes mellitus to intensive (<120 mm Hg) and standard (<140 mm Hg) BP-lowering targets.15,16 Previous analyses of individual patient data from SPRINT and ACCORD showed that intensive BP-lowering therapy led to a significant decrease in cardiovascular events, but also to an increased incidence of CKD.17,18 However, no difference in the incidence of end-stage kidney disease was observed between treatment groups in the ACCORD trial, while in SPRINT no significant renal events occurred in both randomization arms.19,20 As both trials used a similar design, we combined the data to perform a longitudinal analysis of renal function in patients treated to different BP targets. Our first objective was to assess the relation between changes in eGFR and BP. Second, we assessed the relation between the initial eGFR decrease and annual eGFR decline during follow-up.
Methods
Study Population and Intervention
For the present analysis, we used individual patient data from the ACCORD-BP and SPRINT trial. Methods and results for the primary outcome have been published elsewhere.15,16,19,20 All data used for this study have been made publicly available and can be requested at https://biolincc.nhlbi.nih.gov. In brief, patients were eligible for inclusion in one of both trials if they had a systolic BP between 130 and 180 mm Hg. Patients included in ACCORD-BP had a history of type 2 diabetes mellitus with a glycated hemoglobin level of 7.5% or more and had an increased CVD risk, defined as either an age above 40 with a history of a cardiovascular event or age above 55 years with multiple cardiovascular risk factors. Patients included in SPRINT had no history of diabetes mellitus, an age above 50 years, and were at increased CVD risk, defined as clinical or subclinical CVD, CKD marked by an eGFR <60 mL/minute per 1.73 m2, a Framingham risk score >15% or an age above 75 years. In both studies, patients were randomized to receive BP-lowering treatment aimed at standard (<140 mm Hg) or intensive (<120 mm Hg) systolic BP-targets. Participants in ACCORD-BP were included between 2001 and 2005 from sites in the United States and Canada, participants in SPRINT were enrolled between 2013 and 2013 from sites in the United States. ACCORD-BP and SPRINT were designed to have a 94% and 89% power to detect a 20% reduction in cardiovascular events. The data were obtained via the National Heart, Lung and Blood Institute. Its present use was approved by the institutional review board of the Amsterdam University Medical Centres, location AMC, The Netherlands.
Pooled Renal Function and BP Measurements
In the ACCORD trial, BP was measured every 4 months in the standard treatment group. In the intensive treatment group, patients were assessed every month in the first 4 months, and then every 2 months. In SPRINT, BP was measured every month in the first 3 months, and then every 3 months. In both studies, BP was taken as the average of 3 subsequent seated blood measurements using an automatic oscillometric device (model 907, Omron Healthcare, Lake Forest, IL). Patients were treated according to a similar titration protocol to reach the BP-target, where the choice of medication was at the clinician’s discretion. Serum creatinine was determined fasting in ACCORD at 4 months intervals in the first year, then annually. In SPRINT, it was measured at baseline, 1, 3, 6 months, 1 year, 18 months, 2, 3, and 4 years, where the measurements at baseline, 1, 2, and 4 years were fasting. Renal function was estimated using the Chronic Kidney Disease Epidemiology Collaboration formula, taking ethnicity into account.21 For the initial eGFR decline, we used the reciprocal of eGFR at 3 months in SPRINT and 4 months in ACCORD and baseline eGFR. We then used the data on renal function at 12, 24, 36, and 48 months for the pooled dataset to determine annual eGFR decline. For the annual eGFR decline, we performed subgroup analyses in ACCORD using all eGFR data from the first 5 years, and in SPRINT using data from the first 4 years. We defined occurrence of CVD according to the definition in SPRINT, see Table S2 in the Data Supplement.22
Statistical Analysis
We included all participants where the initial eGFR decline could be calculated and stratified patients according to their BP-target and to initial eGFR decline (<5% decline, 5%–20% decline, >20% decline) following previous publications.23,24 Baseline characteristics for each stratum were depicted and compared using the appropriate tests (ANOVA, Kruskal-Wallis, or χ2). Cardiovascular risk was estimated using the Framingham risk score.25 Increased albuminuria was defined according to current guidelines as albuminuria stage A2 or A3, corresponding to an albuminuria to creatinine ratio larger than 30 mg/g.26 Use of ACE (angiotensin-converting enzyme) inhibitors or angiotensin receptor blockers was determined after the initial decline and during the last study visit from the trial medication log.
The relation between initial eGFR decline and decline in BP was determined using a generalized additive regression model. We used relative eGFR expressed as a percentage with respect to baseline to account for intraindividual differences in renal function. Mean arterial pressure (MAP) was used as it reflects the steady component of renal perfusion pressure, which was determined as the weighted average of diastolic (0.6) and systolic (0.4) BP.27–29 The relation between MAP decrease and relative eGFR change was modeled using restricted cubic splines, the order was selected based on the Generalized Akaike Information Criterion. Next, we determined the regression line starting from the intercept of 0% eGFR decrease to determine the slope between relative eGFR and MAP. We then corrected for age, sex, BMI, baseline SBP, diabetes mellitus, increased albuminuria, and treatment allocation in a multiple linear regression model. A sensitivity analysis was performed using subgroups for the intensive and standard treatment group and using the difference in MAP and eGFR determined after the initial decline and 12 months. To assess the co-variation of BP and renal function for each initial eGFR decline stratum during follow-up, a mixed model with random intercept was used to assess the sequence of systolic BP and relative eGFR. To further assess the effect of BP on renal function in the >20% stratum, we stratified participants in the >20% stratum again after the initial decline into individuals whose BP was increased and individuals whose BP was lowered between 3 or 4 months and 12 months and assessed the time course using the same models.
Next, we determined the annual slope using absolute changes in eGFR using all available measurements starting from 1 year. Slopes were determined using a mixed model with random slope and intercept, with a correction term for the nonfasting visits in SPRINT. An ANOVA analysis was performed to assess whether the annual slope of renal function was different between strata, taking the randomization into account. If the ANOVA was significant, a post hoc comparison with respect to the <5% stratum of each treatment arm was performed. Average annual renal function decline was then determined from the same mixed model for all strata. We first performed a crude analysis, then corrected the slope for age and sex, and finally added an additional correction for baseline eGFR and SBP. Subgroup analyses were performed for the separate ACCORD and SPRINT cohorts, and a sensitivity analysis was performed excluding patients who had a cardiovascular event during follow-up. The statistical analyses were performed with R version 3.6.1 using the Linear and Non Linear Mixed Effects model (nlme) package version 3.1-140 and Generalized Additive models for Location, Scale and Shape (gamlss) 5.1-4 packages, figures were created using ggplot2 version 3.2.1. P values <0.05 were considered significant.
Results
Baseline Characteristics
The merged cohort consisted of 14 094 participants. After exclusion of patients with missing baseline or initial eGFR, 13 266 (94%) of the patients with a total of 41 126 eGFR measurements were included in the present analysis. A flowchart of the included participants is given in Figure 1, an overview of the baseline characteristics in Table S1 of the Data Supplement. In 10 626 (80%) of the individuals, at least 3 eGFR measurements were available. The average initial eGFR decline was 1.4% (SD 16.1) in the intensive group and was accompanied by an average systolic BP decrease of 16.3 mm Hg (SD 18.4). In the standard group, eGFR increased by 2.3% (SD 15.3), while average BP decreased by 6.0 mm Hg (SD 18.0). Following stratification according to initial eGFR decline, the >20% stratum in the intensive group was twice as large (699 participants, 10%) compared with the standard treatment group (334 participants, 5%). In the standard therapy group, baseline eGFR was higher in patients with a larger eGFR reduction, ranging from 75.6 in the <5% stratum to 79.1 mL/minute per 1.73 m2 in the >20% stratum, while there was no difference in baseline eGFR among the 3 strata in the intensive treatment group. Diabetes mellitus and increased albuminuria were more frequent in the strata with a larger initial eGFR decline in both treatment groups. A higher initial eGFR decrease was associated with a higher CVD risk score in patients without prior events, an increased prevalence of past cardiovascular events and an increased incidence of cardiovascular events during follow-up in both treatment groups. At the last visit, the use of ACE-inhibitors and angiotensin receptor blockers remained similar compared with after the initial eGFR decline with 84.2% and 70.1% in the >20% decline strata of the intensive and standard treatment group.
Figure 1.

Flow chart of the post hoc analysis of the combined ACCORD-BP (Action to Control Cardiovascular Risk in Diabetes-Blood Pressure) and SPRINT (Systolic Blood Pressure Intervention Trial). BP indicates blood pressure; and eGFR, estimated glomerular filtration rate.
Initial Decline in eGFR Versus Decline in BP
Figure 2 depicts the relation between the initial BP decrease and initial decline in renal function expressed as percentage of baseline eGFR. Up to a 10 mm Hg decrease in MAP, eGFR remained virtually unchanged, but larger decreases resulted in a linear decrease in eGFR of 3.4% (95% CI, 2.9–3.9) per 10 mm Hg decrease in MAP. The normal initial eGFR decline, based on the lower eGFR threshold of the 95% of the participants, ranged from 26% with 0 mm Hg decrease in MAP to a 46% lower eGFR with 40 mm Hg decrease in MAP. The relation between MAP and eGFR did not materially change after correction for age, sex, BMI, baseline SBP, treatment allocation, diabetes mellitus, and increased albuminuria (data not shown). Patients with diabetes mellitus had a higher initial eGFR decrease of 3.6% (95% CI, 3.0–4.2) independent of the reduction of MAP. Likewise, albuminuria was associated with a higher initial decrease in eGFR of 1.7% (95% CI, 1.1–2.4).
Figure 2.

Initial change in mean arterial pressure (MAP) vs change in estimated glomerular filtration rate (eGFR). Relative eGFR change is expressed with respect to baseline eGFR. Line shows mean change, the blue area the spread as 1 SD. Orange dotted line depicts lower limit of eGFR decline, as the observed lower bound in eGFR in 95% of the patients.
Time Course of eGFR and BP During Follow-Up
Figure 3 shows the time course of renal function and BP during intensive and standard BP-lowering therapy after stratification to the initial decrease in eGFR during a mean follow-up of 3.2 years. In both treatment groups, patients with a higher initial eGFR decline had a larger initial decline in BP as a result of a higher BP at baseline and a larger BP reduction following treatment intensification. In the intensive treatment group, systolic BP was lowered from 143.7 to 118.3 mm Hg in the >20% stratum, compared with a BP decrease from 137.8 to 124.4 mm Hg in the <5% stratum. Similarly, in the standard treatment group, BP was lowered from 145.4 to 128.2 in the >20% stratum compared with 138.3 to 134.1 in the <5% stratum. In the period between the initial eGFR decline and 12 months, eGFR increased from 70.4% to 78.6% in the >20% stratum in the intensive group, while BP increased to 121.7 mm Hg. A similar pattern of increasing BP and eGFR between the initial decrease and 12 months was observed in both the 5% to 20% and >20% eGFR initial decline strata in the standard treatment group, with eGFR increasing, respectively, from 88.7% to 92.6% and from 70.2% to 86.6%. This was accompanied by a BP increase of 132.8 to 136.0 and 128.2 to 137.0 mm Hg in the 5% to 20% and >20% stratum. Additional analysis in the >20% stratum showed that eGFR increased more in patients whose systolic BP increased between 4 and 12 months compared with individuals whose BP was further lowered (Figure S1). After 12 months, differences between eGFR between the strata did not change in both treatment groups.
Figure 3.
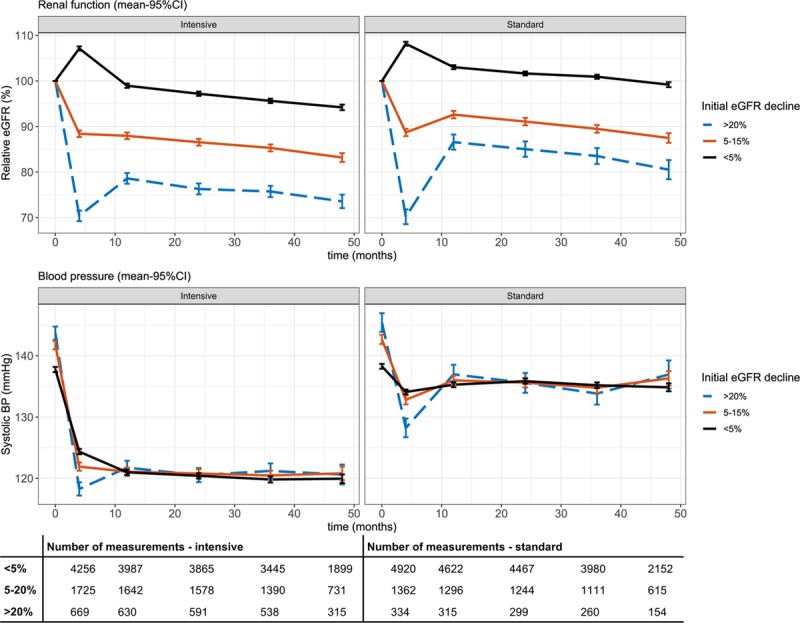
Time course of renal function (upper) and systolic blood pressure (lower) during follow-up. Renal function is depicted as percentage of estimated glomerular filtration rate (eGFR) relative to baseline eGFR. Bars indicates 95% CI. BP indicates blood pressure.
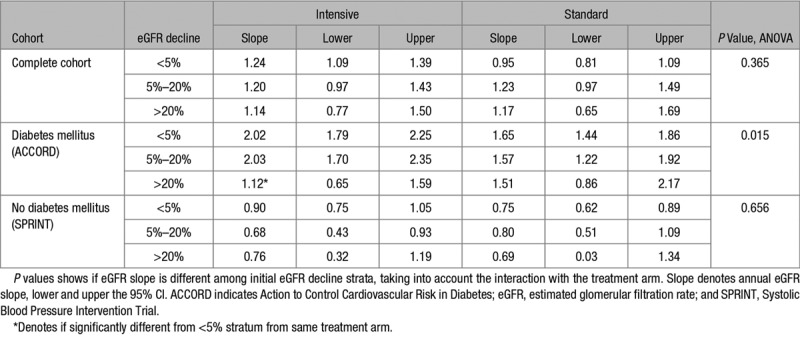
As shown in the Table, there were no significant differences in absolute eGFR slope determined after the first year among the initial eGFR decline strata (P=0.37). We found an annual eGFR decline of 1.24 (95% CI, 1.09–1.39), 1.20 (95% CI, 0.97–1.43), and 1.14 (95% CI, 0.77–1.50) for the <5%, 5% to 20%, and >20% initial decline strata, during intensive treatment, compared with 0.95 (95% CI, 0.81–1.09), 1.23 (95% CI, 0.97–1.49), and 1.17 (95% CI, 0.65–1.69) mL/minute per 1.73 m2 per year during standard treatment. Additional correction for age and sex, and baseline eGFR and SBP did not materially change these results (Table S2). In ACCORD, annual eGFR decline after the first year was significantly associated with the initial eGFR decline stratum (P=0.015). In this subgroup, a larger initial decline in eGFR was associated with a lower annual eGFR decrease after 12 months during follow-up. The >20% initial decline stratum in the intensive treatment group had the lowest slope of 1.12 (95% CI, 0.65–1.59) mL/minute per 1.73 m2 per year (P<0.001 compared with the <5% stratum), while in the <5% and 5% to 20% stratum, the slope was steeper with an annual change of 2.02 (95% CI, 1.79–2.25) and 2.03 (95% CI, 1.70–2.35). Slopes in the standard group were also steeper, with respectively 1.65 (95% CI, 1.44–1.86), 1.57 (95% CI, 1.22–1.92), and 1.51 (95% CI, 0.86–2.17) mL/minute per 1.73 m2 per year for the <5%, 5% to 20%, and >20% initial decline strata. In the SPRINT subgroup, annual eGFR decline was lower compared with ACCORD with an average decrease of 0.84 (95% CI, 0.71–0.96) in the intensive and 0.76 (95% CI, 0.63–0.88) mL/minute per 1.73 m2 per year in the standard treatment arm. We found no significant differences in SPRINT in average eGFR slopes between initial eGFR decline strata (P=0.66).
Table.
Annual eGFR Slope in Milliliters Per Minute Per 1.73 m2 Per Year Determined After 12 mo, Stratified to Treatment Arm and Initial eGFR Decline
Sensitivity Analyses
The relation between MAP and eGFR decline was similar in the intensive and standard treatment group; however, in the standard group, we observed a larger spread after 20 mm Hg of MAP lowering (see Figure S2). The relation was also similar using the changes between the initial eGFR decline period and 12 months, with a regression coefficient of 3.1 (95% CI, 2.9–3.3) between MAP and eGFR (see Figure S3). When the initial eGFR decline was directly correlated with the average eGFR slope, there was no relation between initial eGFR decline and average eGFR in the intensive group (P=0.75), while we observed a 0.011 (95% CI, 0.003–0.018, P=0.005) steeper slope for every 1% initial decrease in eGFR in the standard treatment group.
Discussion
In this post hoc analysis of the combined SPRINT and ACCORD-BP trial, we determined the normal range of eGFR decline during antihypertensive therapy in high-risk patients with and without diabetes mellitus. Our analysis demonstrates that when BP is lowered by >10 mm Hg, the initial decline in renal function is strongly depended on the decrease in BP. Based on 95% of the participants, an eGFR reduction of 26% can be considered normal for a BP decrease up to 10 mm Hg. A further decrease in BP resulted in an average eGFR reduction of 3.4% for every 10 mm Hg lowering of MAP, leading to a lower bound of 46% for a 40 mm Hg lower MAP. Comparison of the eGFR slopes after 1 year showed that a more profound initial decline in eGFR is not associated with an increased loss of renal function during a mean follow-up of 3.2 years during standard and intensive BP-lowering treatment.
Our results are in line with earlier statements that a 20% reduction in eGFR or 30% serum creatinine increase can be accepted.1 However, in many patients with hypertension, BP reductions will exceed 10 mm Hg, especially when lower BP values are targeted. Following a decrease in MAP of 40 mm Hg, an eGFR decline up to 46% can be considered normal, which corresponds to a serum creatinine increase of 66% in a 65-year-old man with a baseline eGFR of 67 mL/minute per 1.73 m2. Independent of the achieved BP reduction, patients with increased albuminuria and diabetes mellitus, both considered markers of glomerular hyperfiltration, had a higher eGFR reduction.30,31 Earlier post hoc analyses of the ONTARGET (Ongoing Telmisartan Alone and in combination with Ramipril Global End point Trial), TRANSCEND (Telmisartan Randomized Assessment Study in ACE Intolerant participants with cardiovascular Disease), and RENAAL trial (Reduction in End points in Non-Insulin-Dependent Diabetes Mellitus with the Angiotensin-II Antagonist Losartan) showed similar associations.32,33 The sensitivity analysis using the data between the initial decline and 12 months showed a similar linear trend, supporting the hemodynamic relation between renal function and BP. This suggests that we should take the magnitude of the BP decrease and clinical characteristics suggestive of renal hyperfiltration into account when assessing the eGFR decline after initiation or intensification of BP-lowering therapy.
The longitudinal analysis showed that patients with a higher initial decrease in eGFR had a larger decrease in systolic BP, resulting from both a higher initial BP and a larger BP decrease. After 12 months, BP and eGFR differences remained stable across all strata, which may indicate that most changes in BP-lowering medication occurred during this period. During intensive treatment, in participants with an initial >20% eGFR decrease, eGFR partially recovered, in contrast to individuals with a lesser initial decline. This was true both for participants with a further BP decrease and for participants who had higher BP after the initial intensification period. Apart from hemodynamic effects related to BP differences and renal hemodynamic alterations, this can also be attributed to regression to the mean effects and implies that repeated measurements of eGFR are required to adequately determine renal function. Similarly, earlier studies that stratified patients based on their initial decline showed that the renal function improves after the initial decline.33,34
In line with earlier separate analyses of SPRINT and ACCORD, we observed that patients in the pooled cohort with a higher initial eGFR decline are at increased CVD risk and experience more events during follow-up.6,7 However, these studies suggest that the increased risk of CVD is not a consequence of intensive BP-lowering as the effect is independent of treatment allocation. A post hoc analysis of the SOLVD (Studies of Left Ventricular Dysfunction) trial in patients with heart failure with reduced ejection fraction showed that there was no increased risk of death in patients randomized to ACE inhibition compared with placebo when stratified to initial eGFR decline.35 Similarly, post hoc analyses of the AASK (African American Study of Kidney Disease and Hypertension) and MDRD trials (Modification of Diet in Renal Disease) in patients with CKD showed that an initial decline in renal function is associated with an increased risk for end-stage renal disease and mortality in patients with CKD.23,24 However, this association was only significant in the >20% decline strata in the intensive group, while in the standard group, the 5% to 20% stratum was already associated with adverse events. Corroborating these data, a recent post hoc analysis of the ADVANCE trial (Action in Diabetes and Vascular Disease: Preterax and Diamicron Modified Release Controlled Evaluation) showed that the creatinine increase during the run-in phase was associated with an elevated cardiovascular risk but did not influence the effect of treatment on cardiovascular events.36 Our analysis extends these findings by showing that the initial eGFR decline has no effect on the steepness of the eGFR slope during follow-up. Annual eGFR decline is considered an important surrogate renal end point, emphasized by a recent meta-analysis of observational studies including 3 758 551 participants, which shows a clear association between a higher annual eGFR slope and an increased risk of end-stage kidney disease.14 As there were no significant renal events in SPRINT, we could not assess whether the initial decrease in eGFR was associated with an increased incidence of end-stage kidney disease. However, we do show that the observed decrease in eGFR is not associated with a faster decline in renal function during follow-up. This suggests, in addition to earlier results on cardiovascular outcomes in SPRINT and ACCORD, that an initial decrease in eGFR can generally be accepted with respect to renal outcomes. In our analysis, we found that a greater initial eGFR decline was associated with a lower annual eGFR slope during intensive BP-lowering therapy, especially in patients with diabetes mellitus. Here, a >20% initial decline in eGFR resulted in a significantly lower annual eGFR decline compared with the other strata. A similar, but nonsignificant trend was seen in the SPRINT and in the pooled cohort. This is line with earlier results by Apperloo et al2 showing that patients with hypertension and a larger initial decline in GFR had a lower slope during follow-up and had a better GFR after cessation of BP-lowering therapy.
Strengths of the present post hoc analysis of the SPRINT and ACCORD trial is the large number of patients with different characteristics and at high cardiovascular risk, which were randomized to a real-world intervention, consisting of treatment based on the clinician’s discretion to a predefined treatment BP target. Using the randomization, we were able to analyze differences between treatment targets in the observed time course of renal function. Limitations are the use of eGFR, the possible influence of incident cardiovascular events, and the requirement to merge the eGFR measurements at 3 months in SPRINT with eGFR at 4 months in ACCORD. However, separate subgroup analysis of SPRINT and ACCORD showed similar outcomes with respect to the steepness of the eGFR slope. The sensitivity analysis showed that the occurrence of cardiovascular events did not alter our findings. As the protocol did not mandate a specific choice of medication, it was not possible to draw conclusion whether the observations resulted from a specific class of BP-lowering drugs; however, most of the patients in the intensive group used an ACE-inhibitor or angiotensin receptor blocker throughout the trial. As the overall risk of end-stage kidney disease was low in both studies, we used eGFR slope as outcome for the present post hoc analysis. Although being limited by individual variability, eGFR slope is considered a reliable surrogate for kidney damage and can be determined for every participant, significantly increasing the power to demonstrate subtle effects on kidney function in time.37
In conclusion, we have shown that in patients at high cardiovascular risk after starting or intensifying BP-lowering treatment, an initial eGFR decrease between 26% to 46% can be considered normal depending on the magnitude of the decrease in BP. We further show that an initial eGFR decline in patients receiving intensive and standard BP-lowering treatment was not associated with subsequent increased renal function decline.
Perspectives
Our post hoc analysis of SPRINT and ACCORD-BP shows that the initial eGFR decrease following BP-lowering treatment is not associated with renal function decline during follow-up and is strongly dependent on the difference in BP. Earlier studies have shown that the initial eGFR decline is associated with an increased cardiovascular risk but suggest that this is not a consequence of antihypertensive therapy. Our results support that an initial eGFR decline up to 20% can be accepted and suggest that the limit can be extended to 46 mm Hg depending on the effects of BP-lowering treatment. Therefore, decisions regarding tapering of BP-lowering therapy after an initial eGFR decline should be made taking multiple measures of renal function and the achieved BP reduction into account. Further research could assess if the relation between initial eGFR decrease and renal function decline is different in patients with CKD or renovascular disease.
Acknowledgments
The ACCORD, SPRINT, and NHBLI investigators are acknowledged for conducting the trials and publishing the datasets.
Sources of Funding
NHBLI sponsored the SPRINT and ACCORD trials with cosponsorship by the National Institute of Diabetes and Digestive and Kidney Diseases, the National Institute of Neurological Disorders and Stroke, and the National Institute on Aging. The authors did not receive any funding for this analysis.
Disclosures
None.
Supplementary Material
Footnotes
The Data Supplement is available with this article at https://www.ahajournals.org/doi/suppl/10.1161/HYPERTENSIONAHA.119.14659.
Novelty and Significance
What Is New?
In high-risk diabetic and nondiabetic patients with hypertension, we show that the initial decrease in estimated glomerular filtration rate (eGFR) following blood pressure (BP) lowering is strongly dependent on the BP decrease and is not associated with subsequent larger annual eGFR decline.
What Is Relevant?
There is a debate to which extend an initial eGFR decrease following BP lowering can be accepted and whether it is causally related to adverse clinical outcomes.
Summary
This post hoc analysis of SPRINT (Systolic Blood Pressure Intervention Trial) and ACCORD-BP (Action to Control Cardiovascular Risk in Diabetes-Blood Pressure) shows that an eGFR decrease of 26% can be considered normal after a 10 mm Hg decrease in mean arterial pressure and with an additional eGFR reduction of 3.4% for every 10 mm Hg lower mean arterial pressure.
The initial eGFR decline was not associated with larger annual eGFR decline during a mean follow-up of 3.2 year.
References
- 1.Bakris GL, Weir MR. Angiotensin-converting enzyme inhibitor-associated elevations in serum creatinine: is this a cause for concern? Arch Intern Med. 2000;160:685–693. doi: 10.1001/archinte.160.5.685. doi: 10.1001/archinte.160.5.685. [DOI] [PubMed] [Google Scholar]
- 2.Apperloo AJ, de Zeeuw D, de Jong PE. A short-term antihypertensive treatment-induced fall in glomerular filtration rate predicts long-term stability of renal function. Kidney Int. 1997;51:793–797. doi: 10.1038/ki.1997.111. doi: 10.1038/ki.1997.111. [DOI] [PubMed] [Google Scholar]
- 3.Williams B, Mancia G, Spiering W, Agabiti Rosei E, Azizi M, Burnier M, Clement DL, Coca A, de Simone G, Dominiczak A, et al. ESC Scientific Document Group. 2018 ESC/ESH Guidelines for the management of arterial hypertension. Eur Heart J. 2018;39:3021–3104. doi: 10.1093/eurheartj/ehy339. doi: 10.1093/eurheartj/ehy339. [DOI] [PubMed] [Google Scholar]
- 4.Whelton PK, Carey RM, Aronow WS, Casey DE, Jr, Collins KJ, Dennison Himmelfarb C, DePalma SM, Gidding S, Jamerson KA, Jones DW, et al. 2017 ACC/AHA/AAPA/ABC/ACPM/AGS/APhA/ASH/ASPC/NMA/PCNA guideline for the prevention, detection, evaluation, and management of high blood pressure in adults: a report of the American College of Cardiology/American Heart Association task force on clinical practice guidelines. Hypertension. 2018;71:e13–e115. doi: 10.1161/HYP.0000000000000065. doi: 10.1161/HYP.0000000000000065. [DOI] [PubMed] [Google Scholar]
- 5.Kidney Disease: Improving Global Outcomes (KDIGO) Blood Pressure Work Group. KDIGO clinical practice guideline for the management of blood pressure in chronic kidney disease. Kidney Int Suppl. 2012;2:337–414. [Google Scholar]
- 6.Collard D, Brouwer TF, Peters RJG, Vogt L, van den Born BH. Creatinine rise during blood pressure therapy and the risk of adverse clinical outcomes in patients with type 2 diabetes mellitus. Hypertension. 2018;72:1337–1344. doi: 10.1161/HYPERTENSIONAHA.118.11944. doi: 10.1161/HYPERTENSIONAHA.118.11944. [DOI] [PubMed] [Google Scholar]
- 7.Beddhu S, Shen J, Cheung AK, Kimmel PL, Chertow GM, Wei G, Boucher RE, Chonchol M, Arman F, Campbell RC, et al. Implications of early decline in eGFR due to intensive BP control for cardiovascular outcomes in SPRINT. J Am Soc Nephrol. 2019;30:1523–1533. doi: 10.1681/ASN.2018121261. doi: 10.1681/ASN.2018121261. [DOI] [PMC free article] [PubMed] [Google Scholar]
- 8.Fu EL, Trevisan M, Clase CM, Evans M, Lindholm B, Rotmans JI, van Diepen M, Dekker FW, Carrero JJ. Association of acute increases in plasma creatinine after renin-angiotensin blockade with subsequent outcomes. Clin J Am Soc Nephrol. 2019;14:1336–1345. doi: 10.2215/CJN.03060319. doi: 10.2215/CJN.03060319. [DOI] [PMC free article] [PubMed] [Google Scholar]
- 9.Anderson AH, Yang W, Townsend RR, Pan Q, Chertow GM, Kusek JW, Charleston J, He J, Kallem R, Lash JP, et al. Chronic Renal Insufficiency Cohort Study Investigators. Time-updated systolic blood pressure and the progression of chronic kidney disease: a cohort study. Ann Intern Med. 2015;162:258–265. doi: 10.7326/M14-0488. doi: 10.7326/M14-0488. [DOI] [PMC free article] [PubMed] [Google Scholar]
- 10.Klag MJ, Whelton PK, Randall BL, Neaton JD, Brancati FL, Ford CE, Shulman NB, Stamler J. Blood pressure and end-stage renal disease in men. N Engl J Med. 1996;334:13–18. doi: 10.1056/NEJM199601043340103. doi: 10.1056/NEJM199601043340103. [DOI] [PubMed] [Google Scholar]
- 11.Lv J, Ehteshami P, Sarnak MJ, Tighiouart H, Jun M, Ninomiya T, Foote C, Rodgers A, Zhang H, Wang H, et al. Effects of intensive blood pressure lowering on the progression of chronic kidney disease: a systematic review and meta-analysis. CMAJ. 2013;185:949–957. doi: 10.1503/cmaj.121468. doi: 10.1503/cmaj.121468. [DOI] [PMC free article] [PubMed] [Google Scholar]
- 12.Lv J, Perkovic V, Foote CV, Craig ME, Craig JC, Strippoli GF. Antihypertensive agents for preventing diabetic kidney disease. Cochrane Database Syst Rev. 2012;12:CD004136. doi: 10.1002/14651858.CD004136.pub3. doi: 10.1002/14651858.CD004136.pub3. [DOI] [PMC free article] [PubMed] [Google Scholar]
- 13.Ettehad D, Emdin CA, Kiran A, Anderson SG, Callender T, Emberson J, Chalmers J, Rodgers A, Rahimi K. Blood pressure lowering for prevention of cardiovascular disease and death: a systematic review and meta-analysis. Lancet. 2016;387:957–967. doi: 10.1016/S0140-6736(15)01225-8. doi: 10.1016/S0140-6736(15)01225-8. [DOI] [PubMed] [Google Scholar]
- 14.Grams ME, Sang Y, Ballew SH, Matsushita K, Astor BC, Carrero JJ, Chang AR, Inker LA, Kenealy T, Kovesdy CP, et al. Evaluating glomerular filtration rate slope as a surrogate end point for ESKD in clinical trials: an individual participant meta-analysis of observational data. J Am Soc Nephrol. 2019;30:1746–1755. doi: 10.1681/ASN.2019010008. doi: 10.1681/ASN.2019010008. [DOI] [PMC free article] [PubMed] [Google Scholar]
- 15.Ambrosius WT, Sink KM, Foy CG, Berlowitz DR, Cheung AK, Cushman WC, Fine LJ, Goff DC, Jr, Johnson KC, Killeen AA, et al. The design and rationale of a multicenter clinical trial comparing two strategies for control of systolic blood pressure: The Systolic Blood Pressure Intervention Trial (SPRINT). Clin Trials. 2014;11:532–546. doi: 10.1177/1740774514537404. doi: 10.1177/1740774514537404. [DOI] [PMC free article] [PubMed] [Google Scholar]
- 16.Cushman WC, Grimm RH, Jr, Cutler JA, Evans GW, Capes S, Corson MA, Sadler LS, Alderman MH, Peterson K, Bertoni A, et al. ACCORD Study Group. Rationale and design for the blood pressure intervention of the Action to Control Cardiovascular Risk in Diabetes (ACCORD) trial. Am J Cardiol. 2007;99(12A):44i–55i. doi: 10.1016/j.amjcard.2007.03.005. doi: 10.1016/j.amjcard.2007.03.005. [DOI] [PubMed] [Google Scholar]
- 17.Beddhu S, Greene T, Boucher R, Cushman WC, Wei G, Stoddard G, Ix JH, Chonchol M, Kramer H, Cheung AK, et al. Intensive systolic blood pressure control and incident chronic kidney disease in people with and without diabetes mellitus: secondary analyses of two randomised controlled trials. Lancet Diabetes Endocrinol. 2018;6:555–563. doi: 10.1016/S2213-8587(18)30099-8. doi: 10.1016/S2213-8587(18)30099-8. [DOI] [PMC free article] [PubMed] [Google Scholar]
- 18.Brouwer TF, Vehmeijer JT, Kalkman DN, Berger WR, van den Born BH, Peters RJ, Knops RE. Intensive blood pressure lowering in patients with and patients without type 2 diabetes: a pooled analysis from two randomized trials. Diabetes Care. 2018;41:1142–1148. doi: 10.2337/dc17-1722. doi: 10.2337/dc17-1722. [DOI] [PubMed] [Google Scholar]
- 19.Cushman WC, Evans GW, Byington RP, Goff DC, Jr, Grimm RH, Jr, Cutler JA, Simons-Morton DG, Basile JN, Corson MA, Probstfield JL, et al. Action to Control Cardiovascular Risk in Diabetes Study Group. Effects of intensive blood pressure control in type 2 diabetes mellitus. N Engl J Med. 2010;362:1575–1585. doi: 10.1056/NEJMoa1001286. doi: 10.1056/NEJMoa1001286. [DOI] [PMC free article] [PubMed] [Google Scholar]
- 20.Wright JT, Williamson JD, Whelton PK, Snyder JK, Sink KM, Rocco MV, Reboussin DM, Rahman M, Oparil S, Lewis CE, et al. A randomized trial of intensive versus standard blood-pressure control. N Engl J Med. 2015;373:2103–2116. doi: 10.1056/NEJMoa1511939. doi: 10.1056/NEJMoa1511939. [DOI] [PMC free article] [PubMed] [Google Scholar]
- 21.Levey AS, Stevens LA, Schmid CH, Zhang YL, Castro AF, 3rd, Feldman HI, Kusek JW, Eggers P, Van Lente F, Greene T, et al. CKD-EPI (Chronic Kidney Disease Epidemiology Collaboration) A new equation to estimate glomerular filtration rate. Ann Intern Med. 2009;150:604–612. doi: 10.7326/0003-4819-150-9-200905050-00006. doi: 10.7326/0003-4819-150-9-200905050-00006. [DOI] [PMC free article] [PubMed] [Google Scholar]
- 22.Kalkman DN, Brouwer TF, Vehmeijer JT, Berger WR, Knops RE, de Winter RJ, Peters RJ, van den Born BH. J Curve in patients randomly assigned to different systolic blood pressure targets: an experimental approach to an observational paradigm. Circulation. 2017;136:2220–2229. doi: 10.1161/CIRCULATIONAHA.117.030342. doi: 10.1161/CIRCULATIONAHA.117.030342. [DOI] [PubMed] [Google Scholar]
- 23.Ku E, Bakris G, Johansen KL, Lin F, Sarnak MJ, Campese VM, Jamerson K, Gassman JJ, Smogorzewski M, Hsu CY. Acute declines in renal function during intensive BP lowering: implications for future ESRD Risk. J Am Soc Nephrol. 2017;28:2794–2801. doi: 10.1681/ASN.2017010040. doi: 10.1681/ASN.2017010040. [DOI] [PMC free article] [PubMed] [Google Scholar]
- 24.Ku E, Ix JH, Jamerson K, et al. Acute declines in renal function during intensive BP lowering and long-term risk of death. J Am Soc Nephrol. 2018;29:2401–2408. doi: 10.1681/ASN.2018040365. doi: 10.1681/ASN.2018040365. [DOI] [PMC free article] [PubMed] [Google Scholar]
- 25.D’Agostino RB, Sr, Vasan RS, Pencina MJ, Wolf PA, Cobain M, Massaro JM, Kannel WB. General cardiovascular risk profile for use in primary care: the Framingham Heart Study. Circulation. 2008;117:743–753. doi: 10.1161/CIRCULATIONAHA.107.699579. doi: 10.1161/CIRCULATIONAHA.107.699579. [DOI] [PubMed] [Google Scholar]
- 26.KDIGO CKD Workgroup. KDIGO 2012 clinical practice guideline for the evaluation and management of chronic kidney disease. Kidney Int Suppl. 2013;3:4–4. doi: 10.1038/ki.2013.243. [DOI] [PubMed] [Google Scholar]
- 27.Bos WJ, Verrij E, Vincent HH, Westerhof BE, Parati G, van Montfrans GA. How to assess mean blood pressure properly at the brachial artery level. J Hypertens. 2007;25:751–755. doi: 10.1097/HJH.0b013e32803fb621. doi: 10.1097/HJH.0b013e32803fb621. [DOI] [PubMed] [Google Scholar]
- 28.Carlström M, Wilcox CS, Arendshorst WJ. Renal autoregulation in health and disease. Physiol Rev. 2015;95:405–511. doi: 10.1152/physrev.00042.2012. doi: 10.1152/physrev.00042.2012. [DOI] [PMC free article] [PubMed] [Google Scholar]
- 29.Safar ME, London GM, Plante GE. Arterial stiffness and kidney function. Hypertension. 2004;43:163–168. doi: 10.1161/01.HYP.0000114571.75762.b0. doi: 10.1161/01.HYP.0000114571.75762.b0. [DOI] [PubMed] [Google Scholar]
- 30.Tonneijck L, Muskiet MH, Smits MM, van Bommel EJ, Heerspink HJ, van Raalte DH, Joles JA. Glomerular hyperfiltration in diabetes: mechanisms, clinical significance, and treatment. J Am Soc Nephrol. 2017;28:1023–1039. doi: 10.1681/ASN.2016060666. doi: 10.1681/ASN.2016060666. [DOI] [PMC free article] [PubMed] [Google Scholar]
- 31.Palatini P. Glomerular hyperfiltration: a marker of early renal damage in pre-diabetes and pre-hypertension. Nephrol Dial Transplant. 2012;27:1708–1714. doi: 10.1093/ndt/gfs037. doi: 10.1093/ndt/gfs037. [DOI] [PubMed] [Google Scholar]
- 32.Clase CM, Barzilay J, Gao P, Smyth A, Schmieder RE, Tobe S, Teo KK, Yusuf S, Mann JF. Acute change in glomerular filtration rate with inhibition of the renin-angiotensin system does not predict subsequent renal and cardiovascular outcomes. Kidney Int. 2017;91:683–690. doi: 10.1016/j.kint.2016.09.038. doi: 10.1016/j.kint.2016.09.038. [DOI] [PubMed] [Google Scholar]
- 33.Holtkamp FA, de Zeeuw D, Thomas MC, Cooper ME, de Graeff PA, Hillege HJ, Parving HH, Brenner BM, Shahinfar S, Lambers Heerspink HJ. An acute fall in estimated glomerular filtration rate during treatment with losartan predicts a slower decrease in long-term renal function. Kidney Int. 2011;80:282–287. doi: 10.1038/ki.2011.79. doi: 10.1038/ki.2011.79. [DOI] [PubMed] [Google Scholar]
- 34.Hirsch S, Hirsch J, Bhatt U, Rovin BH. Tolerating increases in the serum creatinine following aggressive treatment of chronic kidney disease, hypertension and proteinuria: pre-renal success. Am J Nephrol. 2012;36:430–437. doi: 10.1159/000343453. doi: 10.1159/000343453. [DOI] [PubMed] [Google Scholar]
- 35.McCallum W, Tighiouart H, Ku E, Salem D, Sarnak MJ. Acute declines in estimated glomerular filtration rate on enalapril and mortality and cardiovascular outcomes in patients with heart failure with reduced ejection fraction. Kidney Int. 2019;96:1185–1194. doi: 10.1016/j.kint.2019.05.019. doi: 10.1016/j.kint.2019.05.019. [DOI] [PMC free article] [PubMed] [Google Scholar]
- 36.Ohkuma T, Jun M, Rodgers A, Cooper ME, Glasziou P, Hamet P, Harrap S, Mancia G, Marre M, Neal B, et al. ADVANCE Collaborative Group. Acute increases in serum creatinine after starting angiotensin-converting enzyme inhibitor-based therapy and effects of its continuation on major clinical outcomes in type 2 diabetes mellitus. Hypertension. 2019;73:84–91. doi: 10.1161/HYPERTENSIONAHA.118.12060. doi: 10.1161/HYPERTENSIONAHA.118.12060. [DOI] [PubMed] [Google Scholar]
- 37.Greene T, Ying J, Vonesh EF, Tighiouart H, Levey AS, Coresh J, Herrick JS, Imai E, Jafar TH, Maes BD, et al. Performance of GFR slope as a surrogate end point for kidney disease progression in clinical trials: a statistical simulation. J Am Soc Nephrol. 2019;30:1756–1769. doi: 10.1681/ASN.2019010009. doi: 10.1681/ASN.2019010009. [DOI] [PMC free article] [PubMed] [Google Scholar]
Associated Data
This section collects any data citations, data availability statements, or supplementary materials included in this article.