Abstract
Many potential chemotherapeutics fail to reach patients. One of the key reasons is that compounds are tested during the drug discovery stage in two-dimensional (2D) cell cultures, which are often unable to accurately model in vivo outcomes. Three-dimensional (3D) in vitro tumor models are more predictive of chemotherapeutic effectiveness than 2D cultures, and thus, their implementation during the drug screening stage has the potential to more accurately evaluate compounds earlier, saving both time and money. Paper-based cultures (PBCs) are an emerging 3D culture platform in which cells suspended in Matrigel are seeded into paper scaffolds and cultured to generate a tissue-like environment. In this study, we demonstrate the potential of matrix-assisted laser desorption/ionization–mass spectrometry imaging with PBCs (MALDI-MSI-PBC) as a drug screening platform. This method discriminated regions of the PBCs with and without cells and/or drugs, indicating that coupling PBCs with MALDI-MSI has the potential to develop rapid, large-scale, and parallel mass spectrometric drug screens.
Graphical Abstract
Despite substantial efforts to improve therapeutic options for patients, few novel drugs are introduced to the market each year. Drugs that transition past the discovery phase have an 84% chance of failure in either preclinical or clinical studies.1 Part of this failure rate is caused by the reliance of in vitro drug discovery research on two-dimensional (2D) cell cultures. 2D cultures are easy to use and evaluate but fail to recapitulate the complexity of in vivo tissue.2 In three-dimensional (3D) cell culture systems, cells more accurately represent tissues than cells in 2D culture environments,3,4 thus making them a valuable tool for the evaluation of pharmaceuticals.5–7 Examples of 3D cell culture systems include organoids,8 spheroids,9 organ-on-chip devices,10 cells grown in Matrigel,11–14 and paper-based cultures (PBCs).15,16
PBCs are easy to assemble and compatible with a wide range of cell types.15,17–22 In PBCs, cells suspended in Matrigel that mimics the native extracellular matrix are seeded in zones on individual sheets of paper. Wax-printed barriers surround each discrete zone to prevent chemical communication between adjacent cultures. PBCs have been previously analyzed with a variety of methods.22 For example, live cells have been analyzed directly in the paper scaffold with microscopy, and their contents have been analyzed after lysis with common molecular biology techniques.17,20,21,23–25 While all of these techniques are capable of evaluating cellular responses to drugs, none used thus far are capable of quantifying drug metabolism.
There is a need for a streamlined method to quantify cellular responses to drugs in PBCs as well as the concentrations of these drugs and their metabolites. In spheroids and tissue slices, fluorescence microscopy and autoradiography have been used to map drug distributions.26,27 Single-cell metabolite studies using Förster resonance energy transfer (FRET) have indirectly quantified small-molecule metabolites.28,29 Nuclear magnetic resonance (NMR)-based techniques have provided a platform to study intact tissue, organs, and other solid materials.30 Vibrational spectroscopy such as Raman microscopy has been used to distinguish certain metabolites that contain vibrationally active chemical bonds and provide subcellular spatial resolution.31,32
Optical techniques and autoradiography, such as scintillation counting,33 have also been utilized. These approaches require spectroscopically unique functional groups, fluorescence labels, or radioisotopes. Additionally, the use of labels in fluorescence studies can potentially affect the kinetics of diffusion, partitioning into the cell, and metabolism of the drug. Drugs that are intrinsically fluorescent can also be problematic as they can be affected by fluorescence quenching. While the fluorescent drug distribution can be assessed, other non-fluorescent species such as metabolites cannot be simultaneously analyzed. FRET biosensors can provide good sensitivity, but the fluorescence can often be perturbed by changes in the microenvironment (e.g., pH, temperature, chemical property of the solvent).34 NMR spectroscopy, although inherently quantitative, still lacks the sensitivity that mass spectrometry routinely provides. Finally, Raman microscopy can generate spectra from the sample that are highly spectroscopically active and thus lead to having complex spectra that renders them less suitable for multiplex analyses.35
None of the methods mentioned above for the quantitative evaluation of drug concentrations have been applied to PBCs. For this platform to be effective in drug development studies, the analytical methodology must not only be quantitative but also be capable of assessing drug distribution and metabolism in a spatially defined manner. A discovery measurement approach that determines the distribution of several analytes simultaneously would also be advantageous, as many diseases are treated with combination chemotherapy regimens. For example, the folinic acid(leucovorin)/5-fluorouracil/irinotecan (FOLFIRI) or folinic acid/5-fluorouracil/oxaliplatin (FOL-FOX) combination therapies are commonly used to treat colorectal cancer.36
Matrix-assisted laser desorption/ionization–mass spectrometry (MALDI-MS) is an ideal platform for visualizing biomolecules in situ without the need for labeling. It is capable of rapid and multiplex analyses of drugs and their metabolites. The technique is widely used to analyze tissue sections37–40 and has been applied to examine 3D cell cultures, including organoids41 and the spheroid model system.42–51 Advanced data informatics platforms have emerged to aid in mining the large amounts of data generated by a single mass spectrometry imaging experiment.52 Additional bioinformatic solutions such as correlating spatially colocalized images have also proved useful to identify potential biomarkers based on their spatial components.53–55
There has only been one report of mass spectrometry directly from a PBC.56 In this manuscript, Chen et al. used paper spray ionization to quantify cyclophosphamide (CPA) from PBCs containing human liver carcinoma cells (HepG2).56 Although this method is capable of detecting drug molecules from PBCs, spatial localization is lost as the CPA molecules were eluted from the polycarbonate paper scaffolds with isopropanol. This method is also lower throughput, as each paper scaffold must be individually coupled to a voltage source and analyzed. The current study expands on the work of Chen et al.56 and includes the successful detection of the drugs irinotecan and doxorubicin from PBCs by MALDI-mass spectrometry imaging (MSI). We also demonstrate that MALDI-MSI can easily discriminate among the different regions of the PBCs: discrete zones containing cells suspended in a Matrigel; zones containing Matrigel alone; or the wax barrier regions that separate each zone. These initial experiments provide the framework needed to establish a high-throughput MALDI-MSI-PBC drug screening platform.
EXPERIMENTAL SECTION
Cell Culture.
The colon carcinoma cell line HCT 116 (ATCC, Manassas, VA) was maintained in McCoy’s 5A cell culture medium (Corning, Manassas, VA) supplemented with 10% fetal bovine serum (FBS), 1% l-glutamine, 25 mM HEPES, and 1% penicillin–streptomycin. All cell culture supplements were Gibco (Life Technology, Grand Island, NY) except for FBS (VWR, Radnor, PA). Cells were maintained as monolayers at 5% CO2 and 37 °C; the medium was exchanged approximately every 48 h, and the cells were passaged at 80% confluency. Cell lines were used within 15 passages or 3 months after resuscitation of frozen aliquots from liquid nitrogen. The cells were verified by Short Tandem Repeat (STR) sequenci006Eg in 2016.
Paper Scaffold Preparation.
Wax-patterned paper scaffolds were prepared as described previously.17,57 Briefly, sheets of 40 μm-thick Whatman 105 lens paper were wax-patterned with a commercial printer (Xerox ColorQube 8580) to contain nine 2.85 mm diameter zones surrounded by black wax. Each scaffold was sterilized under ultraviolet light for at least 1 h prior to usage. On each scaffold, five of nine zones were seeded with 84 000 HCT 116 cells suspended in 0.5 μL of Matrigel for a final density of 3.29 × 10⁸ cells/cm3. The remaining four zones were seeded with 0.5 μL of Matrigel. The seeded scaffolds were incubated at 5% CO2 and 37 °C overnight. The scaffolds were individually removed from the medium, placed in a 1.5 mL Eppendorf tube, flash-frozen in liquid nitrogen, and stored at −80 °C. Prior to analysis, the PBC scaffolds were thawed and dried in a vacuum centrifuge for 5 min to remove any moisture. Double-sided copper tape (Electron Microscopy Sciences, Hatfield, PA) was placed on a 384-well MALDI target plate. The PBC scaffold was carefully placed on the tape while avoiding any folds and creases in the paper. To fully secure the PBC scaffold to the target plate, the paper was flattened by rolling a 20 mL scintillation vial over the scaffold. This resulted in a flat surface with no observable damage to the paper itself.
MALDI-MSI Sample Preparation and Data Acquisition.
For the drug imaging experiments, 0.5 μL of 500 μM aqueous solutions of irinotecan (Sigma-Aldrich, St. Louis, MO) and doxorubicin (Sigma-Aldrich, St. Louis, MO) was hand-spotted onto individual zones of PBC scaffolds. For the calibration curve imaging experiments, two methods for applying the internal standard (IS), irinotecan-d10 (Santa Cruz Biotechnology, Dallas, TX), were compared. In the first method, 100 μM IS was spiked into solutions containing various concentrations of irinotecan. These solutions were hand-spotted (0.5 μL) on individual zones. In the second method, paper scaffolds were prespotted with different concentrations of irinotecan. Then, 100 μM IS was applied to the scaffolds by nebulization, using a Model M5 TM-Sprayer (HTX Technologies, Chapel Hill, NC). The IS solution was uniformly applied in four spray passes in a crisscross pattern and using the following device settings: nozzle temperature, 30 °C; pressure, 10 psi; gas flow rate, 3 L/min; nozzle height, 40 mm; IS flow rate, 0.05 mL/min; moving velocity, 1000 mm/min; track spacing, 2 mm; dry time, 30 s.
The MALDI matrix was applied after application of the IS. The MALDI target plate containing the scaffolds was placed in a vacuum desiccator for 15 min before the matrix application. A solution of 2,5-dihydroxybenzoic acid (DHB) (Acros Organics, New Jersey) was dissolved in 50:50 acetonitrile/water with 0.1% trifluoroacetic acid (TFA) to make a final concentration of 10 mg/mL. The matrix solution was filtered through a 0.22 μm filter and applied to the mounted PBCs using a Model M5 TM-Sprayer. The matrix was uniformly applied in eight passes in a crisscross pattern and using the following device settings: nozzle temperature, 70 °C; pressure, 10 psi; gas flow rate, 3 L/min; nozzle height, 40 mm; flow rate, 0.1 mL/min; moving velocity, 1000 mm/min; track spacing, 2 mm; dry time, 30 s.
Before mass spectrometric analysis, the MALDI instrument was calibrated using red phosphorus dissolved in water with a final concentration of 50 mg/mL.58 MALDI-MSI was performed on a Bruker SolariX 15T Fourier transform-ion cyclotron resonance (FTICR) mass spectrometer (Bruker Daltonics, Billerica, MA). Mass spectra were acquired in positive ion mode with 500 laser shots per spot. The raster step was set to 200 μm while the laser focus was set to small. The laser power was set at 30–40% with a sampling frequency of 2 kHz. Mass spectra were acquired in a mass range of 100–1000 m/z. The estimated resolving power for each acquisition was 60 000 at 400 m/z and with a transient length of 0.2097 s. Tandem mass spectrometry (MS/MS) was conducted using collision induced dissociation (CID) with an isolation window of 5.0 m/z, a collision energy between 15 and 19 eV, a collision RF amplitude of 2000.0 V, and an RF frequency of 2 MHz. Images were processed using the SCILS Lab 2016b software package to generate ion maps with a semiquantitative color scale bar that was normalized to total ion count.
Data Analysis and Spatial Segmentation.
Spatial segmentation of paper scaffold imaging data was performed in the SCiLS Lab 2016b software package, using the bisecting k-means clustering algorithm. The segmentation map was generated from a cluster dendrogram, which was further interrogated to discriminate regions in the paper scaffold. MS images of analytes colocalized to specific regions were extracted, using Pearson’s correlation coeffcient between the region-of-interest (ROI) and MS image as a metric for colocalization. This was determined within the SCiLS software package by comparing the shape of an MS image against the specific segmented region.
RESULTS AND DISCUSSION
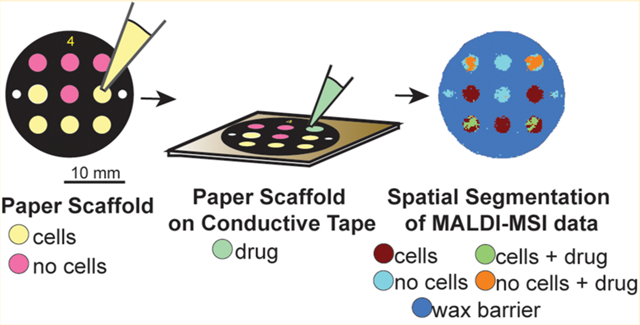
3D cell culture models such as PBCs offer a versatile method of culturing cells for a broad range of studies.59 MALDI-MSI is a promising platform to study drug distribution and metabolism in PBCs and will supplement viability data sets by offering increased chemical information without the need for imaging probes or other labels. Here, we apply MALDI-MSI for analyzing sections of PBCs, with the goal of developing a high-throughput drug screening platform. As a proof-of-principle, we analyzed individual PBC scaffolds containing nine zones, where five were seeded with the HCT 116 human colon cancer cell line suspended in Matrigel and the four remaining zones were loaded with only Matrigel. In each scaffold, two cell-laden zones and two Matrigel-only zones were hand-spotted with a solution containing the cancer therapeutic drugs irinotecan and doxorubicin to determine if the drugs could be ionized and detected in the four zones. We then determined the analytical response for drug detection using irinotecan and compared two methods by applying a deuterated internal standard for quantification. To demonstrate that our MALDI imaging pipeline can handle large data sets, we employed the SCiLS software package to aid in data processing by generating segmentation maps by using the bisecting k-means clustering algorithm. A binary cluster dendrogram was obtained for every analysis, which was further segmented into subclusters associated with regions in the sample. These maps were able to distinguish chemically similar regions on the paper scaffold. The workflow for the imaging experiments is shown in Figure 1.
Figure 1.
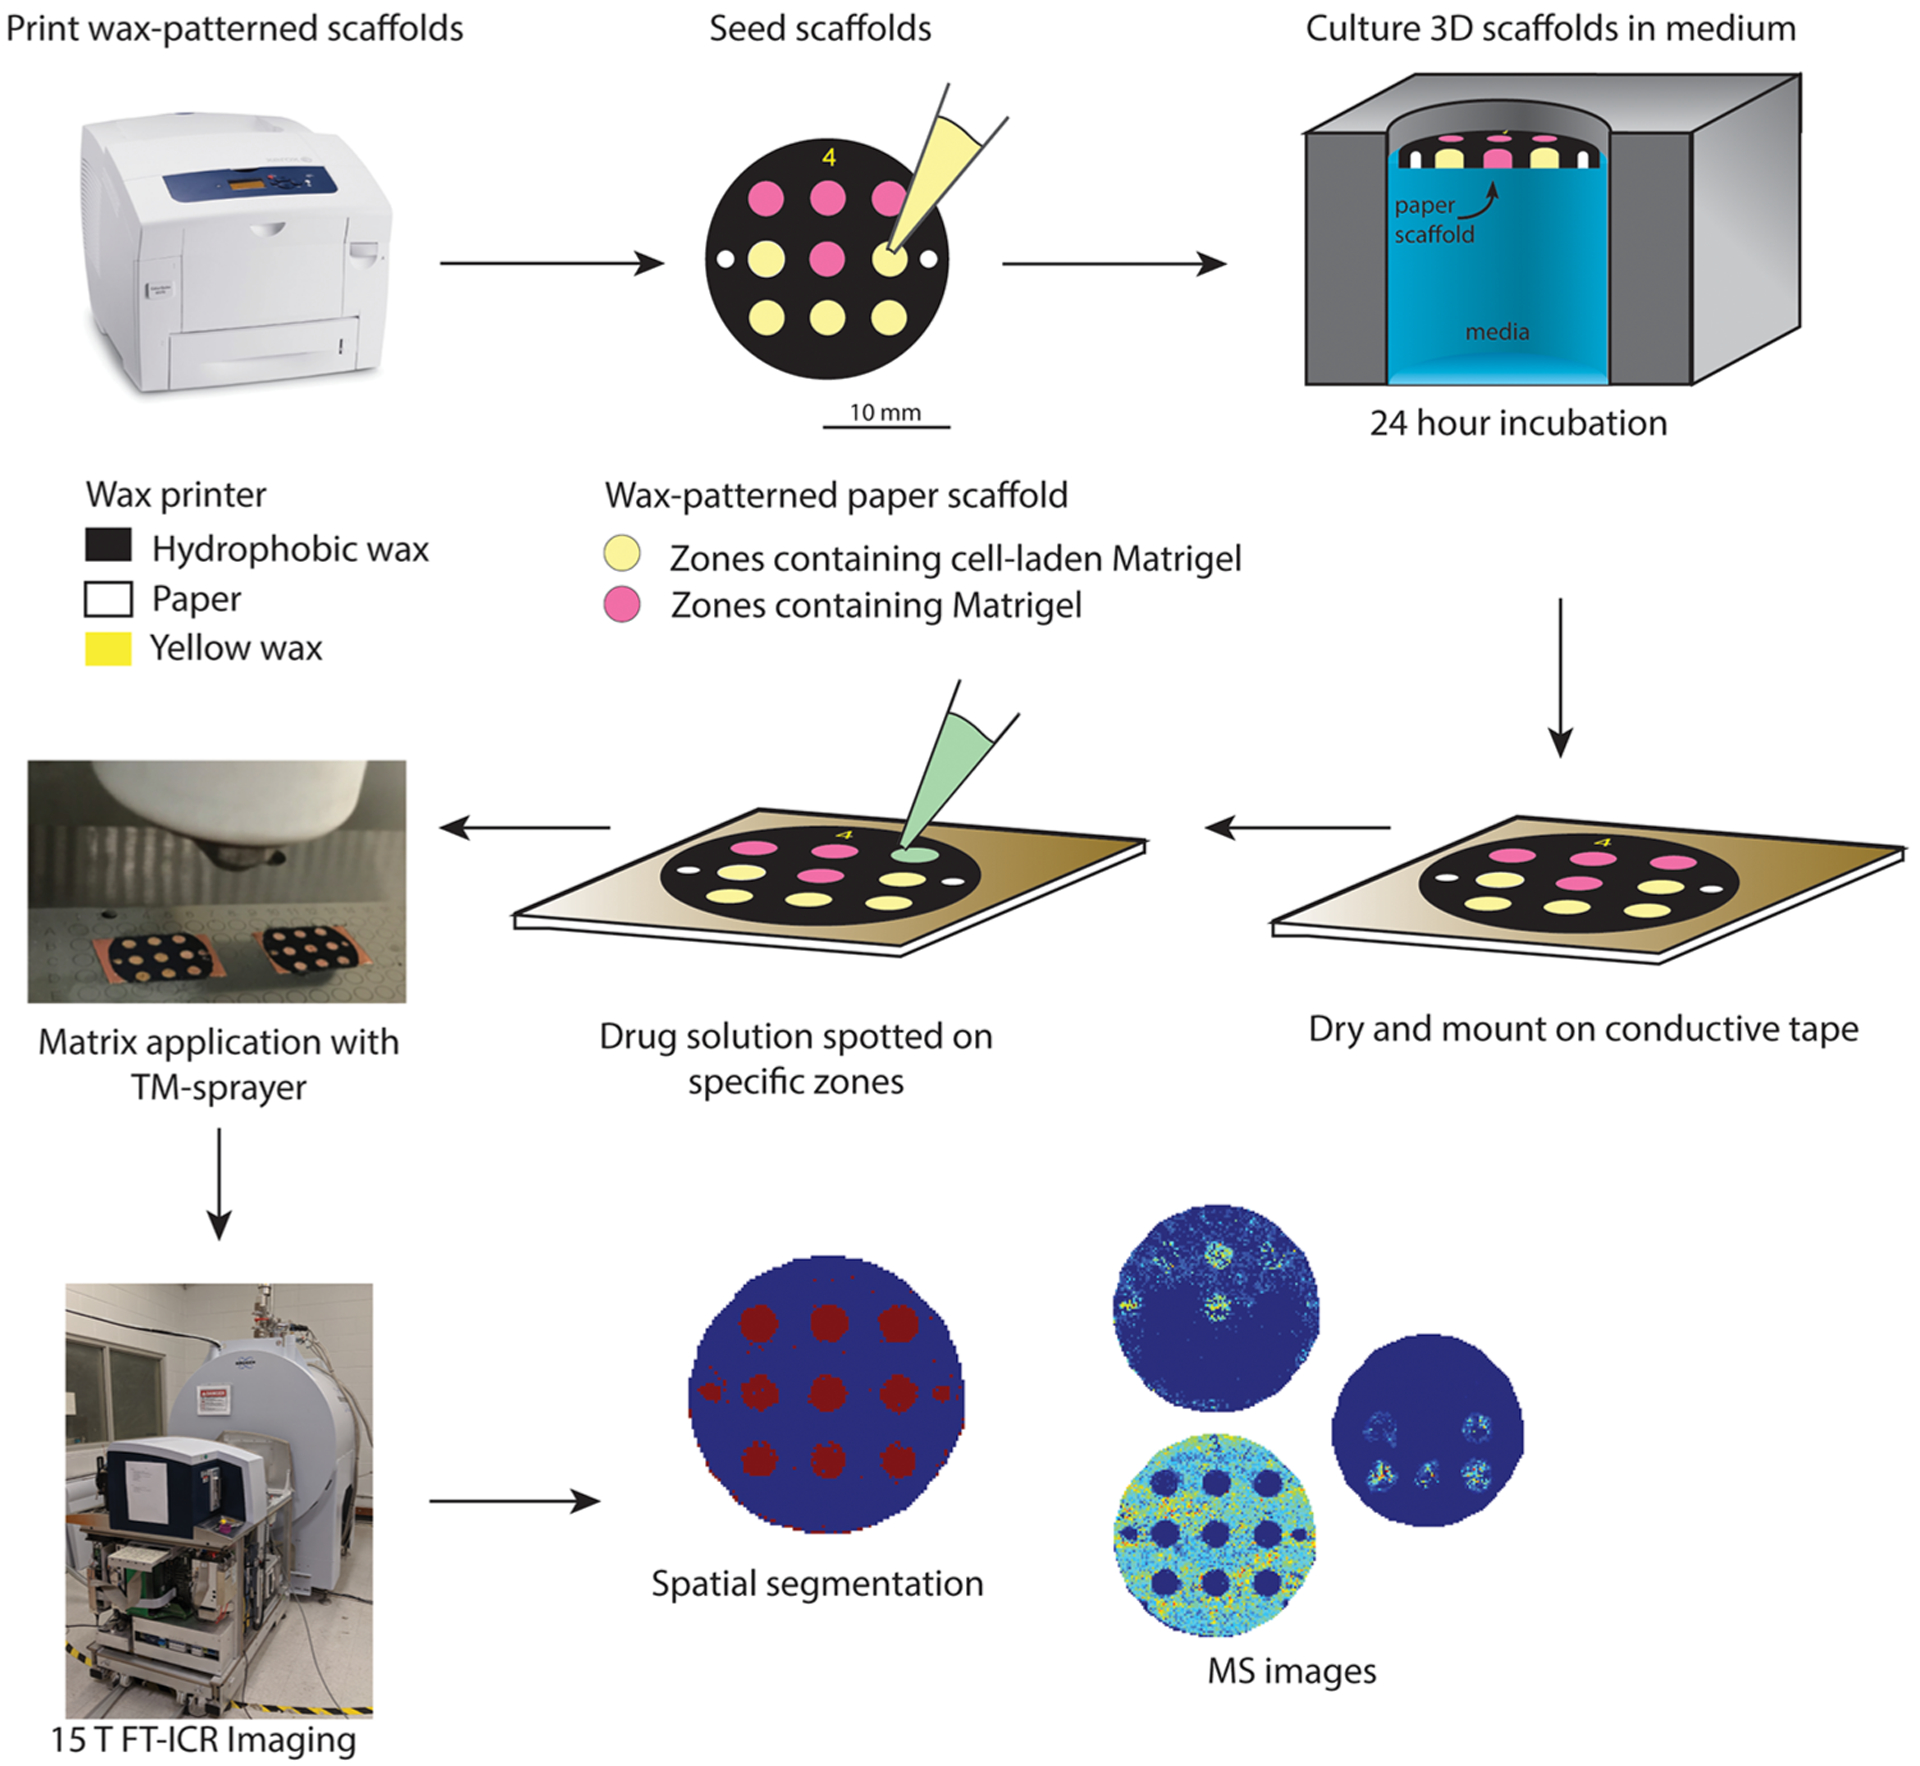
MALDI-MSI-PBC workflow. First, wax patterns were printed onto Whatman 105 lens paper. Next, the zones of the patterned scaffolds were seeded with either cell-laden Matrigel or Matrigel only. After an overnight incubation in culture medium, the scaffolds were dried using a vacuum centrifuge and then mounted onto a MALDI target plate with double-sided conductive tape. Next, the drug solutions were spotted onto selected wells and allowed to redry. Matrix was then applied using a robotic sprayer. Finally, the scaffolds were analyzed with MALDI-MSI to generate the ion density maps.
Spatial Segmentation.
Mass spectrometry imaging data from a single experiment can generate a rich data set that can be difficult to navigate. We chose the bisecting k-means clustering algorithm to analyze the data sets collected across multiple PBCs, each representing a biological replicate, because it has previously been shown to be better suited for comparing multiple images as it is computationally more efficient than conventional hierarchical clustering methods.52,60–64 The analysis of a single PBC resulted in five distinct regions (Figure 2): cell-laden zones, cell-laden zones with a drug, Matrigel-only zones, Matrigel-only zones with a drug, and the wax barriers surrounding the zones. With minimal modification to the automatic segmentation performed by the software, it was possible to visualize differences in each zone, based on their mass spectral profile. This segmentation step can potentially aid in further drug screening studies, spatial localization studies, and enhancement of our subsequent data mining.
Figure 2.
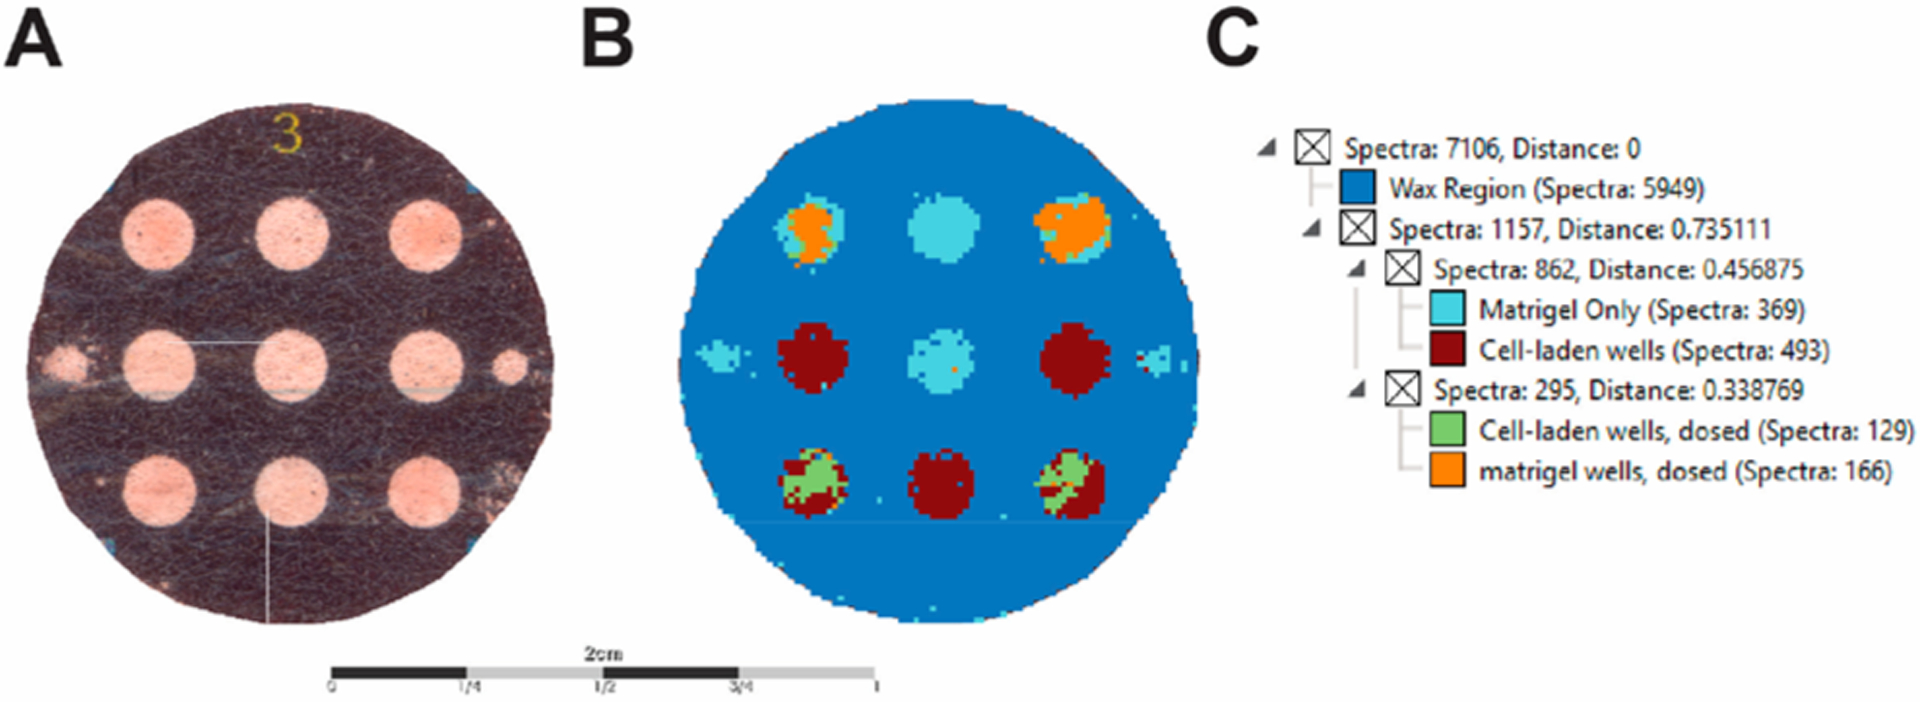
Segmentation map and cluster dendrogram of PBCs. (A) Optical image of the PBC scaffold. (B) Segmentation map of MSI data using the bisecting k-means algorithm. (C) Dendrogram of the correlation distance of subclusters representing distinct regions of the PBC. Note that the algorithm discriminated the dosed wells that contained cells and the wells that only contained Matrigel. Scale bar is 2 cm.
Ionization and Detection of Cancer Therapeutic Drugs.
For targeted drug studies, PBCs were spotted with a drug solution containing both 500 μM irinotecan and doxorubicin after mounting the scaffold onto the conductive tape. The PBC scaffolds were dried on the benchtop, and the matrix was applied using a robotic sprayer. Optimization of matrix concentrations and spraying conditions for the M5 sprayer resulted in the selection of 10 mg/mL DHB, as listed in the Experimental Section.
As shown in Figure 3, irinotecan and doxorubicin were detected with very low mass-to-charge error as the [M + H]+, [M + Na]+, and [M + K]+ species in both the cell-laden and Matrigel-only zones. Upon acquiring the MS imaging data, we noticed a difference in the ionization efficiencies of the [M + H]+ species between the cell-laden and Matrigel-only zones. We hypothesize that the ionization difference results from the composition of each zone type. One type of zone is a uniform composition of Matrigel, while another is a mixture of cells and Matrigel. We presume the drug distributes through the Matrigel with an equal diffusion constant since the composition and density of each Matrigel-only zone are the same. On the other hand, the cell-laden zones are affected by a different diffusion constant due to the presence of cells, as partitioning across the lipid membrane is the rate limiting step for these volumes.
Figure 3.
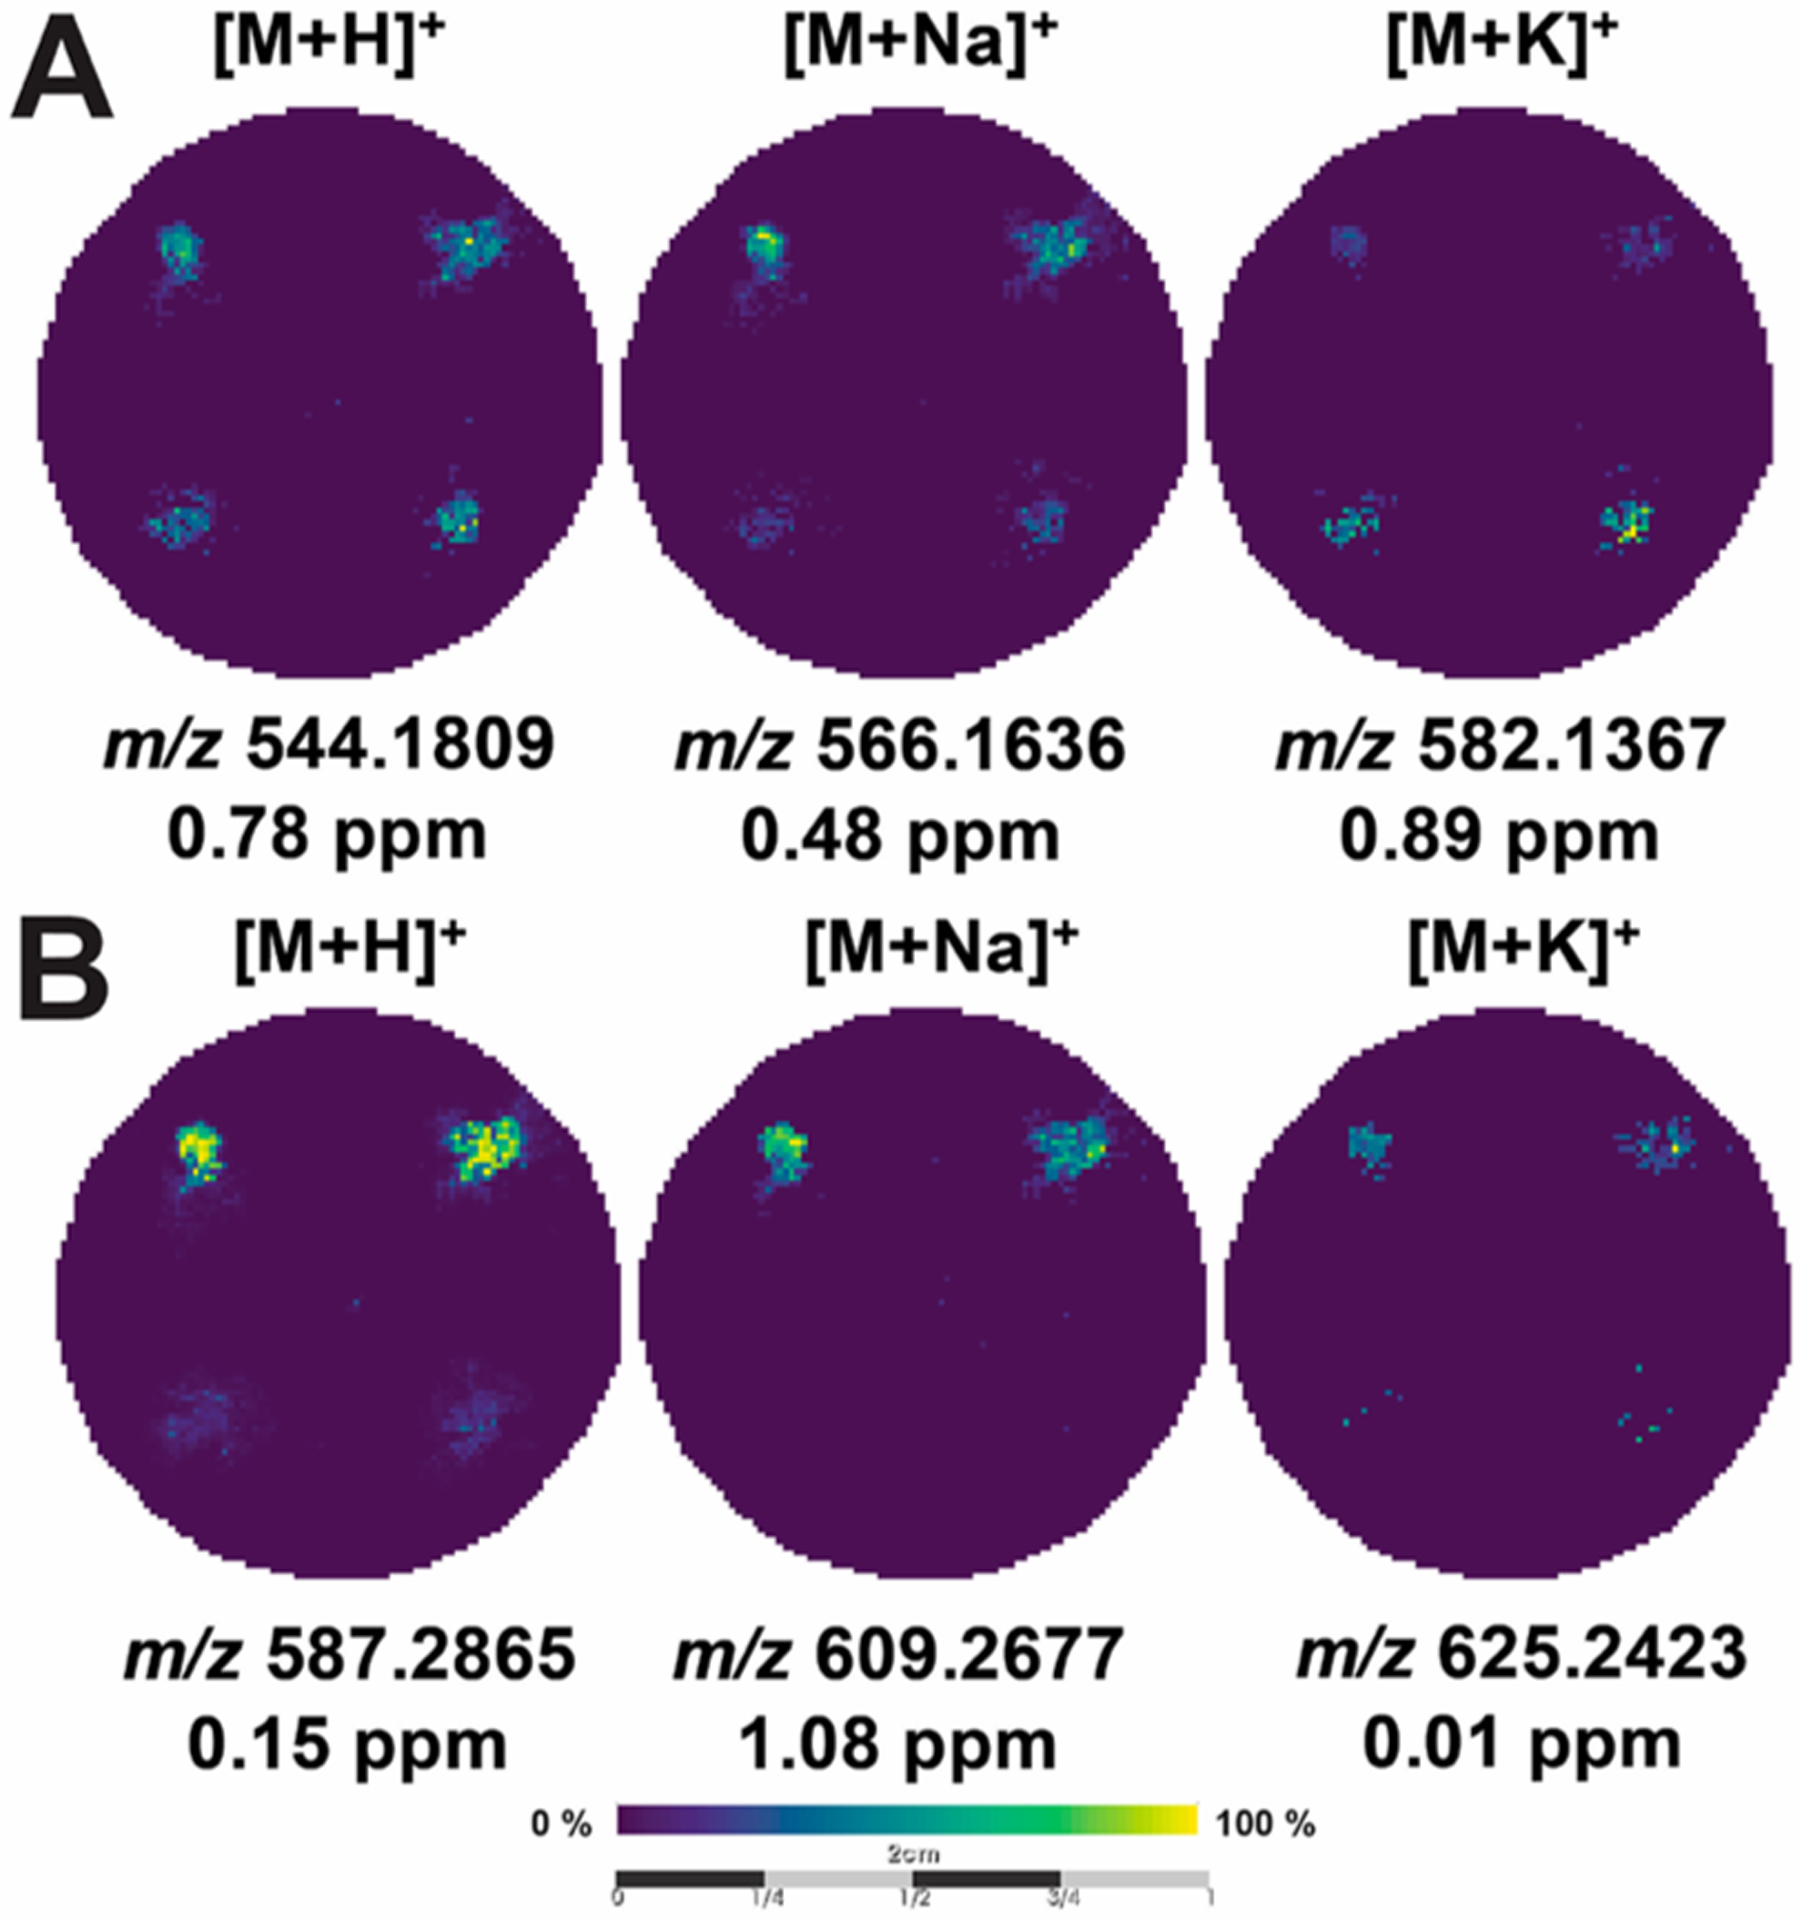
MALDI-MS images of cancer drugs. MALDI-MS images of the same scaffold containing (A) 500 μM doxorubicin and (B) 500 μM irinotecan in Matrigel-only (top corners) and cell-laden (bottom corners) zones. The images are arranged as columns (from left-to-right) for the [M + H]+, [M + Na]+, and [M+K]+ species, along with their respective mass error.
We subsequently tested the analytical signal response of cancer therapeutics using irinotecan. PBCs containing only Matrigel were spotted with nine different concentrations of irinotecan (0.05–50 μM) as shown in Figure 4A. We used PBCs spotted with only Matrigel as we wanted to avoid effects that could arise from slightly different cell densities due to experimental and setup error. We chose these concentrations based on previous MALDI-MSI studies of HCT 116 spheroids dosed with these drugs.42,46 Additionally, a previous MALDI-MSI study on the distribution and quantification of irinotecan on murine liver used a similar concentration range.38
Figure 4.
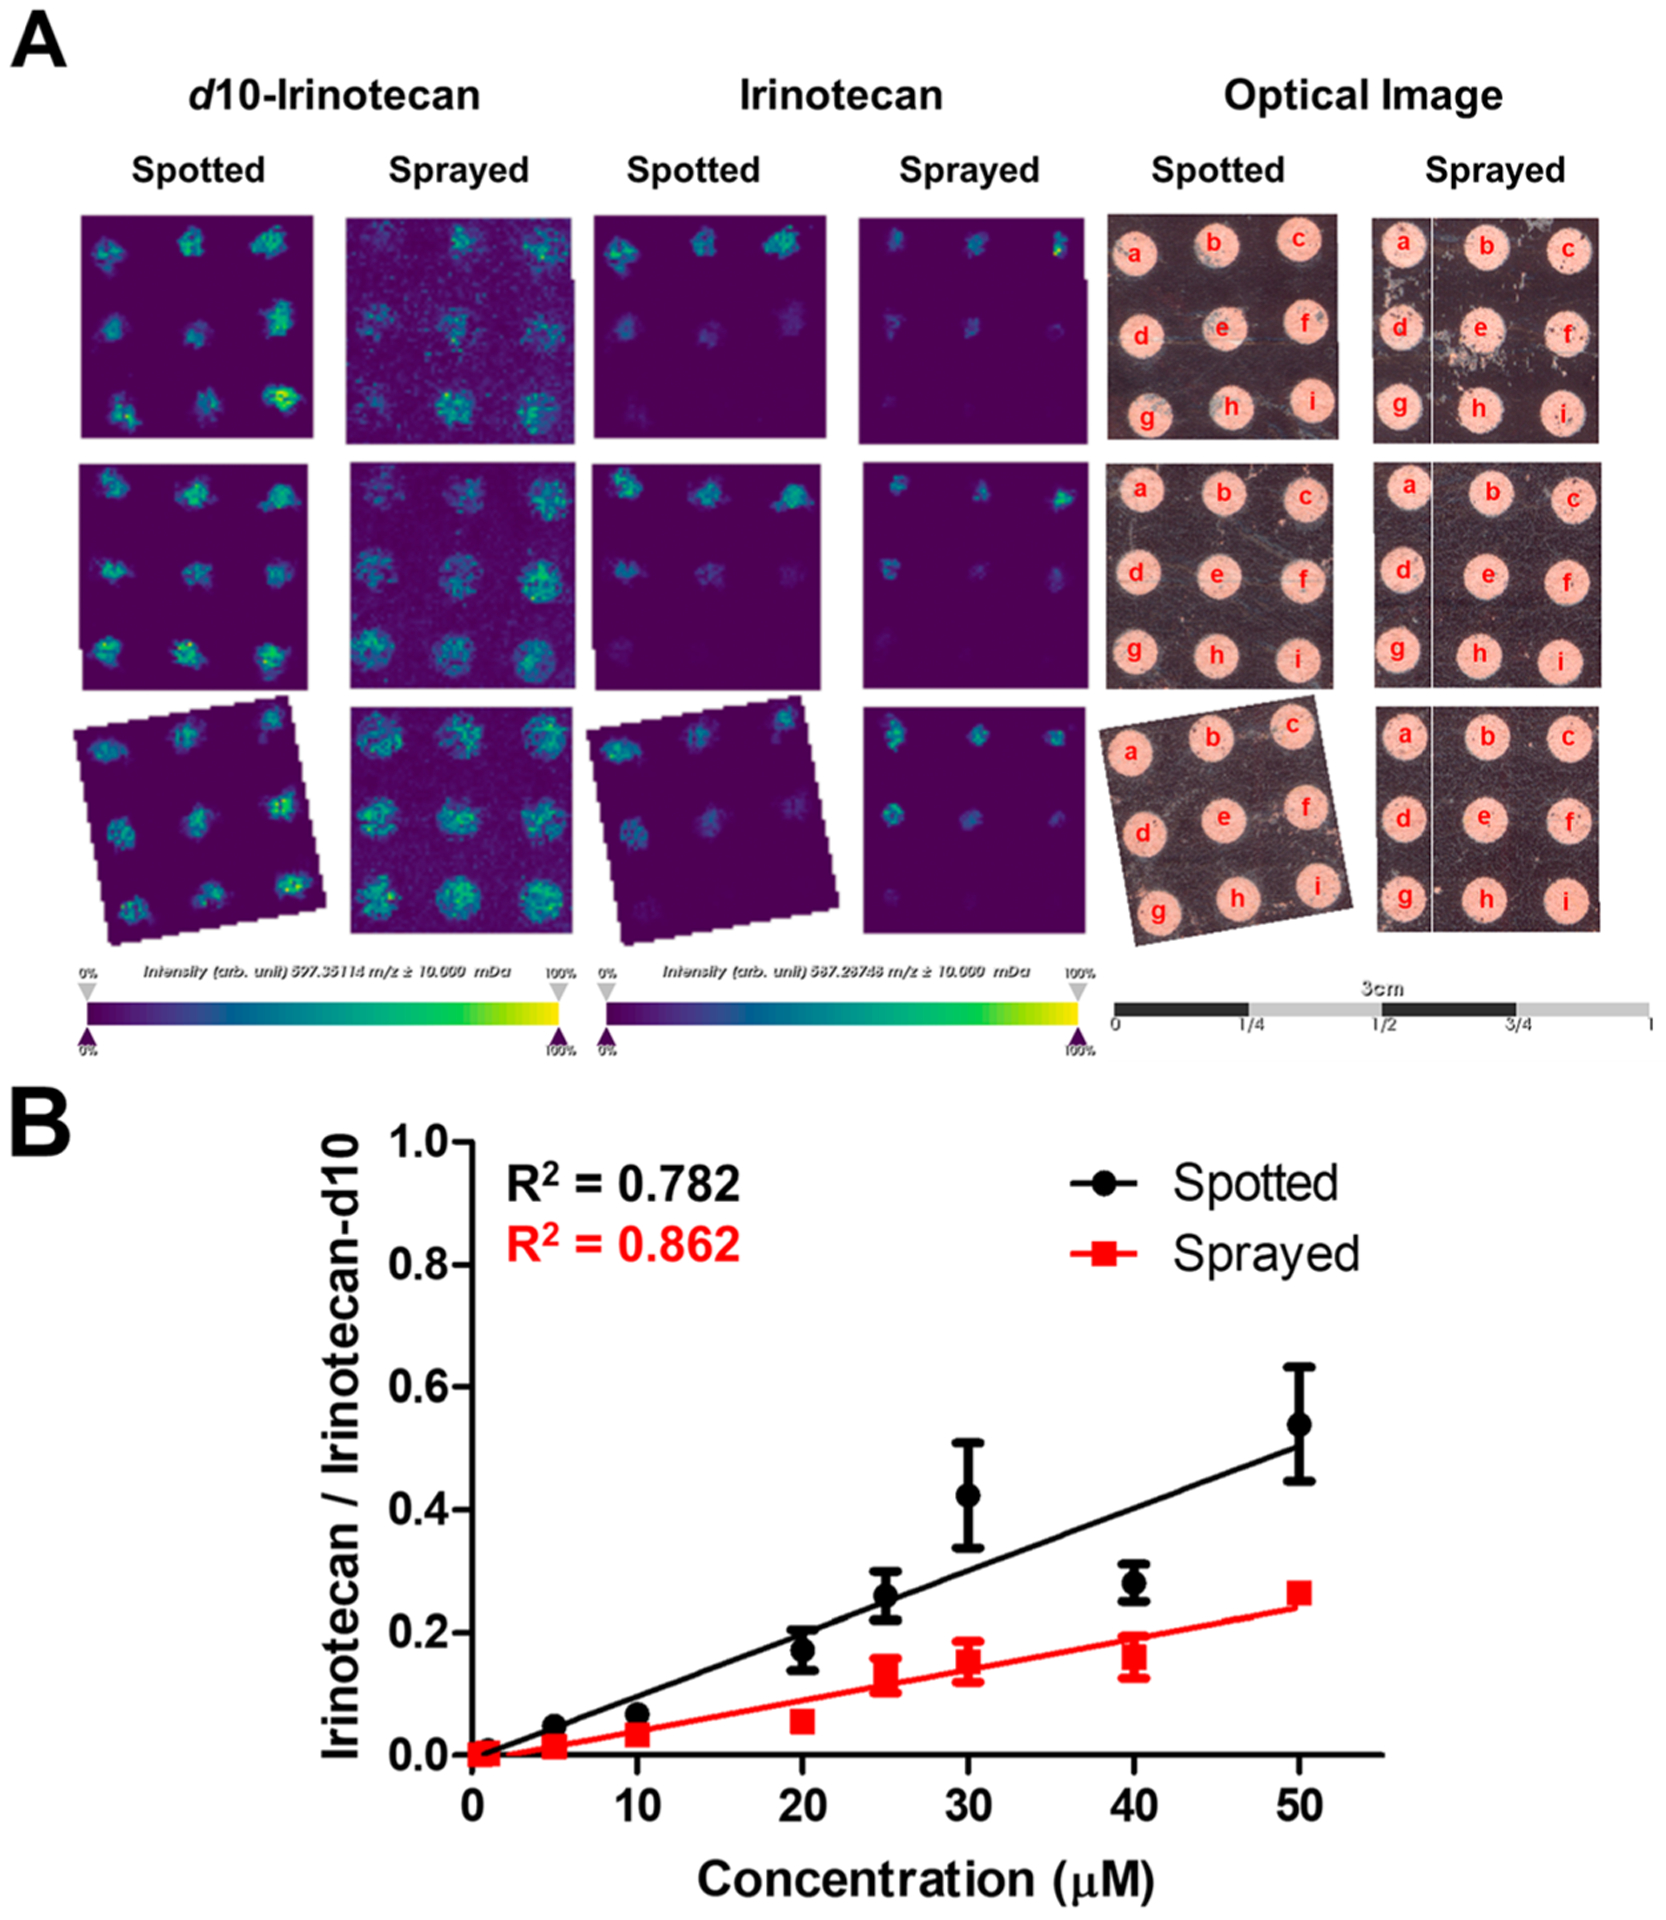
Irinotecan signal response on PBC scaffolds. (A) MALDI-MS images of irinotecan-d10 (m/z 597.3511) spotted and sprayed on PBC scaffolds (n = 3), MALDI-MS images of irinotecan (m/z 587.2875) spotted on PBC scaffolds at different concentrations (a: 50; b: 40; c: 30; d: 25; e: 20; f: 10; g: 5; h: 1; i: 0.05 μM), and the corresponding optical images of the PBC scaffolds after spotting the drug. Scale bar is 3 cm. (B) Calibration curve plotted using the mean signal intensity ratio of the [M + H]+ for irinotecan/irinotecan-d10 of the spotted (black) and sprayed (red) (n = 3, ± SEM).
To correct for signal variability, we applied irinotecan-d10 as an internal standard (IS) using two methods: cospotting the IS with irinotecan directly on each zone and spraying the IS on zones that were prespotted with irinotecan using a robotic matrix sprayer. The calibration curves for both methods are shown in Figure 4B. The mean intensity of irinotecan in each zone was normalized to the mean intensity of the IS. Three scaffolds were prepared and analyzed and were considered as technical replicates for this analysis. The calibration curves suggest a linear response over this concentration range. The spraying method appears to indicate a better linear response than the spotting method, which is likely due to the propagation of error from manually adding a known volume of the IS to each sample and then having to manually spot each solution to each well. The spraying method, on the other hand, provided a uniform and automated application of the IS throughout the PBC scaffold, and thus, any error associated with the addition of an internal standard was minimized. While most of our efforts focused on detecting irinotecan on PBC scaffolds, we also explored the detection of doxorubicin as shown in Figure S3. We have also detected this cancer therapeutic at different concentrations.
Detection of Spatially Localized Molecules.
Following the confirmation of targeted drug molecule ionization from the paper scaffold, we investigated the detection of endogenous molecules from the cell-laden and Matrigel-only zones. The spatial segmentation created the region-of-interest (ROI) that was used to extract the MS images of analytes having a high spatial correlation with the ROI. For example, using the ROI for the cell-laden zones, we were able to create MS images of analytes that spatially localized only in these zones. The colocalization was measured by the correlation between the ROI and the MS image and quantified by their Pearson’s correction coefficient, which considers how the high-intensity regions of the MS image correlate with the ROI. This approach was previously demonstrated in extracting MS images and mapping anatomic regions of rat brain tissue and mouse kidney by MALDI-MSI.52,65
Highly correlated m/z images with the ROI representing the cell-laden or Matrigel-only zones are shown in Figure S1; all images have a Pearson’s correlation coefficient of at least 0.50. Figure 5 illustrates the localization of ions that have been putatively assigned as sphingomyelin (SM) and phosphate-dylcholine (PC) lipids, SM(d34:1), PC(32:0), and PC(34:1) at m/z 725.5562, m/z 754.5338, and m/z 760.5842, respectively. MS/MS spectra (Figure S4) were collected directly on the cell-laden zone for each lipid species and have shown the characteristic fragment ion m/z 184.0, which corresponds to the phosphocholine headgroup. Unfortunately, tandem mass spectrometry analysis lacked the separation of isobaric or near-isobaric species prior to detection, which we have observed in these MS/MS spectra (Figure S4). Nonetheless, the current data indicates that these lipids are cell-specific, as they were not detected in the Matrigel-only zones (Figure S1B). The m/z values of each MS image in Figure S1 are listed in Table S1.
Figure 5.
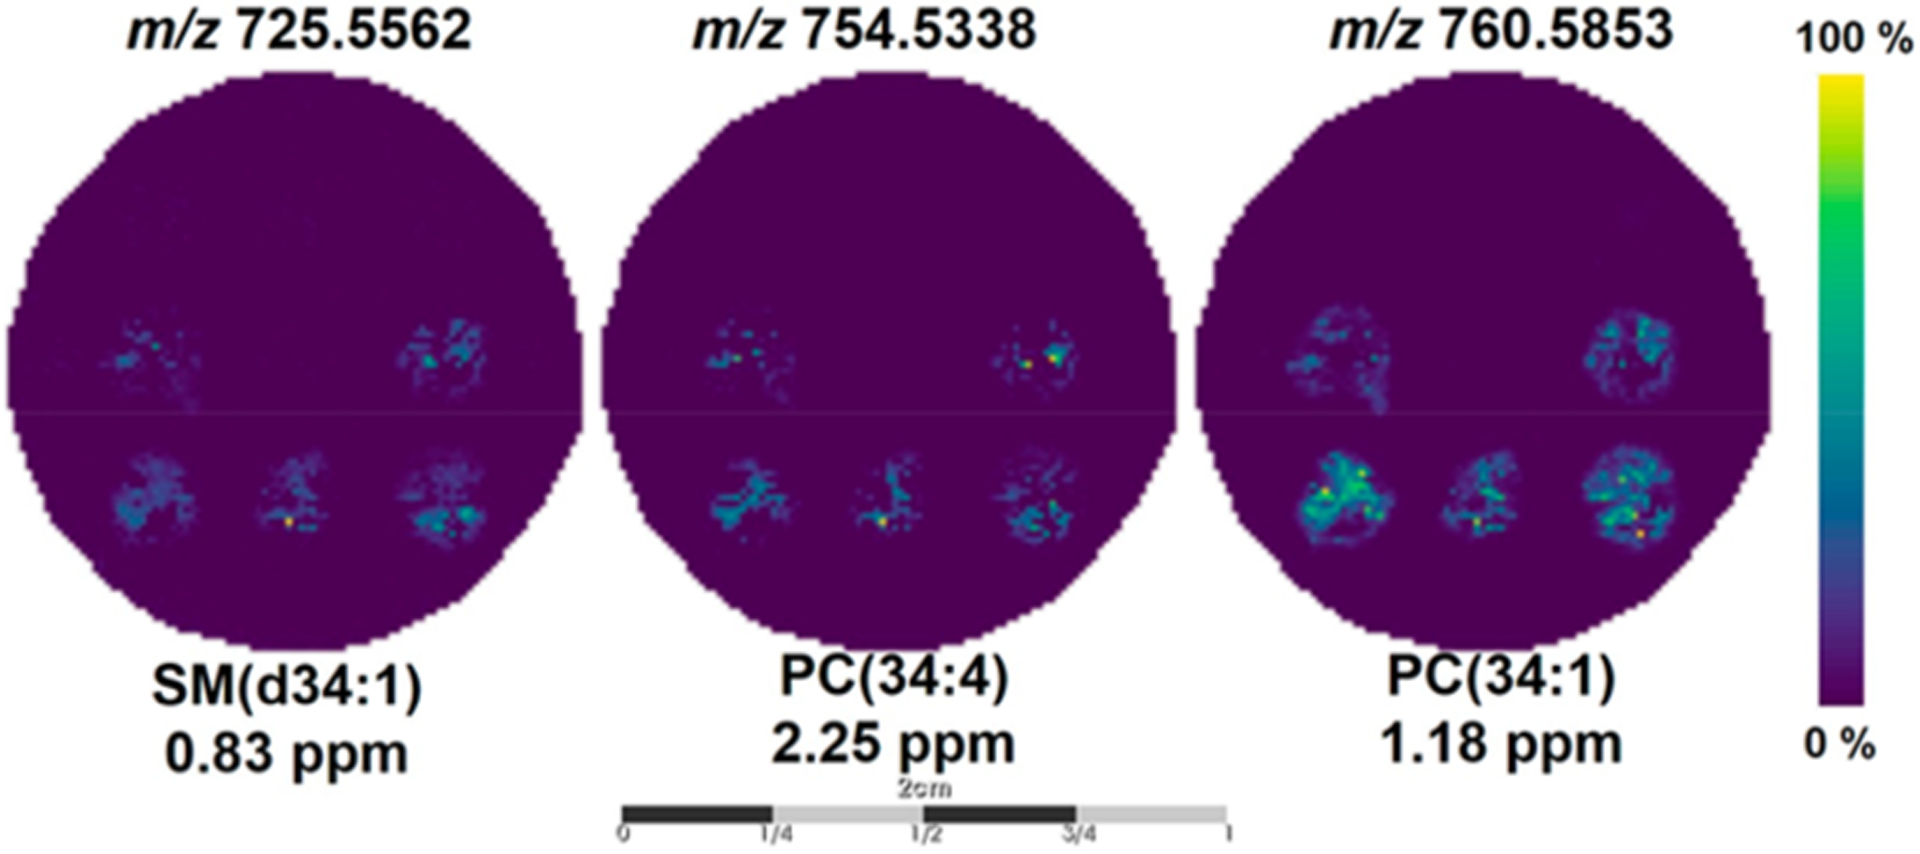
MALDI-MS images of spatially localized ions in the cell-laden wells. Representative MALDI-MS images of SM(d34:1), PC(34:4), and PC(34:1) found to be highly correlative (Pearson’s correlation coefficient ≥0.50) with the segmentation map for the cell-laden wells. Scale bar is 2 cm.
The high mass resolution FTICR gave us the confidence to determine putative chemical assignments solely by their accurate mass when searched against online databases such as Human Metabolome Database (www.hmdb.ca)66 or LIPID MAPS (www.lipidmaps.org).67 The current results are not solely dictated by the mass spectrometer but also the sample preparation. Regardless of the mass analyzer, this label-free approach can simultaneously generate spatially resolved maps of relative drug abundance in PBCs, a technique we term MALDI-MSI-PBC. To further verify the robustness of our data analysis workflow, we analyzed a different PBC scaffold that contained cell-laden and Matrigel-only zones at different locations than those in Figure 2. As shown in Figure S2, the spatial segmentation discriminated the ROI on the basis of the chemical signatures of the zones. The cell-laden, Matrigel-only, and drug-dosed zones as well as the wax regions have been segmented appropriately using the current workflow. This MALDI-MSI-PBC coupled approach could open a gateway for drug screening to rapidly determine if a drug is efficacious and simultaneously acquire spatially resolved images of the different cell populations.
CONCLUSIONS
In this study, we established that a MALDI-MSI-PBC drug screening platform is able to assess drug penetration and metabolism in an untargeted, rapid, and automated manner for a large number of samples. We were able to discriminate zones within the PBC scaffold using a spatial clustering algorithm and identify the therapeutic drugs irinotecan and doxorubicin colocalized on the correct regions of individual PBC scaffolds. Using two methods to apply a deuterated internal standard, we were able to determine the linear response of irinotecan on PBC scaffolds. Using MALDI-MSI-PBC, we can simultaneously and rapidly visualize the presence of the drug and its metabolites as well as any resulting chemical changes in the cell. While MALDI-MSI provides sequential analysis, rich chemical data sets can be obtained from a multizone PBC scaffold in 1 h or less.
While not investigated in this current study, PBC scaffolds can be assembled as a tumor-like structure with a physiologically relevant microenvironment.17 The rapid disassembly of the PBC stacks enables spatially resolved data sets in three dimensions for the further study of cellular response to drugs: the z-direction from the stacked structure and the x- and y-directions from the MALDI-MSI. In our future experiments, we will also adapt 96-zone PBCs that we previously used to screen estrogen receptor alpha agonists and antagonists.68 The chemical information provided by MALDI-MSI-PBC can also be complemented by additional cellular assays to better understand chemotherapeutic metabolism in relation to the local cellular environment.
Supplementary Material
ACKNOWLEDGMENTS
G.J.L. and A.B.H. were supported by the National Institutes of Health (R01GM110406). A.B.H. was also supported by the National Science Foundation (CAREER Award, CHE-1351595). J.C.M. and M.R.L. were supported by the National Institutes of Health (R35GM128697). The 15 T Bruker SolariX FTICR instrument was supported by NIH Award Number Grant S10 OD018507. F.T. was supported by Ohio State Start-Up funds to A.B.H. M.W.B. would like to thank the Graduate School of UNC for support with a Dissertation Completion Fellowship. The authors would like to thank Dr. Arpad Somogyi with the initial FTICR optimizations and Mr. Tyler Larson for his helpful insights.
Footnotes
Supporting Information
The Supporting Information is available free of charge at https://pubs.acs.org/doi/10.1021/acs.analchem.9b03536.
Extracted ion images colocalized in the PBC scaffolds; segmentation map and cluster dendrogram of PBCs; doxorubicin signal response on PBC scaffolds; on-paper MS/MS spectra acquired on cell-laden zones on PBC scaffolds (PDF)
The authors declare no competing financial interest.
REFERENCES
- (1).Hay M; Thomas DW; Craighead JL; Economides C; Rosenthal J Nat. Biotechnol 2014, 32, 40–51. [DOI] [PubMed] [Google Scholar]
- (2).Stock K; Estrada MF; Vidic S; Gjerde K; Rudisch A; Santo VE; Barbier M; Blom S; Arundkar SC; Selvam I; Osswald A; Stein Y; Gruenewald S; Brito C; van Weerden W; Rotter V; Boghaert E; Oren M; Sommergruber W; Chong Y; et al. Sci. Rep 2016, 6, 28951. [DOI] [PMC free article] [PubMed] [Google Scholar]
- (3).Yue X; Lukowski JK; Weaver EM; Skube SB; Hummon AB J. Proteome Res 2016, 15, 4265–4276. [DOI] [PMC free article] [PubMed] [Google Scholar]
- (4).Baharvand H; Hashemi SM; Kazemi Ashtiani S; Farrokhi A Int. J. Dev. Biol 2006, 50, 645–652. [DOI] [PubMed] [Google Scholar]
- (5).Abbott A Nature 2003, 424, 870–872. [DOI] [PubMed] [Google Scholar]
- (6).Eglen RM; Randle DH Assay Drug Dev. Technol 2015, 13, 262–265. [DOI] [PubMed] [Google Scholar]
- (7).Rimann M; Graf-Hausner U Curr. Opin. Biotechnol 2012, 23, 803–809. [DOI] [PubMed] [Google Scholar]
- (8).Clevers H Cell 2016, 165, 1586–1597. [DOI] [PubMed] [Google Scholar]
- (9).Friedrich J; Seidel C; Ebner R; Kunz-Schughart LA Nat. Protoc 2009, 4, 309–324. [DOI] [PubMed] [Google Scholar]
- (10).Zhang B; Radisic M Lab Chip 2017, 17, 2395–2420. [DOI] [PubMed] [Google Scholar]
- (11).Tibbitt MW; Anseth KS Biotechnol. Bioeng 2009, 103, 655–663. [DOI] [PMC free article] [PubMed] [Google Scholar]
- (12).Petersen OW; Rønnov-Jessen L; Howlett AR; Bissell MJ Proc. Natl. Acad. Sci. U. S. A 1992, 89, 9064–9068. [DOI] [PMC free article] [PubMed] [Google Scholar]
- (13).Lee GY; Kenny PA; Lee EH; Bissell MJ Nat. Methods 2007, 4, 359–365. [DOI] [PMC free article] [PubMed] [Google Scholar]
- (14).Hughes CS; Postovit LM; Lajoie GA Proteomics 2010, 10, 1886–1890. [DOI] [PubMed] [Google Scholar]
- (15).Derda R; Laromaine A; Mammoto A; Tang SK; Mammoto T; Ingber DE; Whitesides GM Proc. Natl. Acad. Sci. U. S. A 2009, 106, 18457–18462. [DOI] [PMC free article] [PubMed] [Google Scholar]
- (16).Kenney RM; Lloyd CC; Whitman NA; Lockett MR Chem. Commun . (Cambridge, U. K.) 2017, 53, 7194–7210. [DOI] [PubMed] [Google Scholar]
- (17).Boyce MW; LaBonia GJ; Hummon AB; Lockett MR Analyst 2017, 142, 2819–2827. [DOI] [PMC free article] [PubMed] [Google Scholar]
- (18).Mosadegh B; Dabiri BE; Lockett MR; Derda R; Campbell P; Parker KK; Whitesides GM Adv. Healthcare Mater 2014, 3, 1036–1043. [DOI] [PMC free article] [PubMed] [Google Scholar]
- (19).Mosadegh B; Lockett MR; Minn KT; Simon KA; Gilbert K; Hillier S; Newsome D; Li H; Hall AB; Boucher DM; Eustace BK; Whitesides GM Biomaterials 2015, 52, 262–271. [DOI] [PubMed] [Google Scholar]
- (20).Truong AS; Lochbaum CA; Boyce MW; Lockett MR Anal. Chem 2015, 87, 11263–11270. [DOI] [PubMed] [Google Scholar]
- (21).Rodenhizer D; Gaude E; Cojocari D; Mahadevan R; Frezza C; Wouters BG; McGuigan AP Nat. Mater 2016, 15, 227–234. [DOI] [PMC free article] [PubMed] [Google Scholar]
- (22).Ng K; Gao B; Yong K; Li Y; Shi M; Zhao X; Li Z; Zhang X; Pingguan-Murphy B; Yang H; Xu F Mater. Today 2017, 20, 32–44. [Google Scholar]
- (23).Truong AS; Lockett MR Analyst 2016, 141, 3874–3882. [DOI] [PubMed] [Google Scholar]
- (24).Kenney RM; Boyce MW; Truong AS; Bagnell CR; Lockett MR Analyst 2016, 141, 661–668. [DOI] [PubMed] [Google Scholar]
- (25).Whitman NA; Lin ZW; Kenney RM; Albertini L; Lockett MR Arch. Biochem. Biophys 2019, 671, 8–17. [DOI] [PMC free article] [PubMed] [Google Scholar]
- (26).Solon EG Chem. Res. Toxicol 2012, 25, 543–555. [DOI] [PubMed] [Google Scholar]
- (27).Ma H; Jiang Q; Han S; Wu Y; Tomshine J; Wang D; Gan Y; Zou G; Liang X Mol. Imaging 2012, 11, 487–498. [PubMed] [Google Scholar]
- (28).Moro AJ; Cywinski PJ; Korsten S; Mohr GJ Chem. Commun. (Cambridge, U. K.) 2010, 46, 1085–1087. [DOI] [PubMed] [Google Scholar]
- (29).Kurishita Y; Kohira T; Ojida A; Hamachi IJ Am. Chem. Soc 2010, 132, 13290–13299. [DOI] [PubMed] [Google Scholar]
- (30).Emwas A-H; Roy R; McKay RT; Tenori L; Saccenti E; Gowda GAN; Raftery D; Alahmari F; Jaremko L; Jaremko M; Wishart DS Metabolites 2019, 9, 123. [DOI] [PMC free article] [PubMed] [Google Scholar]
- (31).Urban PL; Schmid T; Amantonico A; Zenobi R Anal. Chem 2011, 83, 1843–1849. [DOI] [PubMed] [Google Scholar]
- (32).Zhang X; Roeffaers MB; Basu S; Daniele JR; Fu D; Freudiger CW; Holtom GR; Xie XS ChemPhysChem 2012, 13, 1054–1059. [DOI] [PMC free article] [PubMed] [Google Scholar]
- (33).Zhu M; Zhang D; Skiles GL In Progress in Pharmaceutical and Biomedical Analysis; Chowdhury SK, Ed.; Elsevier, 2005; pp 195–223. [Google Scholar]
- (34).Mohsin M; Ahmad A; Iqbal M Biotechnol. Lett 2015, 37, 1919–1928. [DOI] [PubMed] [Google Scholar]
- (35).Zenobi R Science 2013, 342, 1243259. [DOI] [PubMed] [Google Scholar]
- (36).Gustavsson B; Carlsson G; Machover D; Petrelli N; Roth A; Schmoll HJ; Tveit KM; Gibson F Clin. Colorectal Cancer 2015, 14, 1–10. [DOI] [PubMed] [Google Scholar]
- (37).Norris JL; Caprioli RM Chem. Rev 2013, 113, 2309–2342. [DOI] [PMC free article] [PubMed] [Google Scholar]
- (38).Buck A; Halbritter S; Spath C; Feuchtinger A; Aichler M; Zitzelsberger H; Janssen KP; Walch A Anal. Bioanal. Chem 2015, 407, 2107–2116. [DOI] [PubMed] [Google Scholar]
- (39).Mitchell CA; Donaldson M; Francese S; Clench MR Methods 2016, 104, 93–100. [DOI] [PubMed] [Google Scholar]
- (40).Tobias F; Pathmasiri KC; Cologna SM Anal. Bioanal. Chem 2019, 411, 5659–5668. [DOI] [PubMed] [Google Scholar]
- (41).Liu X; Flinders C; Mumenthaler SM; Hummon AB J. Am. Soc. Mass Spectrom 2018, 29, 516–526. [DOI] [PMC free article] [PubMed] [Google Scholar]
- (42).Liu X; Weaver EM; Hummon AB Anal. Chem 2013, 85, 6295–6302. [DOI] [PMC free article] [PubMed] [Google Scholar]
- (43).LaBonia GJ; Lockwood SY; Heller AA; Spence DM; Hummon AB Proteomics 2016, 16, 1814–1821. [DOI] [PMC free article] [PubMed] [Google Scholar]
- (44).Liu X; Hummon AB Sci. Rep 2016, 6, 38507. [DOI] [PMC free article] [PubMed] [Google Scholar]
- (45).Theiner S; Schreiber-Brynzak E; Jakupec MA; Galanski M; Koellensperger G; Keppler BK Metallomics 2016, 8, 398–402. [DOI] [PubMed] [Google Scholar]
- (46).Lukowski JK; Weaver EM; Hummon AB Anal. Chem 2017, 89, 8453–8458. [DOI] [PMC free article] [PubMed] [Google Scholar]
- (47).LaBonia GJ; Ludwig KR; Mousseau CB; Hummon AB Anal. Chem 2018, 90, 1423–1430. [DOI] [PMC free article] [PubMed] [Google Scholar]
- (48).Tian X; Zhang G; Zou Z; Yang Z Anal. Chem 2019, 91, 5802–5809. [DOI] [PMC free article] [PubMed] [Google Scholar]
- (49).Palubeckaitė I; Crooks L; Smith DP; Cole LM; Bram H; Le Maitre C; Clench MR; Cross NA J. Mass Spectrom 2019, DOI: 10.1002/jms.4461. [DOI] [PubMed] [Google Scholar]
- (50).Vidavsky N; Kunitake JAMR; Diaz-Rubio ME; Chiou AE; Loh H-C; Zhang S; Masic A; Fischbach C; Estroff LA ACS Cent. Sci 2019, 5, 768–780. [DOI] [PMC free article] [PubMed] [Google Scholar]
- (51).Tucker LH; Hamm GR; Sargeant RJE; Goodwin RJA; Mackay CL; Campbell CJ; Clarke DJ Anal. Chem 2019, 91, 9522–9529. [DOI] [PubMed] [Google Scholar]
- (52).Trede D; Schiffler S; Becker M; Wirtz S; Steinhorst K; Strehlow J; Aichler M; Kobarg JH; Oetjen J; Dyatlov A; Heldmann S; Walch A; Thiele H; Maass P; Alexandrov T Anal. Chem 2012, 84, 6079–6087. [DOI] [PubMed] [Google Scholar]
- (53).McDonnell LA; van Remoortere A; van Zeijl RJ; Deelder AM J. Proteome Res 2008, 7, 3619–3627. [DOI] [PubMed] [Google Scholar]
- (54).Van de Plas R; Yang J; Spraggins J; Caprioli RM Nat. Methods 2015, 12, 366. [DOI] [PMC free article] [PubMed] [Google Scholar]
- (55).Tarolli JG; Jackson LM; Winograd NJ Am. Soc. Mass Spectrom 2014, 25, 2154–2162. [DOI] [PMC free article] [PubMed] [Google Scholar]
- (56).Chen Q; He Z; Liu W; Lin X; Wu J; Li H; Lin JM Adv. Healthcare Mater 2015, 4, 2291–2296. [DOI] [PubMed] [Google Scholar]
- (57).Lloyd CC; Boyce MW; Lockett MR Curr. Protoc Chem. Biol 2017, 9, 75–95. [DOI] [PubMed] [Google Scholar]
- (58).Sladkova K; Houska J; Havel J Rapid Commun. Mass Spectrom 2009, 23, 3114–3118. [DOI] [PubMed] [Google Scholar]
- (59).Cramer SM; Larson TS; Lockett MR Anal. Chem 2019, 91, 10916–10926. [DOI] [PMC free article] [PubMed] [Google Scholar]
- (60).Konicek AR; Lefman J; Szakal C Analyst 2012, 137, 3479–3487. [DOI] [PubMed] [Google Scholar]
- (61).Alexandrov T; Chernyavsky I; Becker M; von Eggeling F; Nikolenko S Anal. Chem 2013, 85, 11189–11195. [DOI] [PubMed] [Google Scholar]
- (62).Lotz JM; Hoffmann F; Lotz J; Heldmann S; Trede D; Oetjen J; Becker M; Ernst G; Maas P; Alexandrov T; Guntinas-Lichius O; Thiele H; von Eggeling F Biochim. Biophys. Acta, Proteins Proteomics 2017, 1865, 946–956. [DOI] [PubMed] [Google Scholar]
- (63).Veličković D; Agtuca BJ; Stopka SA; Vertes A; Koppenaal DW; Paša-Tolić L; Stacey G; Anderton CR ISME J 2018, 12, 2335–2338. [DOI] [PMC free article] [PubMed] [Google Scholar]
- (64).Paine MRL; Liu J; Huang D; Ellis SR; Trede D; Kobarg JH; Heeren RMA; Fernández FM; MacDonald TJ Sci. Rep 2019, 9, 2205. [DOI] [PMC free article] [PubMed] [Google Scholar]
- (65).Alexandrov T; Becker M; Deininger S-O; Ernst G; Wehder L; Grasmair M; von Eggeling F; Thiele H; Maass P J. Proteome Res 2010, 9, 6535–6546. [DOI] [PubMed] [Google Scholar]
- (66).Wishart DS; Feunang YD; Marcu A; Guo AC; Liang K; Vazquez-Fresno R; Sajed T; Johnson D; Li C; Karu N; Sayeeda Z; Lo E; Assempour N; Berjanskii M; Singhal S; Arndt D; Liang Y; Badran H; Grant J; Serra-Cayuela A; et al. Nucleic Acids Res 2018, 46, D608–d617. [DOI] [PMC free article] [PubMed] [Google Scholar]
- (67).Liebisch G; Vizcaino JA; Kofeler H; Trotzmuller M; Griffiths WJ; Schmitz G; Spener F; Wakelam MJ J. Lipid Res 2013, 54, 1523–1530. [DOI] [PMC free article] [PubMed] [Google Scholar]
- (68).Whitman NA; Lin ZW; DiProspero TJ; McIntosh JC; Lockett MR Anal. Chem 2018, 90, 11981–11988. [DOI] [PMC free article] [PubMed] [Google Scholar]
Associated Data
This section collects any data citations, data availability statements, or supplementary materials included in this article.


