. 2020 Apr 8;9:e53683. doi: 10.7554/eLife.53683

Figure 3. Ions in the MtTMEM175 structure.

(a–c) Side view on MtTMEM175 (a) and close-up views of the ion binding site with a hydrated K+ ion at position 1K+ (b) and another K+ ion within the pore at position 2K+(c). In (a), K+ ions and water molecules are displayed as purple and red spheres, respectively. In (b) and (c) the 2Fo-Fc electron density is depicted as blue mesh at the position 1K+ and 2K+ (at 2.4 Å, contoured at 1.8 σ, sharpened with b=-25). Two subunits are omitted for clarity. (d) Top view of the ion binding site. Distances between opposing backbone oxygens of Leu42, Ser43 and Ser44 are indicated in Å. Side chains are omitted and the size of the spheres is reduced for clarity. (e) Substitution of K+ in the ion binding site with Cs+ and Rb+. The 2Fo-Fc electron density (as in (b) and (c), blue mesh) marks the position of the K+ ion. Anomalous difference electron densities of Cs+ (at 3.8 Å, contoured at 7 σ) and Rb+ (at 3.6 Å, contoured at 7 σ, blurred with b = 125) are shown in yellow and magenta, respectively. (f) Illustration of the surface electrostatic potential across the pore.

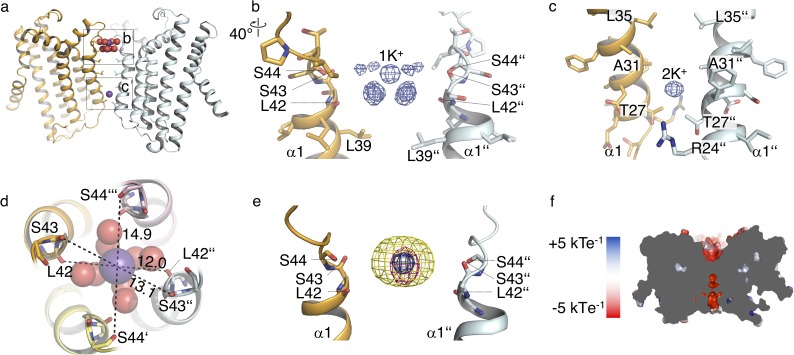
Figure 3.

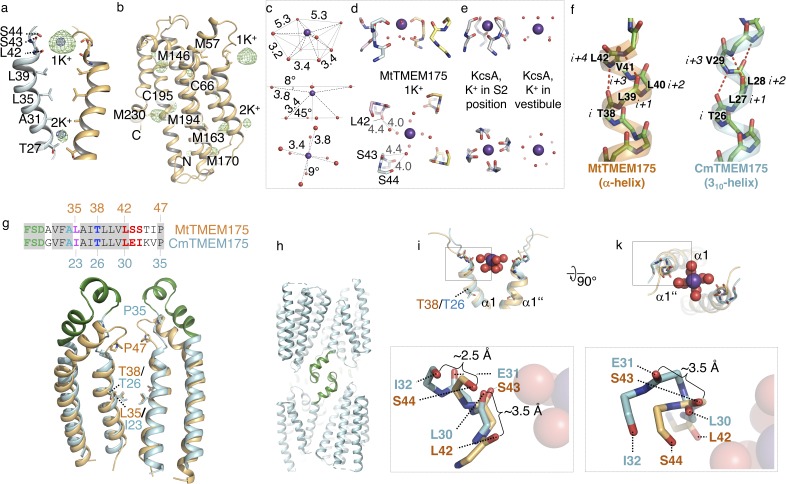
Figure 3—figure supplement 1. K+ coordination in MtTMEM175, 310-helix in CmTMEM175 and analysis of the ion binding site region in CmTMEM175.

Figure 3—figure supplement 1.

(a–b) Anomalous difference electron density measured at 2.02460 Å in crystals of MtTMEM175. (a) Verification of K+ ions at positions 1K+ at the extracellular entrance and 2K+ within the pore close to the intracellular entrance. The anomalous difference density map at +3 σ is shown as green mesh (at 3.5 Å, blurred with b = 165). For comparison, the 2Fo-Fc electron density from the best dataset (at 2.4 Å, contoured at 1.8 σ, sharpened with b=-25) is illustrated as blue mesh at the respective positions of 1K+ and 2K+. In (b), all methionine and cysteine positions are shown. (c,d) Geometry and dimensions of the hydrated K+ in MtTMEM175. Angles and atom-to-atom distances are indicated in degrees (°) and Å, respectively. (e) Coordination of K+ in KcsA by backbone oxygens (left, 1K4C, S2 position) and geometry of a hydrated K+ ion in the KcsA vestibule in proximity to the selectivity filter (right, 1K4C). (f) Extracellular tips of helix one in CmTMEM175 (cyan) and MtTMEM175 (orange) shown as stick/cartoon representation. Only backbone atoms are displayed. In MtTMEM175 four residues complete a helical turn (alpha helical) while in CmTMEM175 three residues complete a helical turn (310-helix). (g,h) The loop following the 310-helix in CmTMEM175 is colored in green and participates in the formation of crystal contacts (h). Reference residues are displayed in a sequence alignment in (g). (i,k) Superposition of the extracellular ends of helix one in MtTMEM175 and CmTMEM175 with approximate deviations indicated in Å (side and top view of the ion binding site). Thr38 and Leu35 (MtTMEM175, orange) were aligned with corresponding Thr26 and Ile23 (CmTMEM175, cyan). Only main chain atoms are shown. The K+ hydrate from the MtTMEM175 structure is shown as spheres.