FIG. 5.
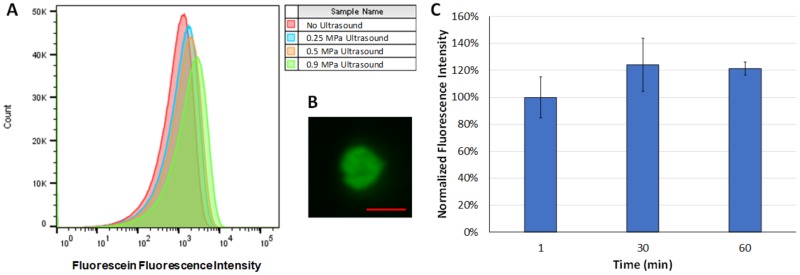
(a) Representative fluorescence intensity histograms after ultrasound treatment at peak negative pressures of 0.25 MPa, 0.5 MPa, 0.9 MPa, or no ultrasound (negative control). Fluorescence intensity increased up to peak negative acoustic pressures of 0.9 MPa indicating enhance molecular delivery to erythrocytes. (b) Representative fluorescence microscopy image of an erythrocyte after ultrasound treatment at a peak negative acoustic pressure of 0.9 MPa demonstrating fluorescein delivery (scale bar = 5 μm). (c) Fluorescence intensity of erythrocytes over time after fluorescein treatment as measured by flow cytometry, indicating no significant difference over time (n = 3/group).

