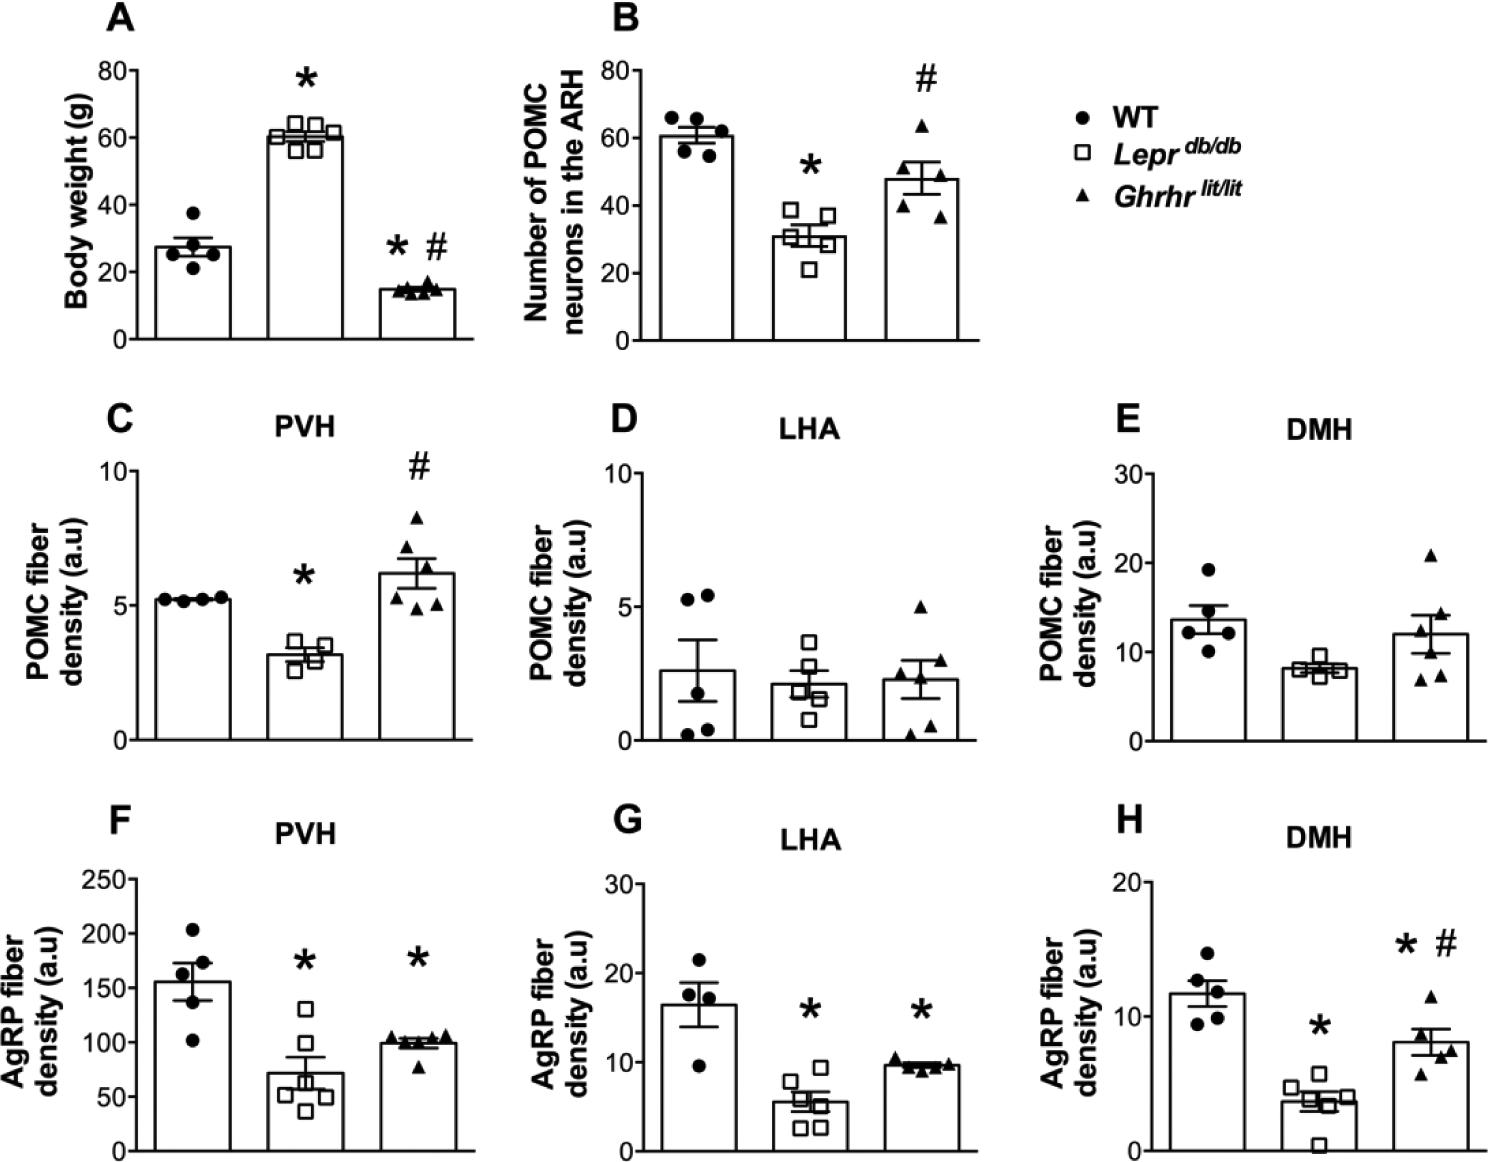
Fig. 1. Axonal projections of POMC and AgRP neurons require GH and leptin signaling.

A. Body weight of 4 month-old control (WT, n = 5), Leprdb/db (n = 6) and Ghrhrlit/lit (n = 6) male mice. B. Number of POMC-expressing cells in the ARH of WT (n = 5), Leprdb/db (n = 5) and Ghrhrlit/lit (n = 5) mice. C-E. Quantification of POMC fiber density in the PVH (B), LHA (C) and DMH (D) of WT (n = 4–5), Leprdb/db (n = 4–5) and Ghrhrlit/lit (n = 6) mice. F-H. Quantification of AgRP fiber density in the PVH (E), LHA (F) and DMH (G) of WT (n = 4–5), Leprdb/db (n = 6) and Ghrhrlit/lit (n = 5–6) mice. Mean ± s.e.m. One-way ANOVA followed by Tukey’s post-hoc test. * P < 0.05 vs. WT. # P < 0.05 vs. Leprdb/db.
