

Abstract
Purinergic signaling plays a complex role in inflammation. Nucleotides released by T lymphocytes, endothelial cells, and platelets during inflammation induce cellular responses by binding to receptors that regulate intracellular signaling pathways. Previous studies have found that purinergic signaling can have both proinflammatory and anti-inflammatory effects, but the roles of specific pathways in specific cell types are poorly understood. We investigated the role of the P2Y12 signaling pathway in the activation of T lymphocytes in vitro. We isolated peripheral blood mononuclear cells (PBMCs) from healthy donors and pretreated them with ADP (a P2Y12 agonist), AR-C69931MX (a P2Y12 antagonist), or both. We then stimulated PBMC using phytohemagglutinin (PHA) or anti-CD3/CD28 antibodies. We found that ADP affects T cell responses in term of cell activity and receptor expression through both P2Y12-dependent and P2Y12-independent pathways and other responses (cytokine secretion) primarily through P2Y12 -independent pathways. The ADP-mediated effect changed over time and was stimulus-specific.
Electronic supplementary material
The online version of this article (10.1007/s12079-019-00540-8) contains supplementary material, which is available to authorized users.
Keywords: Purinergic signaling, T lymphocytes, ADP-receptor P2Y12, P2Y12 antagonist
Introduction
Changes in extracellular concentration of nucleotides (ATP, AMP and ADP) are a salient feature of inflammation (Deaglio and Robson 2011; Idzko et al. 2014; Sevigny et al. 2015). They are secreted by T lymphocytes, endothelial cells and platelets during inflammation (Eltzschig et al. 2013; Rayah et al. 2012; von Kugelgen and Hoffmann 2016), and they bind to purinergic receptors that are expressed on the membrane of these cell types (Jacob et al. 2013). As a result, nucleotides can act on neighboring cells (paracrine) as well as on the cells that secreted them (autocrine). Nucleotides stimulate the cells of the immune system through different pathways (von Kugelgen and Hoffmann 2016), depending on the cell type and the receptor activated (Cekic and Linden 2016; Eltzschig et al. 2013; Junger 2011; Sevigny et al. 2015). The increased concentration of circulating nucleotides persists during inflammation (Boeynaems and Communi 2006).
Purinergic signaling is mediated by P2X and P2Y receptors (Burnstock 2007). P2X receptors are trimeric ATP-gated cation channels that mediate the rapid flux of Na+, K+, and Ca2+ (Kaczmarek-Hajek et al. 2012). P2X receptors are expressed in smooth muscle cells, leukocyte and platelets. Leukocytes express mRNA for P2X1, P2X4 and P2X7 (Hoffman et al. 2004), and in particular P2X4 (Layhadi et al. 2018) and P2X7 (Gu et al. 2000) have been shown important for leukocyte biology. On the other hand, P2Y receptors are G protein-coupled receptors (GPCRs) activated by purine nucleotides (Di Virgilio and Solini 2002; Rayah et al. 2012), and they are expressed on platelets, endothelial cells and T lymphocytes (von Kugelgen and Hoffmann 2016). T lymphocytes express mRNA for several different P2Y receptors, including P2Y1, P2Y2, P2Y4, P2Y6, P2Y11, P2Y12, P2Y13, and P2Y14 (Deaglio and Robson 2011). Previous studies have shown the effects of stimulating these P2Y receptors on T lymphocytes (Burnstock 2018; Cekic and Linden 2016; Chen and Chang 2013; Idzko et al. 2014; Sak et al. 2003; Sullivan et al. 2000). However, although these receptors have been shown to play a role in leukocyte functions during inflammation, the effects of purinergic signaling have a complex influence on T lymphocytes that has not yet been fully elucidated.
P2Y12 mediates ADP-induced aggregation in platelets and plays a central role in platelet biology (Kim and Kunapuli 2011a). Although P2Y12 was thought to be present only in platelets (Wang et al. 2003) and microglia (Sasaki et al. 2003), recent studies have shown that P2Y12 mRNA is expressed in other cells of the immune system, such as monocyte (Micklewright et al. 2018), dendritic cells (Ben Addi et al. 2010) and T lymphocytes as well (Wang et al. 2004). However, the role of the receptor P2Y12 on these immune cells has not been clarified yet.
Hence, we investigated for the first time whether blocking the P2Y12 pathways alters T lymphocytes in vitro. We isolated human peripheral blood mononuclear cells (PBMC) from healthy donors and stimulated them with T cell -specific stimuli, such as Phytohemagglutinin (PHA) or anti-CD3/CD28, in order to investigate the effects of different stimulation regiments on T lymphocytes. Changes in T lymphocytes were analyzed at different time points following stimulation. To investigate the consequences of blocking the P2Y12 signaling pathway, PBMCs were pre-incubated with the P2Y12 antagonist AR-C69931MX (Cangrelor), a clinically relevant anti-thrombotic drug, which has been used in multiple in vitro studies (Ingall et al. 1999). Our data show for the first time that 2MeSADP exposure could influence T cell activation in a time- and stimulus-dependent manner. Changes in cytokine secretion seemed to be P2Y12-independent, while changes in cell population appeared to be P2Y12-dependent and independent, showing for the first time that the receptor P2Y12 is functional in human T cells.
Materials and methods
Materials
All reagents were of analytical grade and purchased from Thermo Fisher Scientific (Waltham, MA) unless stated otherwise. The anti-human CD3 and anti-human CD28 antibodies were purchased from Tonbo Biosciences (San Diego, CA). The anti-human CD4 (FITC-conjugated; clone OKT4) and anti-human CD8 (PE-conjugated; clone HIT8a) antibodies were purchased from eBioscience (San Diego, CA). The anti-human CD25 (PE Cy7-conjugated; clone BC99) antibody was purchased from Invitrogen (Waltham, MA). Rat IgG2a κ isotype control FITC, rat IgG2b κ isotype control PE, and rat IgG1 κ isotype control PE Cy7 were purchased from eBioscience (San Diego, CA). Triton X-100, phosphate-buffered saline (PBS), 2-methylthio-ADP (2MeSADP) and Apyrase (type VII) were purchased from Sigma-Aldrich (St. Louis, MO). Ficoll-Paque was purchased from GE Healthcare Bio-Sciences AB (Uppsala, Sweden). AR-C69931MX tetrasodium salt and MRS2211 was purchased from Tocris Bioscience (Minneapolis, MN).
Human peripheral blood mononuclear cell isolation
Human blood was obtained from healthy volunteers following the procedures and guidelines approved by the Institutional Review Board of Temple University School of Medicine. Total blood was diluted with one-sixth volume of acid-citrate-dextrose (2.5 g of sodium citrate, 1.5 g of citric acid, and 2.0 g of glucose in 100 mL of deionized water). Peripheral blood mononuclear cells (PBMCs) were isolated as previously described (Broker et al. 1994; Hasham and Tsygankov 2004; Liverani et al. 2012) Briefly, blood (50 mL) was diluted with RPMI 1640 medium (1:1), layered over Ficoll-Paque (10 mL for 50 mL of diluted blood), and centrifuged at 300×g for 30 min at room temperature. Cells were collected from the interphase layer, transferred to RPMI 1640 medium supplemented with penicillin-streptomycin (each at 0.8 mM) and glutamine (2 mM), and maintained at 37 °C in a humidified atmosphere containing 5% CO2. The % of T cells at time 0 was evaluated through flow cytometry (Supplemental Fig. 2) as described in the flow cytometry section. To activate T cells, the collected PBMCs (1 × 10⁶ cells/mL) were incubated with either phytohemagglutinin (PHA, 5 μg/mL) or anti-CD3/anti-CD28 for 24, 48, or 72 h. In the latter case, plates were pre-coated with anti-CD3 by adding 5 μg/mL of anti-human CD3 antibody in 200 μL of PBS to each well and incubated overnight. Once the cells were plated into the wells (1 × 10⁶ cells/mL), an equal concentration of anti-human CD28 antibody (5 μg/mL) was added.
Treatments
Prior to stimulation, PBMCs (1 × 10⁶ cells/mL) were pre-incubated with AR-C69931MX (AR-C; 100 nM) for 20 min at 37 °C in fully supplemented culture medium. When appropriate, cells were also pre-incubated with apyrase (0.2 units/ml). Then 2MeSADP (2MeSADP, 100 nM) was added alone or in combination with AR-C (2MeSADP/AR-C, 100 nM/100 nM). When appropriate, 2MeSADP (100 nM) was added alone or in combination with MRS2211 (2MeSADP /MRS, 100 nM/100 nM respectively). Cells were then incubated with PHA or anti-CD3/anti-CD28 for 24, 48 or 72 h as described above. Negative control cells received an equivalent amount of vehicle (PBS).
PBMC numbers estimation (enzymatic activity)
The number of T cells was estimated using T cell enzymatic activity as a proxy employing a WST-1 assay kit (Cayman, Ann Arbor, MI) as per the manufacturer’s instructions. The assay is based on the enzymatic conversion of the tetrazolium salt WST-1 to formazan by mitochondrial dehydrogenases that are present in living cells. Briefly, cultured cells were incubated with the WST-1 mixture for four hours at 37 °C in an atmosphere containing 5% CO2. The absorbance at 450 nm was determined for each sample using a microplate reader. The data show an estimate of cell numbers based on metabolic activity that are expressed as absorbance value relative to untreated unstimulated cells.
Flow cytometry
Unstimulated and stimulated PBMC were stained for the T cell surface markers CD4 or CD8 or CD4/CD25. Cells were first incubated with FITC-conjugated anti-CD4, PE-conjugated anti-CD8, or PE Cy7-conjugated anti-CD25 antibodies (1:100 dilution). T cells were then acquired using a Becton Dickinson FACS Vantage cell sorter and analyzed using the Flow Jo software. The total number of events acquired was 20,000 for each sample. CD4+, CD8+ and CD4+/CD25+ cell populations were determined as described in Supplemental Fig. 1. Data are shown as a % of positive events as compared to the total number of event acquired (20,000).
Cytokine measurement
The supernatant was collected following 72 h of incubation with 2MeSADP or AR-C, or a combination of both for PHA-stimulated, CD3/CD28-stimulated, and unstimulated PBMCs. Levels of IL-2, IL-4, IL-5, IL-6, IL-10, and IFN-γ were determined using the human high sensitivity T cell discovery array 14-plex (Eve Technologies, Calgary, Canada).
Measurement of cAMP levels
Isolated PBMCs were either maintained in an unstimulated state or stimulated with PHA or anti-CD3/CD28 antibodies for 48 h at 37 °C in an atmosphere containing 5% CO2. The cells were incubated with AR-C, 2MeSADP, or a combination of both for 15 min at 37 °C and then resuspended in 0.1 M HCl for 10 min at room temperature. Samples were then stored in HCl at −80 °C. The levels of cAMP were detected using the direct cAMP enzyme immunoassay kit (Enzo Life Science, Farmingdale, NY).
Statistical analysis
Each independent experiment was performed in one donor hence for example n = 5 means that PBMC from 5 donors were isolated, cultured, stimulated and analyzed. Differences among groups were analyzed using a one-way ANOVA test. A Bonferroni’s Multiple Comparison Test was used as a post-test analysis. P < 0.05 was considered to be significant. Data are reported as mean ± standard error of the mean (S.E.M.) for each group.
Results
Exposure to 2MeSADP alters PBMC proliferation through P2Y12 -dependent and P2Y12 -independent pathways without causing cell toxicity
We investigated the effect of ADP on isolated primary human PBMC with or without activation with either PHA or anti-CD3/CD28 antibodies. We used 2-methylthio-ADP (2MeSADP), instead of ADP, as 2MeSADP is more stable than ADP (Gendaszewska-Darmach et al. 2003). First, we used a cell viability assay to investigate whether the 2MeSADP and AR-C treatments used in our experiments are toxic to primary human PBMC. AR-C69931MX (AR-C, Cangrelor) is a P2Y12 antagonist that we used either by itself or in combination with 2MeSADP. Based on the data presented in Supplemental Fig. 2, we concluded that none of the treatments used interfered with cell viability at any of the time points we analyzed.
Activation of PBMC by PHA or anti-CD3/CD28 antibodies increases of relative T cell numbers based on metabolic activity (Chess et al. 1975; de Swart et al. 1993). We used these two different stimuli to determine whether PBMC proliferate in the presence of 2MeSADP and, if so, whether the effect is dependent on the ADP-receptor P2Y12 (Table 1). We cultured unstimulated and PBMC stimulated with either PHA or anti-CD3-CD28 antibodies (Table 1) in the presence or absence of either 2MeSADP (100 nM), or AR-C (100 nM), or both (100 nM each). We incubated the cells for 24, 48, or 72 h. In Table 1 estimates of cell numbers based on metabolic activity are expressed as relative cell numbers under various stimulation/treatment conditions relative to the numbers of unstimulated untreated cells. It is important to notice that no appreciable proliferation was observed in unstimulated cells over time. However, pre-incubation with AR-C alone or in combination with 2MeSADP significantly decreased the cell numbers at 24 h post-culture (Table 1, P < 0.05, negative control vs P2Y12 antagonism and negative control vs exposure to 2MeSADP + P2Y12 antagonism). Exposure to 2MeSADP alone did not alter cell numbers at 24 h, but a significant, albeit a modest increase was noted after 48 h (Table 1, P < 0.05, negative control vs exposure to 2MeSADP). No change was observed in unstimulated cells when the P2Y12 receptor was blocked at 48 or 72 h as compared with the untreated control, indicating the 2MeSADP effects at this time points are P2Y12-independent.
Table 1.
Exposure to 2MeSADP alter cell proliferation through both P2Y12-dependent and P2Y12-independent pathways
| Treatment | Unstimulated (24 h) | PHA (24 h) | CD3/28 (24 Hours) |
| Negative | 1 ± 0 | 1.517 ± 0.160 | 2.596 ± 0.245 |
| AR-C | 0.747 ± 0.126 * | 1.847 ± 0.179 | 2.623 ± 0.288 |
| 2MeSADP | 1.023 ± 0.06 | 1.843 ± 0.254 | 2.616 ± 0.284 |
| 2MeSADP + ARC | 0.802 ± 0.066 * | 1.707 ± 0.198 | 2.797 ± 0.141 |
| Treatment | Unstimulated (48 h) | PHA (48 h) | CD3/28 (48 Hours) |
| Negative | 1 ± 0 | 3.046 ± 0.158 | 5.517 ± 2.372 |
| AR-C | 1.048 ± 0.083 | 3.802 ± 0.266 * | 5.161 ± 1.599 |
| 2MeSADP | 1.377 ± 0.124 * | 2.863 ± 0.283 | 5.038 ± 1.284 |
| 2MeSADP + ARC | 1.058 ± 0.102 | 3.052 ± 0.307 | 6.291 ± 1.824 |
| Treatment | Unstimulated (72 h) | PHA (72 h) | CD3/28 (72 Hours) |
| Negative | 1 ± 0 | 2.399 ± 0.171 | 3.858 ± 0.467 |
| AR-C | 0.977 ± 0.032 | 3.070 ± 0.253 * | 2.957 ± 0.234 * |
| 2MeSADP | 1.083 ± 0.032 | 2.469 ± 0.419 | 3.869 ± 0.226 |
| 2MeSADP + ARC | 0.886 ± 0.045 | 1.935 ± 0.330 | 3.826 ± 0.380 |
Cells were cultured without stimuli (unstimulated) or stimulated with PHA or anti-CD3/CD28 for 24, 48 and 72 h. Cells were pre-treated with 2MeSADP (100 nM), AR-C (100 nM) or 2MeSADP/AR-C (both 100 nM). Negative control did not receive any treatment. Cell proliferation was analyzed using a WST-1 cell proliferation assay kit. Data are expressed as relative absorbance compared with unstimulated untreated cells. Means ± S.E.M. are plotted (*p < 0.05, n = 7 for unstimulated, n = 5 for PHA-stimulated and n = 7 for anti-CD3/CD28-stimulated cells)
When cell proliferation was stimulated with PHA (Table 1), no effect of 2MeSADP and/or AR-C was noted at 24 h post-stimulation. After 48 h, a significant increase was observed in the cells pretreated with AR-C (Table 1, P < 0.05, negative control vs P2Y12 antagonism), and this effect was maintained at 72 h (Table 1, P < 0.05, negative control vs P2Y12 antagonism).
When cells were stimulated with anti-CD3/CD28 (Table 1), proliferation was more robust than in PHA-stimulated cells (Table 1), but no change in proliferation caused by 2MeSADP and/or P2Y12 antagonism was observed after 24 or 48 h of treatment as compared with the untreated control. However, a significant decrease was noted in cells pre-treated with AR-C 72 h post-stimulation (Table 1, P < 0.05, negative control vs P2Y12 antagonism). Interestingly, this effect is opposite to that observed in PHA-stimulated cells at the same time point, suggesting that P2Y12 antagonism alter PBMC proliferation in a stimulus-specific manner.
Taken together, these data indicate that exposure to 2MeSADP and P2Y12 antagonism influence T cell proliferation in a time- and stimulus-dependent manner.
Exposure to 2MeSADP affects CD4+ and CD8+ cells differentially
Next we examined the effect of ADP exposure on proliferation of major subsets of T cells. Subset populations were analyzed using flow cytometry and identified as described in the Supplemental Figs. 1 and 2. The CD4+ and CD8+ fraction are expressed as a percentage of the whole PBMC population, while CD4 + CD25+ are expressed as a % of CD4+ cells. First, the results of these experiments indicate that 48 h after stimulation of the respective samples unstimulated PBMCs contained approximately 40% of T cells and a CD4/CD8 ratio of these T cells was approximately 1.3 (Fig. 1a, b). Stimulation with PHA or anti-CD3/CD28 increases the fraction of T cells to approximately 80% (as anticipated, because T cells, but not other cells proliferate in response to these treatments). However, stimulation with PHA and anti-CD3/CD28 exerted differential effects on a CD4/CD8 ratio in the corresponding cultures, PHA-stimulated cells had a ratio of 1.5, which was close to that in unstimulated cells, whereas of anti-CD3/CD28-stimulated cells had a CD4/CD8 ratio of ~3.
Fig. 1.
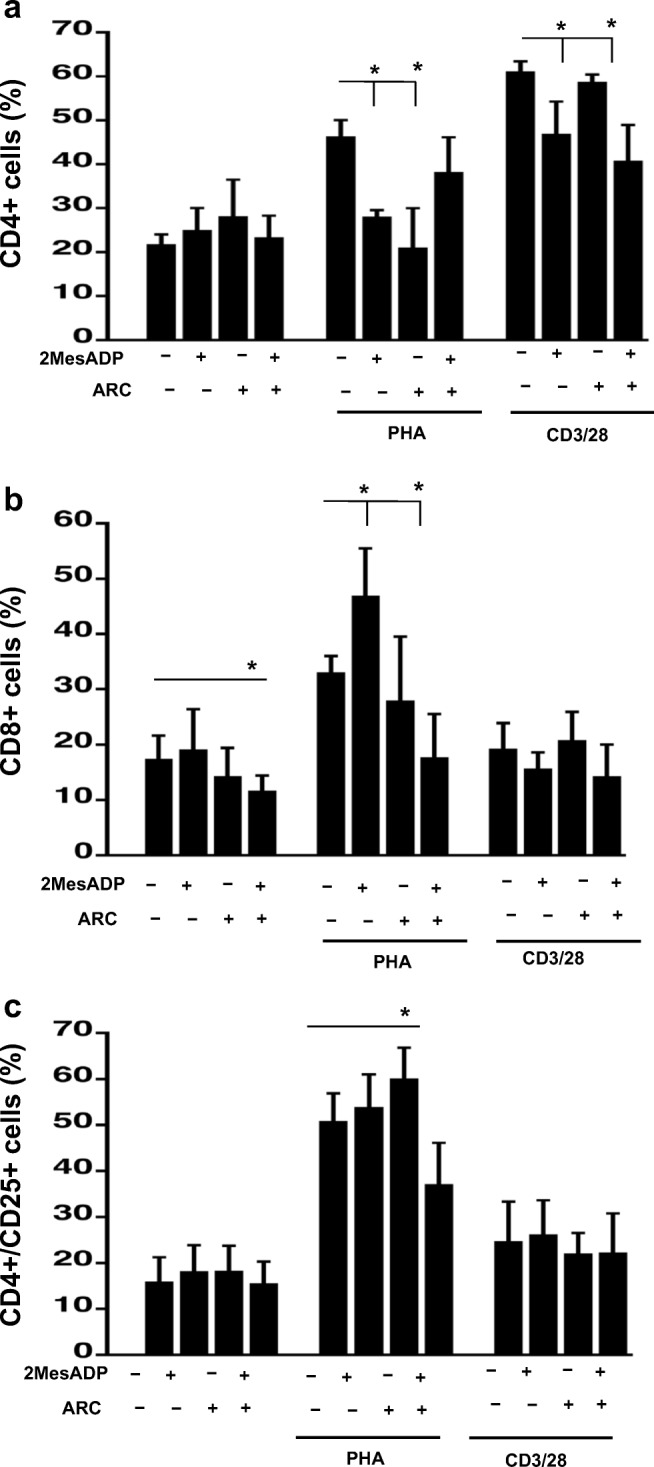
Exposure to 2MeSADP alter CD4+, CD8+ and CD4+/CD25+ cell populations through both P2Y12-dependent and P2Y12-independent pathways at 48 h of stimulation. Cells were stimulated with anti-CD3/CD28 or PHA or left unstimulated for 48 h. Cells were pre-treated with 2MeSADP (100 nM), AR-C (100 nM) or 2MeSADP/AR-C (both 100 nM). Negative control did not receive any treatment. Cell populations positive to CD4 (a), CD8 (b) or both CD4 and CD25 (c) were determined using flow cytometry. Data are expressed as a fraction of cells among PBMC (%) ± S.E.M. (*p < 0.05, n = 5)
No change in the population of CD4 cells was noted when PBMC were unstimulated (Fig. 1a). However, in PHA-stimulated culture both 2MeSADP (100 nM) and AR-C (100 nM) reduce the fraction of CD4 cells as compared to untreated control, when added alone (Fig. 1a, P < 0.05, negative control vs exposure to 2MeSADP and negative control vs exposure to AR-C). But no effect was observed when 2MeSADP and AR-C were added together. In the anti-CD3/CD28-stimulated culture 2MeSADP alone and 2MeSADP with AR-C significantly reduce the number of CD4 cells, whereas AR-C alone does not have any effect (Fig. 1a, P < 0.05, negative control vs exposure to 2MeSADP and negative control vs exposure to 2MeSADP + AR-C). The % of CD8 cells was decreased when cells were cultured with both 2MeSADP and AR-C, but no change was noted when cells were exposure to a single treatment (Fig. 1b, P < 0.05, negative control vs exposure to 2MeSADP + AR-C). 2MeSADP alone increases the fraction of CD8 cells, 2MeSADP with AR-C reduces it, while AR-C alone does not exert a significant effect on the CD4/CD8 ratio (Fig. 1b, P < 0.05, negative control vs exposure to 2MeSADP and negative control vs exposure to 2MeSADP + AR-C). No treatment changes the number of CD8 cells as compared to untreated control in anti-CD3/CD28-stimulatd culture (Fig. 1b). These results show that ADP and/or P2Y12 receptor antagonism demonstrate significant and differential effects on the fractions of CD4 (Fig. 1a) and CD8 (Fig. 1b) cells in PBMC.
Interestingly, the fraction of CD4+ T cells positive for CD25, which indicates the high-affinity receptor for IL-2, is lower in anti-CD3/28-stimulated cells than this fraction in PHA-stimulated cells, although proliferation of anti-CD3/28-stimulated cells is more active than that of PHA-stimulated cells (Table 1). This finding can be explained by a higher level of IL-2 production by anti-CD3/28-stimulated cells (see Fig. 5 below). No changes were noted in the CD4+/CD25+ cell population (Fig. 1c) between the negative control and all the treatment groups analyzed when cells were unstimulated or stimulated with anti-CD3/28. However, a significant decrease was observed in PHA-stimulated cells when both 2MeSADP and AR-C were added (Fig. 1c, P < 0.05, negative control vs exposure to 2MeSADP + P2Y12 antagonism).
Fig. 5.

Exposure to 2MeSADP changes cytokine secretion upon stimulation. Cytokine levels in the culture supernatants were determined for IL-2, IL-4, IL-5, IL-6, IL-10, IL-17 and IFN-γ. The groups analyzed were: negative control, 2MeSADP-activated, AR-C-treated and 2MeSADP/AR-C-treated cells. Cells were stimulated with PHA or anti-CD3/CD28 for 72 h. Cytokine concentration was normalized to viability (as shown in Supplemental Table 1). Values are expressed in pg/ml per viability index; means ± S.E.M. are plotted (*p < 0.05, n = 5)
Seventy-two hours post-stimulation, the effects of 2MeSADP exposure and P2Y12 antagonism shifted (Fig. 2). The 2MeSADP-induced decrease in the % of the CD4 population was still seen in PHA-stimulated cells (Fig. 2a, P < 0.05, negative control vs exposure to 2MeSADP), indicating that the effects of 2MeSADP exposure are time-dependent. However, P2Y12 antagonism did not prevent a decrease in the CD4+ cell population at 72 h post-stimulation, suggesting that this effect of 2MeSADP is independent of the receptor P2Y12, at least at this time-point.
Fig. 2.
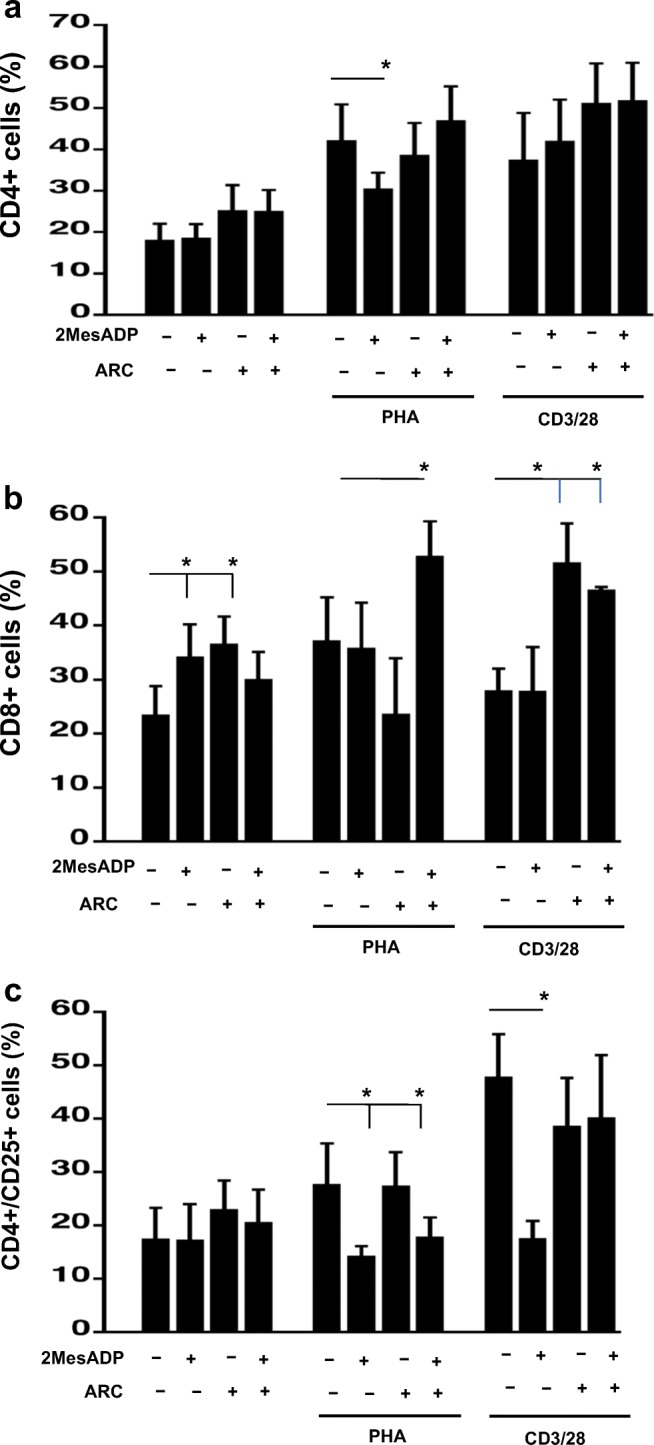
Exposure to 2MeSADP alter CD4+, CD8+ and CD4+/CD25+ cell populations through both P2Y12-dependent and P2Y12-independent pathways at 72 h of stimulation. Cells were stimulated with anti-CD3/CD28 or PHA or left unstimulated for 72 h. Unstimulated cells were cultured without stimuli. Cells were exposed 2MeSADP (100 nM), AR-C (100 nM) or 2MeSADP/AR-C (both 100 nM). Negative control did not receive any treatment. Cell populations positive to CD4 (a), CD8 (b) or CD4/CD25 (c) were determined using flow cytometry. Data are expressed as % of expression ± S.E.M. (*p < 0.05, n = 5)
The CD8 positive cells were increased in unstimulated cells 72 h after treatment exposure to 2MeSADP or P2Y12 antagonism (Fig. 2b, P < 0.05, negative control vs exposure to 2MeSADP and negative control vs P2Y12 antagonism), but no effect was noted when 2MeSADP and AR-C were added together, contrary to what we observed after 48 h (Fig. 2b). In PHA-stimulated cells, exposure to 2MeSADP and P2Y12 antagonism increased CD8+ population only when added in combination (Fig. 2b, P < 0.05, negative control vs exposure to 2MeSADP + P2Y12 antagonism). This is again different to what we observed at the 48-h time-point, when exposure to 2MeSADP increased the CD8+ cell population (Fig. 1b). In anti-CD3/CD28 stimulated cells, CD8+ cell population increased when the receptor P2Y12 was blocked (Fig. 2b, P < 0.05, negative control vs P2Y12 antagonism and negative control vs exposure to 2MeSADP + P2Y12 antagonism), but 2MeSADP treatment alone did not show any effect. Overall, these data suggest that the effect of P2Y12 antagonism in altering the CD8 population is time-dependent.
At 72 h stimulation, the CD4+/CD25+ cell population has changed significantly compared with what observed at the 48-h stimulation time-point (Fig. 2c vs Fig. 1c). A significant decrease was observed in PHA-stimulated cells when 2MeSADP was added alone or in combination with AR-C (Fig. 2c, P < 0.05, negative control vs exposure to 2MeSADP and negative control vs exposure to 2MeSADP + P2Y12 antagonism). These data suggest that the effects of 2MeSADP on the CD4+/CD25+ cell population are P2Y12-independent. In anti-CD3/CD28 stimulated cells, exposure to 2MeSADP decreased the CD4+/CD25+ cell population (Fig. 2c, P < 0.05, negative control vs exposure to 2MeSADP). However, a decrease was not noted when 2MeSADP was added with AR-C, suggesting that the effect of 2MeSADP on the CD4+/CD25+ cell population upon anti-CD3/CD28 stimulation are P2Y12-dependent, contrary to what was observed in PHA-stimulated cells.
Apyrase alters PBMC activity and CD4+, CD8+ and CD4+/CD25+ cell populations in response to 2MeSADP and AR-C
Upon inflammatory stimuli, T lymphocytes secret ADP that exerts autocrine effects on the cell surface (Eltzschig et al. 2013; Rayah et al. 2012; von Kugelgen and Hoffmann 2016), suggesting a relevant role for endogenous ADP in the regulation of these cells during inflammation. Hence we aim to investigate the effects of the ADPase apyrase on relative PBMC numbers and T cell populations before and after exposure to exogenous 2MeSADP and P2Y12 antagonism. In these experiments, we cultured unstimulated PBMC cells and PBMC stimulated with either PHA or anti-CD3-CD28 antibodies. Cells were treated with either 2MeSADP (100 nM), or AR-C (100 nM), or a combination of both (100 nM/100 nM) in the presence or absence of apyrase (0.2 units/ml). Apyrase did not alter cell viability in unstimulated and PHA- and CD3/CD28 stimulated cells for any of the conditions analyzed (data not shown). No significant change in relative PBMC numbers was observed in unstimulated cells when exposed to 2MeSADP or AR-C or both in the presence of apyrase at 48 h (Table 2). Interestingly, a significant decrease in relative PBMC numbers was noted in PHA- and anti-CD3/CD28- stimulated cells when in the presence of apyrase (Table 2). All the effects on relative PBMC numbers that we had observed when cells were exposed to 2MeSADP or AR-C alone and in combination in absence of apyrase were lost following apyrase exposure (Table 2) for both PHA- and anti-CD3/CD28-stimulated cells. These data suggest that apyrase inhibits PBMC proliferation and alters their response to 2MeSADP or AR-C alone and in combination. As we did not notice any change in viability, the decrease in relative cell numbers is not due to toxicity to apyrase.
Table 2.
Apyrase treatment alters relative PBMC number
| Treatment | Unstimulated (48 h) | PHA (48 h) | CD3/28 (48 Hours) |
| Negative | 1 ± 0 | 3.046 ± 0.158 | 5.517 ± 2.372 |
| Negative + Apyrase | 1 ± 0 | 1.832 ± 0.500 | 2.141 ± 0.678 |
| AR-C | 1.377 ± 0.124 | 2.863 ± 0.283 | 5.161 ± 1.599 |
| AR-C+ Apyrase | 0.962 ± 0.063 | 1.473 ± 0.339 | 1.856 ± 0.559 |
| 2MeSADP | 1.45 ± 0.136 | 3.802 ± 0.266 | 5.038 ± 1.284 |
| 2MeSADP + Apyrase | 0.948 ± 0.053 | 1.535 ± 0.360 | 1.989 ± 0.617 |
| 2MeSADP + ARC | 1.058 ± 0.102 | 3.052 ± 0.307 | 6.291 ± 1.824 |
| 2MeSADP + ARC + Apyrase | 0.963 ± 0.052 | 1.781 ± 0.547 | 2.383 ± 0.877 |
| Treatment | Unstimulated (72 h) | PHA (72 h) | CD3/28 (72 Hours) |
| Negative | 1 ± 0 | 2.399 ± 0.171 | 3.858 ± 0.467 |
| Negative + Apyrase | 1 ± 0 | 1.042 ± 0.085 | 0.827 ± 0.135 |
| AR-C | 0.977 ± 0.032 | 2.467 ± 0.419 | 3.869 ± 0.226 |
| AR-C+ Apyrase | 0.909 ± 0.025 | 0.864 ± 0.047 | 0.705 ± 0.078 |
| 2MeSADP | 1.083 ± 0.032 | 3.070 ± 0.253 | 2.957 ± 0.234 |
| 2MeSADP + Apyrase | 1.170 ± 0.151 | 0.890 ± 0.072 | 0.691 ± 0.059 |
| 2MeSADP + ARC | 0.886 ± 0.045 | 1.935 ± 0.330 | 3.826 ± 0.380 |
| 2MeSADP + ARC + Apyrase | 1.027 ± 0.011 | 0.995 ± 0.151 | 0.853 ± 0.166 |
PBMC were stimulated with anti-CD3/CD28 or PHA or without stimuli (unstimulated) for 48 or 72 h. Cells were pre-treated with 2MeSADP (100 nM), AR-C (100 nM) or 2MeSADP /AR-C (both 100 nM). Negative control did not receive any treatment. When appropriate cells were pre-treated with Apyrase (0.2 units/ml) (patter bars). Cell activity was analyzed using a WST-1 cell proliferation assay kit for unstimulated, CD3/CD28 or PHA stimulated cells. Data of the samples untreated or treated with apyrase are expressed as relative absorbance compared with unstimulated untreated cells and unstimulated untreated cells + apyrase respectively. Means ± S.E.M. are plotted (*p < 0.05, n = 5)
Next we examined the effect of apyrase exposure on proliferation of the CD4+, CD8+ and CD4+/CD25+ cell subsets at 48 and 72 h. Again, T cell subsets were not altered at any of the conditions analyzed in presence of apyrase as compared with the absence of apyrase (Fig. 3). All together, these data suggest that the effects of exposure to 2MeSADP and P2Y12 antagonism on relative T cell numbers is dependent on endogenous ADP as well as on exogenous 2MeSADP.
Fig. 3.

Apyrase treatment alters CD4+, CD8+ and CD4+/CD25+ cell populations in response to ADP and AR-C. PBMC were stimulated with anti-CD3/CD28 or PHA or without stimuli (unstimulated) for 48 h or 72 h. Cells were pre-treated with 2MeSADP (100 nM), AR-C (100 nM) or 2MeSADP /AR-C (both 100 nM). Negative control did not receive any treatment. When appropriate cells were pre-treated with Apyrase (0.2 units/ml) (patter bars). Cell populations positive to CD4 (a, b), CD8 (c, d) or CD4/CD25 (f, i) were determined using flow cytometry for unstimulated, CD3/CD28 or PHA stimulated cells. Cells were analyzed after 48 (d, e and f) and 72 (g, h and i) hours post-treatment. Data are expressed as % of expression ± S.E.M. (*p < 0.05, n = 5)
Exposure to 2MeSADP alters cell activity and CD4+, CD8+ and CD4+/CD25+ cell populations through both P2Y13-dependent and P2Y13-independent pathways at 48 and 72 h of stimulation
The ADP receptor P2Y13 has also been shown expressed in T lymphocytes (Deaglio and Robson 2011) and has a similar pharmacological profile to the receptor P2Y12 (Kim and Kunapuli 2011b; Marteau et al. 2003; von Kugelgen 2006). Therefore, we next analyzed the effects of the P2Y13 antagonist MRS2211 (MRS) on relative cell numbers and T cell subsets (Kim et al. 2005). We cultured unstimulated PBMC and PBMC stimulated with either PHA or anti-CD3/CD28 antibodies in the presence or absence of 2MeSADP (100 nM), MRS (100 nM), or a combination of 2MeSADP and MRS (100 nM/100 nM) for either 48 or 72 h.
Both 2MeSADP and MRS (alone and in combination) could increase relative T cell numbers in unstimulated cells (Table 3, P < 0.05, negative control vs 2MeSADP, negative control vs P2Y13 antagonism and negative control vs 2MeSADP + P2Y13 antagonism). Only the effect of MRS2211 alone is maintained at 72 h (P < 0.05, negative control vs P2Y13 antagonism). When cells were stimulated with PHA, MRS2211 increased relative cell numbers alone or in combination with 2MeSADP (Table 3, P < 0.05, negative control vs P2Y13 antagonism and negative control vs exposure to 2MeSADP + P2Y13 antagonism) suggesting that changes in relative cell numbers are dependent on the receptor P2Y13. The effect of MRS2211 alone is maintained at 72 h (P < 0.05, negative control vs P2Y13 antagonism). Similar results were noted when cells were stimulated with anti-CD3/28; MRS2211 increased relative cell numbers alone or in combination with 2MeSADP (Table 3, P < 0.05, negative control vs P2Y13 antagonism and negative control vs 2MeSADP + P2Y12 antagonism). However in this case the effect of MRS2211 alone is not maintained at 72 h. These data suggest that changes in relative PBMC numbers are dependent on the receptor P2Y13 in both unstimulated and stimulated cells.
Table 3.
Exposure to 2MeSADP alters relative T cell number through both P2Y13-dependent and P2Y13-independent pathways at 48 and 72 h of stimulation
| Treatment | Unstimulated (48 h) | PHA (48 h) | CD3/28 (48 Hours) |
| Negative | 1 ± 0 | 3.476 ± 0.512 | 4.044 ± 0.445 |
| 2MeSADP | 1.45 ± 0.136 | 3.073 ± 0.202 | 4.835 ± 1.460 |
| MRS2211 | 2.234 ± 0.373 * | 5.184 ± 0.646* | 7.443 ± 1.252 * |
| 2MeSADP + MRS2211 | 2.131 ± 0.422 * | 4.864 ± 0.662* | 7.369 ± 1.707* |
| Treatment | Unstimulated (72 h) | PHA (72 h) | CD3/28 (72 Hours) |
| Negative | 1 ± 0 | 3.319 ± 0.119 | 5.821 ± 0.603 |
| 2MeSADP | 1.196 ± 0.114 | 3.244 ± 0.113 | 4.849 ± 0.290 |
| MRS2211 | 1.991 ± 0.195 * | 4.845 ± 0.548 | 6.899 ± 0.586 * |
| 2MeSADP + MRS2211 | 1.417 ± 0.348 | 4.242 ± 0.544 | 6.248 ± 0.708 |
Cells were stimulated with anti-CD3/CD28 or PHA or left unstimulated for 48 or 72 h. Unstimulated cells were cultured without stimuli. Cells were pre-treated with 2MeSADP (100 nM), MRS2211 (100 nM) or 2MeSADP /MRS2211 (100 nM/100 nM). Negative control did not receive any treatment. Cell enzymatic activity was analyzed using a WST-1 cell proliferation assay kit for unstimulated, CD3/CD28 or PHA stimulated cells. Data are expressed as relative absorbance compared with unstimulated untreated cells. Means ± S.E.M. are plotted (*p < 0.05, n = 5)
Next we examined the effect of 2MeSADP and MRS2211 (alone and in combination) on relative T cell numbers of major subsets of T cells. Subset populations were analyzed using flow cytometry and identified as described in the Supplemental Fig. 1. The CD4+ and CD8+ fractions are expressed as a percentage of the whole population, while CD4 + CD25+ are expressed as a % of CD4+ cells.
After 48 h (Fig. 4a), no change in the fraction of CD4 cells was seen in unstimulated cells in all the groups analyzed. However, 2MeSADP exposure reduces the fraction of CD4 as compared to the untreated control in the PHA-stimulated culture (Fig. 4a, P < 0.05, negative control vs exposure to 2MeSADP). The effect was noted when 2MeSADP was administered alone or in combination with MRS2211 (Fig. 4a, P < 0.05, negative control vs exposure to 2MeSADP + P2Y13 antagonism), suggesting that the effect is P2Y13-independent, but depend on 2MeSADP exposure. In the anti-CD3/CD28-stimulated culture 2MeSADP alone significantly reduces the number of CD4+ cells (Fig. 4a, P < 0.05, negative control vs exposure to 2MeSADP).
Fig. 4.

Exposure to 2MeSADP alters CD4+, CD8+ and CD4+/CD25+ cell populations through both P2Y13-dependent and P2Y13-independent pathways at 48 and 72 h of stimulation. Cells were stimulated with anti-CD3/CD28 or PHA or left unstimulated for 48 or 72 h. Unstimulated cells were cultured without stimuli. Cells were pre-treated with 2MeSADP (100 nM), MRS2211 (100 nM) or 2MeSADP /MRS (100 nM/100 nM). Negative control did not receive any treatment. Cell activity was analyzed using a WST-1 cell proliferation assay kit for unstimulated (a), CD3/CD28 (b) or PHA (c) stimulated cells. Data are expressed as relative absorbance compared with unstimulated untreated cells. Cell populations positive to CD4 (d, g), CD8 (f, h) or CD4/CD25 (f, i) were determined using flow cytometry for unstimulated, CD3/CD28 or PHA stimulated cells. Cells were analyzed after 48 (d, e and f) and 72 (g, h and i) hours post-treatment. Data are expressed as % of expression ± S.E.M. (*p < 0.05, n = 5)
No change in the fraction of CD8 cells was also seen in unstimulated cells in all the groups analyzed (Fig. 4b). However 2MeSADP alone increases the fraction of CD8 cells, but its effect is lost when P2Y13 is blocked suggesting that the effect on the CD8+ fraction is P2Y13-dependent (Fig. 4b). However, the effect of P2Y13 antagonism is lost when cells were stimulated with anti-CD3/28 antibodies, suggesting that CD8+ fraction is P2Y13-dependent depending on the stimuli (Fig. 4b).
No changes were noted in the CD4+/CD25+ cell population (Fig. 4c) for the groups analyzed when cells were unstimulated. However, a significant decrease was observed in both PHA- and anti CD3/28-stimulated cells when MRS2211 were added alone or in combination with 2MeSADP (Fig. 4c, P < 0.05, negative control vs P2Y13 antagonism and negative control vs exposure to 2MeSADP + P2Y13 antagonism). These data show that P2Y13 receptor blocking demonstrated significant and differential effects on the fractions of CD4, CD8 and CD4+/CD25+ cell population in PBMC.
Seventy-two hours post-stimulation, only the ADP-induced decrease was still seen in PHA-stimulated cells (Fig. 4d, P < 0.05, negative control vs exposure to 2MeSADP), but at this time point P2Y13 antagonism did prevent a decrease in CD4+ cell population, suggesting that at 72 h this effect of ADP is independent of the receptor P2Y13.
The fraction of CD8+ cells was increased in unstimulated cells 72 h after stimulation upon 2MeSADP exposure (Fig. 4e, P < 0.05, negative control vs exposure to 2MeSADP), but no effect was noted when MRS2211 was added together. No difference was noted in the CD8+ fraction when cells were stimulated with PHA and anti-CD3/28.
A significant decrease was observed in the CD4+/CD25+ cell population in PHA- and anti-CD3/28-stimulated cells when 2MeSADP was added alone (Fig. 4f, P < 0.05, negative control vs exposure to 2MeSADP) at 72 h. However, a decrease was not noted when 2MeSADP was added together with MRS2211, suggesting that the effect of 2MeSADP on the CD4+/CD25+ cell population upon anti-CD3/CD28 stimulation are P2Y13-dependent at this time point.
Exposure to 2MeSADP changes cytokine secretion upon stimulation
Cytokine levels in the supernatant of cultured cells were also tested as a direct indicator of the immune response. The supernatant was collected 72 h after stimulation with PHA or anti-CD3/CD28. Figure 5 shows the concentration of the following cytokines: IL-2, IL-4, IL-5, IL-6, IL-10 and IFN-γ. Cytokines were not detected in the supernatants of unstimulated cells (data not shown). Cytokine concentrations were normalized to cell viability (cell viability data are shown in Supplemental Table 1). Cytokine levels were overall higher in the supernatant of anti-CD3/CD28 stimulated cells as compared with PHA-stimulated cells except for IL-6, which appeared to be similarly secreted. This difference was the most dramatic for IL-2; anti-CD3/CD28-stimulated cells actively produced it, while it was undetectable in the supernatant of PHA-stimulated cells.
Exposure to 2MeSADP decreased the levels of IL-2 and IL-4 (Fig. 5, P < 0.05, negative control vs exposure to 2MeSADP) upon anti-CD3/CD28 stimulation. On the other hand, P2Y12 antagonism did not seem to alter the levels of these cytokines by itself or in combination with 2MeSADP (Fig. 5). These data suggest that the effect of 2MeSADP on IL-2 and IL-4 secretion is P2Y12-independent. No changes were noted in IL-2 and IL-4 when cells were stimulated with PHA for any of the groups, suggesting that the effects of 2MeSADP exposure on the secretion of these cytokine are stimulus-specific. However, IL-10 secretion was diminished in anti-CD3/CD28- or PHA-stimulated cells upon exposure to 2MeSADP (Fig. 5, P < 0.05, negative control vs exposure to 2MeSADP), while P2Y12 antagonism did not seem to alter the levels of this cytokine by itself nor in combination with 2MeSADP (Fig. 5).
No changes were noted in IL-6 secretion upon anti-CD3/CD28 activation in all the groups analyzed (Fig. 5), but an increase in IL-6 levels were observed when P2Y12 was blocked in PHA-stimulated cells (Fig. 5, P < 0.05, negative control vs P2Y12 antagonism). These data suggest that blocking the P2Y12 pathways influence IL-6 production.
No changes were noted in IL-5 secretion for PHA- or anti-CD3/CD28-stimulated cells upon 2MeSADP exposure or P2Y12 antagonism (Fig. 5). No change was observed in IFN-γ secretion when cells were activated with anti-CD3/CD28, although when cells were stimulated with PHA, exposure to diminish the levels of secreted IFN-γ (Fig. 5, P < 0.05, negative control vs 2MeSADP exposure). The same effect was noted when the receptor P2Y12 was blocked, indicating that the effects of 2MeSADP exposure on IFN-γ are P2Y12−independent. Overall, these data suggest that 2MeSADP exposure alter cytokine secretion 72 h past PHA or anti-CD3/CD28 stimulation in either a P2Y12−dependent or -independent manner depending on the stimulus.
Changes in cAMP levels in stimulated PBMCs upon 2MeSADP exposure and antagonism of the receptor P2Y12
P2Y12 receptor exposure leads to inhibition of adenylyl cyclase activity hence decreasing cAMP intracellular levels (Kim and Kunapuli 2011a). Therefore, we examined the levels of cAMP in PHA-stimulated, anti-CD3/CD28-stimulated or unstimulated PBMCs upon their treatment with AR-C, 2MeSADP or both (Fig. 6). Cells were left unstimulated or stimulated for 48 h with PHA or anti-CD3/CD28. At this point the cells were incubated with AR-C for 10 min, then 2MeSADP was added for 15 min and then cAMP levels were analyzed. No difference was noted in cAMP levels between unstimulated and PHA- or anti-CD3/CD28-stimulated cells when cell remained untreated. In unstimulated cells, no difference was noted in response to either 2MeSADP or AR-C, suggesting that neither 2MeSADP exposure nor P2Y12 antagonism could alter intracellular cAMP levels. However, in cells stimulated with either anti-CD3/CD28 or PHA, 2MeSADP exposure moderately, but significantly decreases cAMP levels (P < 0.05, negative control vs. 2MeSADP exposure). This effect of 2MeSADP is not altered by P2Y12 antagonism (Fig. 6), suggesting that the effects of 2MeSADP exposure on cAMP levels may be P2Y12-independent. Furthermore, in PHA- and anti-CD3/CD28-stimulated cells incubation with AR-C alone is also capable of decreasing cAMP levels (P < 0.05, negative control vs. P2Y12 antagonism). The last finding suggests the existence of a P2Y12-independent effect of AR-C in this system.
Fig. 6.
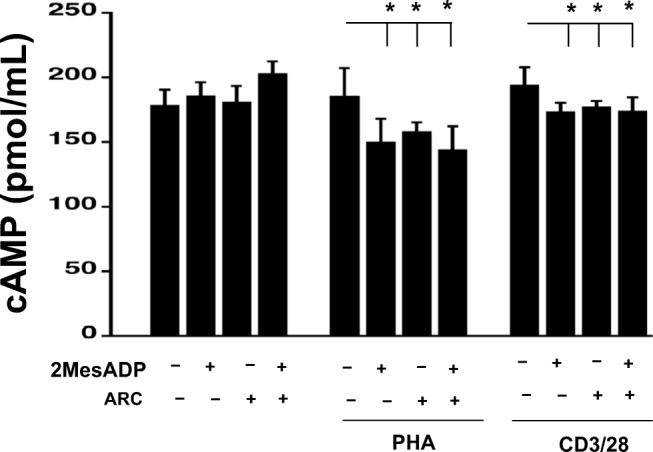
Changes in cAMP levels in stimulated PBMCs upon exposure to 2MeSADP and antagonism of the receptor P2Y12. Intracellular levels of cAMP were measured following 15-min exposure to 2MeSADP, AR-C and a combination of both in unstimulated cells and cell stimulated with PHA or anti-CD3/CD28 for 48 h. Values are expressed in pmol/mL; means ± S.E.M. are plotted (*p < 0.05, n = 4)
Discussion
Although purinergic signaling has been shown to play a determinant role in regulating T cell functions during inflammation (Cekic and Linden 2016; Eltzschig et al. 2013; Junger 2011; Sevigny et al. 2015), new information is needed to understand how purinergic signaling influences T lymphocyte responses during inflammation and through which P2Y receptor. Moreover, modulating purinergic signaling may identify new therapeutic targets for anti-inflammatory drugs (Burnstock 2018). Hence, we investigated how activation of purinergic signaling alters PBMC functions upon stimulation. We identified P2Y12 receptor as a potential target for ADP in T cells. Our results show for the first time that 2MeSADP exposure changes T cell proliferation and cytokine secretion in a time- and stimulus-specific manner. We also demonstrate that the effect of ADP is specific for CD4 and CD8 T cells. P2Y12 antagonism could alter some of these effects suggesting that T cells express a functional P2Y12.
As we observed a difference in responses to 2MeSADP exposure and P2Y12 antagonism between PHA- and anti-CD3/CD28-stimulation, it is possible that these two types of exposure result in different surface expression of purinergic receptors, including P2Y12. This observation is in line with the previous studies on another P2Y receptor, P2Y6 (Campwala et al. 2014). In the monocytic leukemia cell line, stimulation with CCL2 was dependent on the P2Y6 receptor, while fMLP stimulation was unaltered (Campwala et al. 2014). This conclusion was supported by our experiment upon P2Y13 antagonism. Unstimulated cells seem to be altered by P2Y13 antagonism, but not by P2Y12 antagonism. On the other hand, PHA-stimulated cells reacted differently to both. All together, these data indicate that the expression of the ADP receptors P2Y12 and P2Y13 is stimuli-dependent and that the ADP receptors P2Y12 and P2Y13 regulate different functions in PBMC.
Furthermore, the responses to 2MeSADP or to P2Y12 antagonism were also time-dependent, thus suggesting that the receptor pattern can vary at different time points of activation. Once activated, the receptor P2Y12 undergoes rapid agonist-induced desensitization (Hardy et al. 2005). This could also explain the change in response to ADP over time. Similar behavior was observed previously in T cells, when they were exposed to ATP, another nucleotide. That study shows that different concentrations of extracellular ATP modulate CD4+ cell activation and functions and that the effects of ATP vary depending on the activation state of CD4+ cell (Trabanelli et al. 2012). Considering this time-dependency, it would be interesting to study more time-points of exposure to PHA and anti-CD3/anti-28 antibody.
Although P2Y12 was thought to be present only in platelets (Wang et al. 2003) and microglia (Sasaki et al. 2003), there is increasing evidence supporting the importance of P2Y12 in biological functions of other cells of immune system rather than platelets. Indeed, P2Y12 mRNA has been detected in a number of human immune cells, such as lymphocytes and monocytes (Wang et al. 2004). Furthermore, 2MeSADP-induced CD45+ leukocyte migration in P2Y12-null mice was significantly decreased compared with that in wild-type controls (Harada et al. 2011). In addition, dendritic cells express P2Y12 mRNA and are functionally altered in P2Y12-null mice (Ben Addi et al. 2010). Another study showed that a physiological and pharmacological modulation of the receptor P2Y12 could influence calcium signaling in monocytes (Micklewright et al. 2018). All these data indicate the need to further investigate the role of P2Y12. We have here addressed the issue of the possible expression of a functional P2Y12 receptor in PBMC.
Thienopyridines, a class of P2Y12-specific antagonists, have been successfully used to prevent thrombus formation by inhibiting ADP-induced aggregation of platelets and consequent thrombus formation (Bhavaraju et al. 2010; Kim and Kunapuli 2011b). Further studies have shown that thienopyridines could not only prevent thrombus formation, but could also decrease inflammation in a variety of animal models, such as LPS-induced inflammation (Hagiwara et al. 2011), cecal ligation and double puncture (Liverani et al. 2016), myocardial infarction (Liu et al. 2011), and pancreatitis (Hackert et al. 2009; Liu et al. 2011). It is still unclear whether the effect of thienopyridines on inflammation levels is unique for platelets or it is directed at other cells of the immune system as well.
AR-C is a well-recognized highly selective P2Y12 antagonist. However, we have observed that AR-C influences T cell stimulation when added alone. Previous studies have shown that ticagrelor, another P2Y12 antagonist, did influence cell activation by itself in platelets and in a microglia cell line (Aungraheeta et al. 2016). The authors identified ticagrelor as an inverse agonist. Although AR-C have not shown the properties of an inverse agonist yet, the fact that AR-C could be an inverse agonist for P2Y12 receptor in PBMC appears to be a possibility. ATP/ADP is secreted by T lymphocytes during inflammation (Eltzschig et al. 2013; Rayah et al. 2012; von Kugelgen and Hoffmann 2016) hence the effects of P2Y12 antagonism may also be dependent on the constitutive ATP/ADP secretion by T cells, as when cells were pre-incubated with apyrase this effect was not noted.
Furthermore, other G protein-coupled receptors have also been previously shown to be constitutively active (Arvanitakis et al. 1998), so AR-C may act by affecting the constitutive activity of P2Y12 n T lymphocytes. In previous studies by our group (Liverani et al. 2016; Liverani et al. 2014) and others (Hagiwara et al. 2011; Qin et al. 2017), it has been demonstrated that P2Y12 antagonism or deficiency is linked to changes in circulating cytokine levels in different animal models of inflammation. The data reported here indicate that exposure to ADP can decrease the secretion of IL-4, IL-10 and INF-γ depending on the type of stimulus, but independent of the receptor P2Y12. However, P2Y12 antagonism increased IL-2 and IL-6 when cells were activated with anti-CD3/CD28 and PHA, respectively. A study focused on cytokine secretion by anti-CD3/CD28-stimulated murine T cells indicated that ADP (250 μM) could decrease secretion of IL-4, IL-6 and INF-γ after 24 h of stimulation (Shinohara and Tsukimoto 2017). On the other hand, another study (Shinohara and Tsukimoto 2017) showed that P2Y12 antagonism decreased IL-2 secretion, and this is in contrast with our current data. These discrepancies and similarities between experiments suggest that the effects of 2MeSADP exposure on cytokine secretion depend on the type of stimulus and the species of the immune host.
Upon stimulation T cells contribute to secretion of ADP that has not only a paracrine but also an autocrine effect (Eltzschig et al. 2013; Rayah et al. 2012; von Kugelgen and Hoffmann 2016). This exogenous ADP seems to be relevant for cell functions. Indeed, previous data have shown anti-inflammatory properties of apyrase (Ibrahim et al. 2015; Kronlage et al. 2010; Li et al. 2014) where apyrase treatment decreased macrophages and dendritic cells chemotaxis in vivo. We have now observed that relative T cell numbers were significantly reduced by apyrase in stimulated T cells, but not in unstimulated cells. These data suggest that the constitutive ADP secreted by T cells upon stimulation is important for cell growth.
P2Y12 receptor activation leads to the inhibition of adenylyl cyclase activity that causes a decrease in cAMP intracellular levels (Kim and Kunapuli 2011a). We analyzed cAMP levels in cells activated with PHA or anti-CD3/CD28 for 48 h. ADP exposure caused a decrease in cAMP intracellular levels, but P2Y12 antagonism alone had a similar effect. Consistent with our findings in cytokine secretion and cell differentiation, these data suggest that AR-C may exert in T cells both P2Y12-independent and P2Y12-dependent effects.
In conclusion, our data indicate for the first time that the receptor P2Y12 expressed by T lymphocyte is functional. It exerts effects on biological responses of T cells to stimulation in a time-dependent and stimulus-type-specific manner. Taken together, our results suggest that P2Y12 antagonist drugs may target not only platelets, but T lymphocyte activation as well. Notably, ADP also exerts P2Y12-independent effects on T lymphocytes that may be due to stimulation of other purinergic receptors.
Electronic supplementary material
(DOCX 22 kb)
Flow cytometric gating strategy to define T cell populations. Supplemental Fig. 2: CD4+, CD8+ and CD4+/CD25+ cell populations at time 0. The percentage of PBMC cell population was characterized at time 0. The percentage of CD4, CD8, CD4 + CD25, CD19 and CD14 (black dots) were analyzed in PBMC after isolation. The isotype control is shown in red. Data are expressed as % of expression ± S.E.M. (n = 3). Supplemental Fig. 3: Cell viability. Cell viability was determined with propidium iodide exclusion, while apoptosis was assessed as Annexin V expression. Cells negative for both were considered viable. (PPTX 205 kb)
Acknowledgments
This work was supported by the American Heart Association grant 16SDG26980003 to EL.
Abbreviations
- 2MeSADP
2-methylthio-ADP
- GPCRs
G protein-coupled receptors
- PBMCs
Peripheral blood mononuclear cells
- PBS
Phosphate-buffered saline
- PHA
Phytohemagglutinin
Footnotes
Publisher’s note
Springer Nature remains neutral with regard to jurisdictional claims in published maps and institutional affiliations.
Contributor Information
Harika Vemulapalli, Email: harikav68@gmail.com.
Samara Albayati, Email: tuj83140@temple.edu.
Viren C. Patwa, Email: viren.patwa@temple.edu
Douglas G. Tilley, Email: douglas.tilley@temple.edu
Alexander Y. Tsygankov, Email: tsygan@temple.edu
Elisabetta Liverani, Email: eliliverani@temple.edu.
References
- Arvanitakis L, Geras-Raaka E, Gershengorn MC. Constitutively signaling G-protein-coupled receptors and human disease. Trends Endocrinol Metab. 1998;9:27–31. doi: 10.1016/S1043-2760(98)00007-1. [DOI] [PubMed] [Google Scholar]
- Aungraheeta R, Conibear A, Butler M, Kelly E, Nylander S, Mumford A, Mundell SJ. Inverse agonism at the P2Y12 receptor and ENT1 transporter blockade contribute to platelet inhibition by ticagrelor. Blood. 2016;128:2717–2728. doi: 10.1182/blood-2016-03-707844. [DOI] [PMC free article] [PubMed] [Google Scholar]
- Ben Addi A, Cammarata D, Conley PB, Boeynaems JM, Robaye B. Role of the P2Y12 receptor in the modulation of murine dendritic cell function by ADP. J Immunol. 2010;185:5900–5906. doi: 10.4049/jimmunol.0901799. [DOI] [PubMed] [Google Scholar]
- Bhavaraju K, Mayanglambam A, Rao AK, Kunapuli SP. P2Y(12) antagonists as antiplatelet agents - recent developments. Curr Opin Drug Discov Devel. 2010;13:497–506. [PubMed] [Google Scholar]
- Boeynaems JM, Communi D. Modulation of inflammation by extracellular nucleotides. J Invest Dermatol. 2006;126:943–944. doi: 10.1038/sj.jid.5700233. [DOI] [PubMed] [Google Scholar]
- Broker BM, et al. Engagement of the CD4 receptor inhibits the interleukin-2-dependent proliferation of human T cells transformed by Herpesvirus saimiri. Eur J Immunol. 1994;24:843–850. doi: 10.1002/eji.1830240411. [DOI] [PubMed] [Google Scholar]
- Burnstock G. Purine and pyrimidine receptors. Cell Mol Life Sci. 2007;64:1471–1483. doi: 10.1007/s00018-007-6497-0. [DOI] [PMC free article] [PubMed] [Google Scholar]
- Burnstock G. The therapeutic potential of purinergic signalling. Biochem Pharmacol. 2018;151:157–165. doi: 10.1016/j.bcp.2017.07.016. [DOI] [PubMed] [Google Scholar]
- Campwala H, Sexton DW, Crossman DC, Fountain SJ. P2Y(6) receptor inhibition perturbs CCL2-evoked signalling in human monocytic and peripheral blood mononuclear cells. J Cell Sci. 2014;127:4964–4973. doi: 10.1242/jcs.159012. [DOI] [PMC free article] [PubMed] [Google Scholar]
- Cekic C, Linden J. Purinergic regulation of the immune system. Nat Rev Immunol. 2016;16:177–192. doi: 10.1038/nri.2016.4. [DOI] [PubMed] [Google Scholar]
- Chen CJ, Chang SJ. Purinergic signaling during inflammation. N Engl J Med. 2013;368:1260. doi: 10.1056/NEJMc1300259#SA1. [DOI] [PubMed] [Google Scholar]
- Chess L, Levine H, MacDermott RP, Schlossman SF. Immunologic functions of isolated human lymphocyte subpopulations. VI. Further characterization of the surface Ig negative, E rosette negative (null cell) subset. J Immunol. 1975;115:1483–1487. [PubMed] [Google Scholar]
- de Swart RL, et al. Mitogen and antigen induced B and T cell responses of peripheral blood mononuclear cells from the harbour seal (Phoca vitulina) Vet Immunol Immunopathol. 1993;37:217–230. doi: 10.1016/0165-2427(93)90195-a. [DOI] [PubMed] [Google Scholar]
- Deaglio S, Robson SC. Ectonucleotidases as regulators of purinergic signaling in thrombosis, inflammation, and immunity. Adv Pharmacol. 2011;61:301–332. doi: 10.1016/B978-0-12-385526-8.00010-2. [DOI] [PMC free article] [PubMed] [Google Scholar]
- Di Virgilio F, Solini A. P2 receptors: new potential players in atherosclerosis. Br J Pharmacol. 2002;135:831–842. doi: 10.1038/sj.bjp.0704524. [DOI] [PMC free article] [PubMed] [Google Scholar]
- Eltzschig HK, Sitkovsky MV, Robson SC. Purinergic signaling during inflammation. N Engl J Med. 2013;368:1260. doi: 10.1056/NEJMc1300259. [DOI] [PubMed] [Google Scholar]
- Gendaszewska-Darmach E, Maszewska M, Zaklos M, Koziolkiewicz M (2003) Degradation of extracellular nucleotides and their analogs in HeLa and HUVEC cell cultures. Acta Biochim Pol 50:973–984. https://doi.org/10.035004973 [PubMed]
- Gu BJ, Zhang WY, Bendall LJ, Chessell IP, Buell GN, Wiley JS. Expression of P2X(7) purinoceptors on human lymphocytes and monocytes: evidence for nonfunctional P2X(7) receptors. Am J Phys Cell Physiol. 2000;279:C1189–C1197. doi: 10.1152/ajpcell.2000.279.4.C1189. [DOI] [PubMed] [Google Scholar]
- Hackert T, Sperber R, Hartwig W, Fritz S, Schneider L, Gebhard MM, Werner J. P-selectin inhibition reduces severity of acute experimental pancreatitis. Pancreatology. 2009;9:369–374. doi: 10.1159/000212098. [DOI] [PubMed] [Google Scholar]
- Hagiwara S, Iwasaka H, Hasegawa A, Oyama M, Imatomi R, Uchida T, Noguchi T. Adenosine diphosphate receptor antagonist clopidogrel sulfate attenuates LPS-induced systemic inflammation in a rat model. Shock. 2011;35:289–292. doi: 10.1097/SHK.0b013e3181f48987. [DOI] [PubMed] [Google Scholar]
- Harada K, Matsumoto Y, Umemura K. Adenosine diphosphate receptor P2Y12-mediated migration of host smooth muscle-like cells and leukocytes in the development of transplant arteriosclerosis. Transplantation. 2011;92:148–154. doi: 10.1097/TP.0b013e318221d407. [DOI] [PubMed] [Google Scholar]
- Hardy AR, Conley PB, Luo J, Benovic JL, Poole AW, Mundell SJ. P2Y1 and P2Y12 receptors for ADP desensitize by distinct kinase-dependent mechanisms. Blood. 2005;105:3552–3560. doi: 10.1182/blood-2004-07-2893. [DOI] [PubMed] [Google Scholar]
- Hasham MG, Tsygankov AY. Tip, an Lck-interacting protein of Herpesvirus saimiri, causes Fas- and Lck-dependent apoptosis of T lymphocytes. Virology. 2004;320:313–329. doi: 10.1016/j.virol.2003.11.032. [DOI] [PubMed] [Google Scholar]
- Hoffman JF, Dodson A, Wickrema A, Dib-Hajj SD. Tetrodotoxin-sensitive Na+ channels and muscarinic and purinergic receptors identified in human erythroid progenitor cells and red blood cell ghosts. Proc Natl Acad Sci U S A. 2004;101:12370–12374. doi: 10.1073/pnas.0404228101. [DOI] [PMC free article] [PubMed] [Google Scholar]
- Ibrahim M, Wang X, Puyo CA, Montecalvo A, Huang HJ, Hachem RR, Andreetti C, Menna C, Chen R, Krupnick AS, Kreisel D, Rendina EA, Gelman AE. Human recombinant apyrase therapy protects against canine pulmonary ischemia-reperfusion injury. J Heart Lung Transplant. 2015;34:247–253. doi: 10.1016/j.healun.2014.09.034. [DOI] [PMC free article] [PubMed] [Google Scholar]
- Idzko M, Ferrari D, Riegel AK, Eltzschig HK. Extracellular nucleotide and nucleoside signaling in vascular and blood disease. Blood. 2014;124:1029–1037. doi: 10.1182/blood-2013-09-402560. [DOI] [PMC free article] [PubMed] [Google Scholar]
- Ingall AH, Dixon J, Bailey A, Coombs ME, Cox D, McInally J, Hunt SF, Kindon ND, Teobald BJ, Willis PA, Humphries RG, Leff P, Clegg JA, Smith JA, Tomlinson W. Antagonists of the platelet P2T receptor: a novel approach to antithrombotic therapy. J Med Chem. 1999;42:213–220. doi: 10.1021/jm981072s. [DOI] [PubMed] [Google Scholar]
- Jacob F, Perez Novo C, Bachert C, Van Crombruggen K. Purinergic signaling in inflammatory cells: P2 receptor expression, functional effects, and modulation of inflammatory responses. Purinergic Signal. 2013;9:285–306. doi: 10.1007/s11302-013-9357-4. [DOI] [PMC free article] [PubMed] [Google Scholar]
- Junger WG. Immune cell regulation by autocrine purinergic signalling. Nat Rev Immunol. 2011;11:201–212. doi: 10.1038/nri2938. [DOI] [PMC free article] [PubMed] [Google Scholar]
- Kaczmarek-Hajek K, Lorinczi E, Hausmann R, Nicke A. Molecular and functional properties of P2X receptors--recent progress and persisting challenges. Purinergic Signal. 2012;8:375–417. doi: 10.1007/s11302-012-9314-7. [DOI] [PMC free article] [PubMed] [Google Scholar]
- Kim S, Kunapuli SP (2011) P2Y12 receptor in platelet activation. Platelets 22:56–60. 10.3109/09537104.2010.497231 [DOI] [PubMed]
- Kim YC, Lee JS, Sak K, Marteau F, Mamedova L, Boeynaems JM, Jacobson KA. Synthesis of pyridoxal phosphate derivatives with antagonist activity at the P2Y13 receptor. Biochem Pharmacol. 2005;70:266–274. doi: 10.1016/j.bcp.2005.04.021. [DOI] [PMC free article] [PubMed] [Google Scholar]
- Kronlage M, et al. Autocrine purinergic receptor signaling is essential for macrophage chemotaxis. Sci Signal. 2010;3:ra55. doi: 10.1126/scisignal.2000588. [DOI] [PubMed] [Google Scholar]
- Layhadi JA, Turner J, Crossman D, Fountain SJ. ATP evokes Ca(2+) responses and CXCL5 secretion via P2X4 receptor activation in human monocyte-derived macrophages. J Immunol. 2018;200:1159–1168. doi: 10.4049/jimmunol.1700965. [DOI] [PMC free article] [PubMed] [Google Scholar]
- Li P, Cao J, Chen Y, Wang W, Yang J. Apyrase protects against allergic airway inflammation by decreasing the chemotactic migration of dendritic cells in mice. Int J Mol Med. 2014;34:269–275. doi: 10.3892/ijmm.2014.1771. [DOI] [PubMed] [Google Scholar]
- Liu Y, et al. Novel role of platelets in mediating inflammatory responses and ventricular rupture or remodeling following myocardial infarction. Arterioscler Thromb Vasc Biol. 2011;31:834–841. doi: 10.1161/ATVBAHA.110.220467. [DOI] [PubMed] [Google Scholar]
- Liverani E, McLeod JD, Paul C. Adrenomedullin receptors on human T cells are glucocorticoid-sensitive. Int Immunopharmacol. 2012;14:75–81. doi: 10.1016/j.intimp.2012.06.011. [DOI] [PubMed] [Google Scholar]
- Liverani E, Rico MC, Yaratha L, Tsygankov AY, Kilpatrick LE, Kunapuli SP. LPS-induced systemic inflammation is more severe in P2Y12 null mice. J Leukoc Biol. 2014;95:313–323. doi: 10.1189/jlb.1012518. [DOI] [PMC free article] [PubMed] [Google Scholar]
- Liverani E, Rico MC, Tsygankov AY, Kilpatrick LE, Kunapuli SP. P2Y12 receptor modulates sepsis-induced inflammation. Arterioscler Thromb Vasc Biol. 2016;36:961–971. doi: 10.1161/ATVBAHA.116.307401. [DOI] [PMC free article] [PubMed] [Google Scholar]
- Marteau F, le Poul E, Communi D, Communi D, Labouret C, Savi P, Boeynaems JM, Gonzalez NS. Pharmacological characterization of the human P2Y13 receptor. Mol Pharmacol. 2003;64:104–112. doi: 10.1124/mol.64.1.104. [DOI] [PubMed] [Google Scholar]
- Micklewright JJ, Layhadi JA, Fountain SJ. P2Y12 receptor modulation of ADP-evoked intracellular Ca(2+) signalling in THP-1 human monocytic cells. Br J Pharmacol. 2018;175:2483–2491. doi: 10.1111/bph.14218. [DOI] [PMC free article] [PubMed] [Google Scholar]
- Qin C, et al. Critical role of P2Y12 receptor in regulation of Th17 differentiation and experimental autoimmune encephalomyelitis pathogenesis. J Immunol. 2017;199:72–81. doi: 10.4049/jimmunol.1601549. [DOI] [PubMed] [Google Scholar]
- Rayah A, Kanellopoulos JM, Di Virgilio F. P2 receptors and immunity. Microbes Infect. 2012;14:1254–1262. doi: 10.1016/j.micinf.2012.07.006. [DOI] [PMC free article] [PubMed] [Google Scholar]
- Sak K, Boeynaems JM, Everaus H. Involvement of P2Y receptors in the differentiation of haematopoietic cells. J Leukoc Biol. 2003;73:442–447. doi: 10.1189/jlb.1102561. [DOI] [PubMed] [Google Scholar]
- Sasaki Y, Hoshi M, Akazawa C, Nakamura Y, Tsuzuki H, Inoue K, Kohsaka S. Selective expression of Gi/o-coupled ATP receptor P2Y12 in microglia in rat brain. Glia. 2003;44:242–250. doi: 10.1002/glia.10293. [DOI] [PubMed] [Google Scholar]
- Sevigny J, Martin-Satue M, Pintor J. Purinergic signalling in immune system regulation in health and disease. Mediat Inflamm. 2015;2015:106863. doi: 10.1155/2015/106863. [DOI] [PMC free article] [PubMed] [Google Scholar]
- Shinohara Y, Tsukimoto M. Adenine nucleotides attenuate murine T cell activation induced by concanavalin A or T cell receptor stimulation. Front Pharmacol. 2017;8:986. doi: 10.3389/fphar.2017.00986. [DOI] [PMC free article] [PubMed] [Google Scholar]
- Sullivan KE, Cutilli J, Piliero LM, Ghavimi-Alagha D, Starr SE, Campbell DE, Douglas SD. Measurement of cytokine secretion, intracellular protein expression, and mRNA in resting and stimulated peripheral blood mononuclear cells. Clin Diagn Lab Immunol. 2000;7:920–924. doi: 10.1128/CDLI.7.6.920-924.2000. [DOI] [PMC free article] [PubMed] [Google Scholar]
- Trabanelli S, et al. Extracellular ATP exerts opposite effects on activated and regulatory CD4+ T cells via purinergic P2 receptor activation. J Immunol. 2012;189:1303–1310. doi: 10.4049/jimmunol.1103800. [DOI] [PubMed] [Google Scholar]
- von Kugelgen I. Pharmacological profiles of cloned mammalian P2Y-receptor subtypes. Pharmacol Ther. 2006;110:415–432. doi: 10.1016/j.pharmthera.2005.08.014. [DOI] [PubMed] [Google Scholar]
- von Kugelgen I, Hoffmann K. Pharmacology and structure of P2Y receptors. Neuropharmacology. 2016;104:50–61. doi: 10.1016/j.neuropharm.2015.10.030. [DOI] [PubMed] [Google Scholar]
- Wang L, Ostberg O, Wihlborg AK, Brogren H, Jern S, Erlinge D. Quantification of ADP and ATP receptor expression in human platelets. J Thromb Haemost. 2003;1:330–336. doi: 10.1046/j.1538-7836.2003.00070.x. [DOI] [PubMed] [Google Scholar]
- Wang L, Jacobsen SE, Bengtsson A, Erlinge D. P2 receptor mRNA expression profiles in human lymphocytes, monocytes and CD34+ stem and progenitor cells. BMC Immunol. 2004;5:16. doi: 10.1186/1471-2172-5-16. [DOI] [PMC free article] [PubMed] [Google Scholar]
Associated Data
This section collects any data citations, data availability statements, or supplementary materials included in this article.
Supplementary Materials
(DOCX 22 kb)
Flow cytometric gating strategy to define T cell populations. Supplemental Fig. 2: CD4+, CD8+ and CD4+/CD25+ cell populations at time 0. The percentage of PBMC cell population was characterized at time 0. The percentage of CD4, CD8, CD4 + CD25, CD19 and CD14 (black dots) were analyzed in PBMC after isolation. The isotype control is shown in red. Data are expressed as % of expression ± S.E.M. (n = 3). Supplemental Fig. 3: Cell viability. Cell viability was determined with propidium iodide exclusion, while apoptosis was assessed as Annexin V expression. Cells negative for both were considered viable. (PPTX 205 kb)