Abstract
Purpose: As pathology departments around the world contemplate digital microscopy for primary diagnosis, making an informed choice regarding display procurement is very challenging in the absence of defined minimum standards. In order to help inform the decision, we aimed to conduct an evaluation of displays with a range of technical specifications and sizes.
Approach: We invited histopathologists within our institution to take part in a survey evaluation of eight short-listed displays. Pathologists reviewed a single haematoxylin and eosin whole slide image of a benign nevus on each display and gave a single score to indicate their preference in terms of image quality and size of the display.
Results: Thirty-four pathologists took part in the display evaluation experiment. The preferred display was the largest and had the highest technical specifications (11.8-MP resolution, maximum luminance). The least preferred display had the lowest technical specifications (2.3-MP resolution, maximum luminance). A trend was observed toward an increased preference for displays with increased luminance and resolution.
Conclusions: This experiment demonstrates a preference for large medical-grade displays with the high luminance and high resolution. As cost becomes implicated in procurement, significantly less expensive medical-grade displays with slightly lower technical specifications may be the most cost-effective option.
Keywords: digital pathology, display, whole slide image, monitor
1. Background
For over a decade, digital microscopy has been an essential tool in pathological research. However, the transition to use within the clinical setting for primary diagnosis has been slow, largely due to patient safety concerns. As research into digital pathology for primary diagnosis has increased over the past few years alleviating many concerns, many centers around the world are now aspiring to become digital. Digital pathology is now being viewed as an essential clinical tool for modern pathology services.
The Histopathology Department within Leeds Teaching Hospitals NHS Trust is in the process of undergoing full adoption of digital pathology across all subspecialties.1 A key issue when undertaking full adoption of digital pathology is the need to decide appropriate displays for pathologists. Unfortunately, there is little research on the topic, resulting in an absence of published guidelines outlining minimum display standards from relevant government bodies. As far as we are aware, there is only one research paper evaluating different computer displays for primary diagnosis in digital pathology, which is authored by our group.2 This paper concludes that screens with greater resolution speeds up low-power assessment of whole slide images (WSIs). In this paper, as well as in Ref. 2, resolution is referred to as the number of vertical and horizontal pixels displayed by a monitor.
In addition, we have conducted a number of experiments in the course of developing the Leeds Virtual Microscope, which culminated in the use a 6.7-MP Barco Coronis Fusion medical-grade display alongside a 3.1-MP Barco Nio display (Barco, Kortrijk, Belgium).3 Despite there being a paucity of research, initial guidance has recently been released from the Royal College of Pathologists, highlighting the importance of the display when reporting digitally as well as the need for pathologists to be aware that displays with differing technical specifications can affect the appearance of the WSI.4
By contrast, there are extensive guidelines and minimum standards for displays in digital radiology, outlined in the Summary of Guidance from the Institute of Physics and Engineering in Medicine 2005 (IPEM)5 and picture archiving and communication systems (PACS) guidance from the Royal College of Radiologists.6,7 Within the subset of physical parameters alone within the IPEM guidelines, there are minimum requirements for image display monitor condition, grayscale contrast ratio, distance and angle calibration, resolution, grayscale drift, digital imaging and communications in medicine grayscale calibration, uniformity, and variation between monitors and room illumination. Within the PACS guidelines, there are minimum requirements for screen resolution, screen size, maximum luminance, luminance ratio, grayscale calibration, grayscale bit depth, and video display interface.
In the absence of defined minimum standards for displays for primary diagnosis using digital pathology, decisions regarding display purchase are challenging. There are many factors that require due consideration. First, the image quality, encompassing resolution, contrast ratio, and luminance need to be considered. A high-resolution display, e.g., one with a large number of horizontal and vertical pixels will result in a clearer or crisper image containing more detail, than one with a lower number of horizontal and vertical pixels, provided the physical size remains approximately the same. This can raise confusion if the pixel numbers remain the same, yet the physical size differs, as this alters the dots per inch, which is a better measure of resolution. Contrast ratio is defined as a ratio of the darkest color a display can produce (black) and the lightest color (white). A higher contrast ratio display will afford better subtle detail discrimination. Luminance is defined as the luminance intensity per unit area of light travelling in a given angle and may loosely be considered as the “brightness” of the display.
Given that many lessons can be learnt from digital radiology,8 the hypothesis that image quality of the display is likely to impact user performance in digital pathology2 would be reasonable since this has been found to be true in digital radiology. This has been supported by research in digital radiology that higher display resolution results in greater diagnostic accuracy.9,10 As such, displays for digital radiological diagnosis require a minimum resolution of 2 mega pixels (MP) for most diagnostic tasks, as stipulated in the IPEM guidelines5 and guidance from The Royal College of Radiologists.6 The exception being plain film x-ray, necessitating a 3-MP display, and mammography, which requires the use of 5-MP displays with a maximum pixel pitch of 0.17 mm. Moreover, the recommendation is that the display matrix size should be as close to the raw image data as possible. If this recommendation was to be extrapolated to digital pathology, then it is arguable that only very high-resolution displays should be considered.11
Second, physical size and logistical positioning of the display within the pre-existing pathologist office should not be overlooked. The challenges with digital pathology are that the image datasets have a higher native resolution than can be physically displayed 1:1, unlike in radiology where the native image size and physical screen size can allow 1:1 pixel display. Having a larger display in digital pathology allows easier magnification and consequently fewer segments required to cover the whole image at a native 1:1 pixel display. Having lower resolution displays will require more panning of the dataset in order to realize the same physical coverage at native resolution. In digital radiology, there are guidelines and minimum requirements of the physical screen size with PACS and the Imaging Informatics Group stating a minimum size of 17 inches and a recommendation of equal or greater than 20 inches.7 Of note, there is no upper limit for size of the display in digital radiology.
Third, the cost of the displays is also very important in modern healthcare, where there is growing demand and limited capacity. There is a significant difference in the cost of displays, from very cheap consumer grade desktop displays approximately (£200 / $260) to recently released medical-grade displays costing up to £30,000 (approximately $). It is inevitable that cost will be a key factor when deciding which displays to purchase. The issue of cost is also discussed in the Royal College of Radiologists guidance,6 appreciating that medical-grade displays are considerably more expensive than their consumer grade alternatives. However, due to inferior lifetime display characteristics with consumer-grade displays (increased luminance and contrast ratio deterioration with time), alongside self-calibration and quality control for the expected display lifetime with medical-grade displays, the use of consumer-grade displays should be “carefully considered” when used for primary diagnosis.
In the absence of defined minimum standards, we aimed to conduct a survey evaluation of short-listed displays by pathologists within our department, to inform the purchase of displays for primary diagnosis in digital pathology within Leeds Teaching Hospitals NHS Trust.
2. Methods
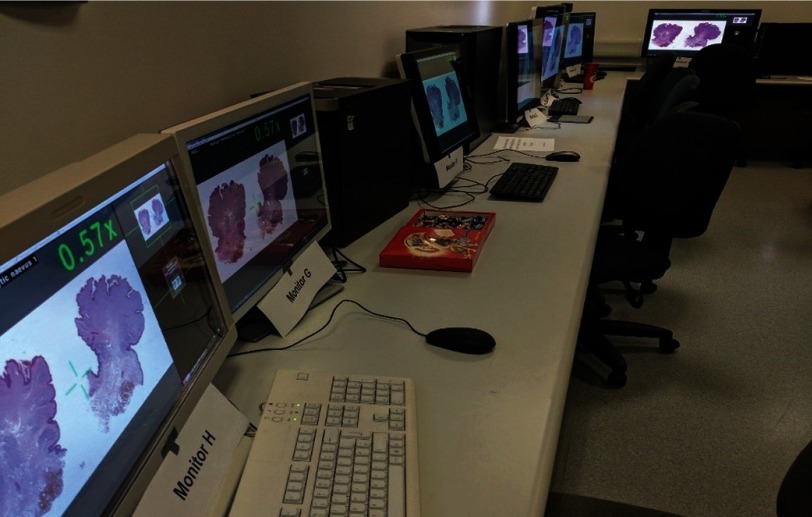
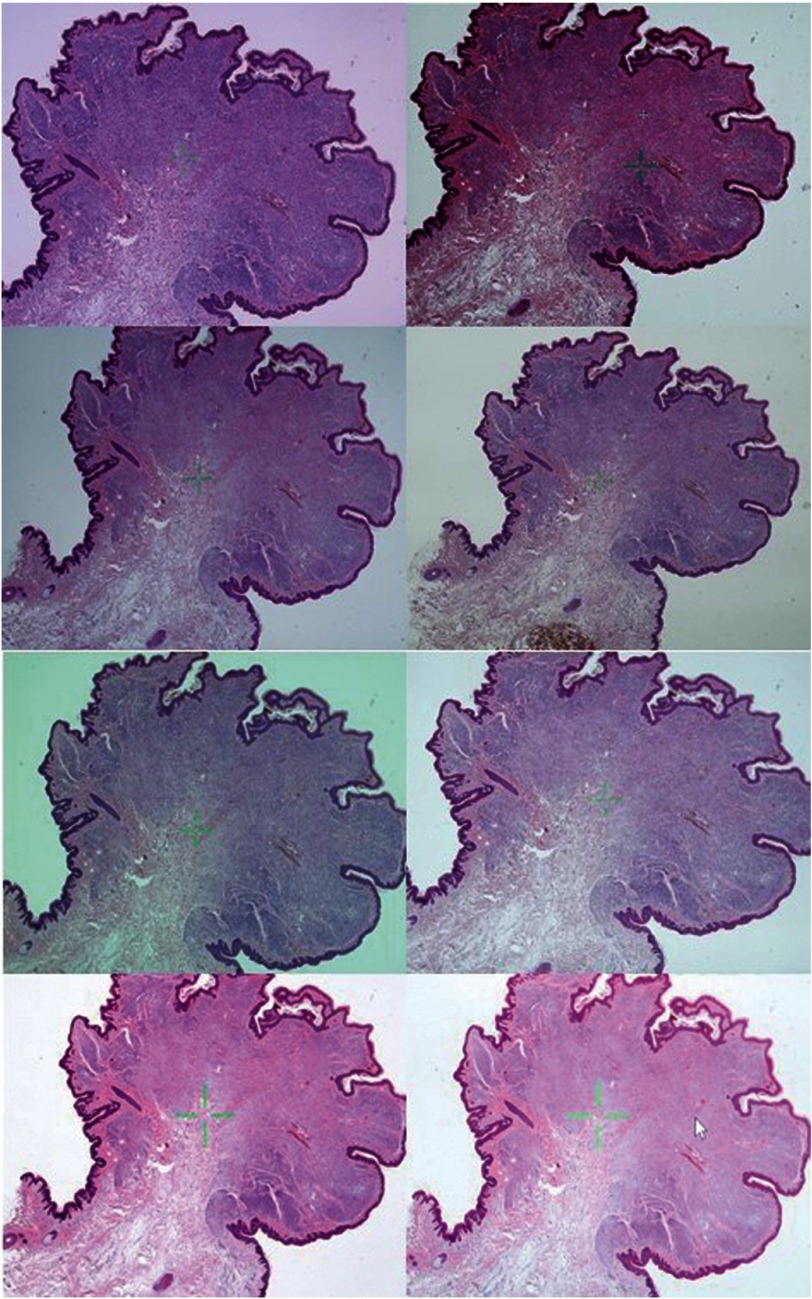
We performed a thorough search of the available displays for purchase in May 2017. After reviewing the specifications of displays, we chose a short-list of eight displays covering a range of technical specifications in terms of resolution, luminance, color contrast ratio, and physical size. Five displays were medical grade, two were professional grade, and one was consumer grade. Medical-grade displays are those that are marketed and manufactured as a medical device and must conform to appropriate guidelines/approvals, e.g., CE medical mark, Medicines and Healthcare Products Regulatory Agency or Food and Drug Administration (FDA).12 Professional displays are those that are designed for specialist use (e.g., gaming/photography), and consumer grade are those that are readily available and are designed for general use. The published technical specifications of the displays short-listed for inclusion in the study can be seen in Table 1.Each display was set-up within the same window-less room, to remove the effect of natural light. Where possible, computer displays were angled to ensure no significant reflections from ceiling lights. Artificial lighting remained constant throughout the experiment, at normal light levels within a pathology department approximately (). The display set-up can be seen in Fig. 1. All vendors were invited to provide guidance on optimal display settings for this evaluation; however, no responses were obtained perhaps due to lack of evidence in this area. Consequently, each display was adjusted in order to optimize the presentation of the SMPTE test pattern.12 An SMPTE pattern was created using bespoke in-house software that can generate the pattern to a specified resolution. For each monitor, the SMPTE was generated to display at the native resolution of the monitor at a 1:1 pixel ratio. Once the displays were adequately adjusted, measurements of luminance, contrast ratio, and uniformity were made. The range of parameters that could be adjusted on each monitor varied significantly between brand, category, and price bracket, with some monitors offering a wider range of adjustments than others. The settings that were adjusted included built-in display curve, set luminance, color temperature, brightness, and contrast. The display settings were adjusted to be as consistent as possible by two medical physicists (authors C. M. and D. B.) who are experienced in display calibration. The variation of color between displays after optimization can be seen in Fig. 2. In addition to the SMPTE test pattern, a series of test patterns from the American Association of Physicists in Medicine13 were used to carry out quantitative measurements of display luminance, contract ratio, and display uniformity.
Table 1.
Published technical specifications of the short-listed displays.
| Monitor | Category | Panel type | Screen size (inches) | Resolution (MP) | Max luminance (cd/m²) | Contrast ratio |
|---|---|---|---|---|---|---|
| A | Medical | LCD | 31.1 | 8.8 | 850 | 1450:1 |
| B | Professional | LCD | 31.1 | 8.8 | 350 | 1500:1 |
| C | Professional | LCD | 32 | 8.3 | 350 | 1000:1 |
| D | Medical | LCD | 33.6 | 11.8 | 2100 | 1200:1 |
| E | Medical | LCD | 30.4 | 6.7 | 1050 | 1500:1 |
| F | Medical | LCD | 21.3 | 5.8 | 1000 | 1400:1 |
| G | Consumer | LCD | 24 | 2.3 | 300 | 1000:1 |
| H | Medical | OLED | 24.5 | 2.1 | 275 (measured) | Infinite |
Fig. 1.
The evaluation set-up. Each of the displays was set-up within a window-less room with fixed artificial lighting. The same WSI was shown on each display for side-by-side comparison.
Fig. 2.
The appearance of the WSI of the benign intradermal nevus on each of the displays. The top left is monitor A, top right is monitor B, etc. Despite attempts to standardize appearance of the WSI in terms of color, the ability to do so was limited by the technical specifications of each display. In particular, the color of the WSI of monitor B was much darker than the other displays. To ensure accurate comparison between images of different displays, these photographs were taken with a fixed International Organization for Standardization (ISO), aperture and shutter speed.
All luminance measurements were taken using a calibrated Unfors Xi lightmeter after all the monitors were given a minimum of 30 min to warm up sufficiently. The TG18-LN01 and TG18-LN18 patterns were used to measure peak black and peak white values, respectively, in order to calculate measured peak luminance. The peak white value [measured peak luminance ()] is shown in Table 2. The ratio of the values measured for peak black and peak white provided the contrast ratio of the monitor, also shown in Table 2. The TG18-UN10 and TG18-UN80 patterns were used to carry out a subjective appraisal of display uniformity. These were visually assessed to check the displays for any gross artifacts (banding, light bleeding, pixel dropout, etc.). None of the displays exhibited any of these artifacts.
Table 2.
Measured luminance, contrast ratio, and display uniformity using a Unfors Xi light meter, for each of the displays after experiment configuration.
| Monitor | Measured peak luminance () | Measured contrast ratio | Measured display uniformity (10% luminance) |
|---|---|---|---|
| A | 624 | 1299:1 | 8.7 |
| B | 232 | 1219.1 | 5.18 |
| C | 310 | 911:1 | 15.72 |
| D | 896 | 1400:1 | 6.96 |
| E | 670 | 1290:1 | 4.2 |
| F | 545 | 1515:1 | 12.43 |
| G | 329 | 632:1 | 9.14 |
| H | 275 | 3441:1 | 2.99 |
A quantitative assessment of display uniformity was carried out by making measurements of the TG18-UNL10 test pattern. This is a uniform grayscale pattern displayed at a 10% luminance level. Measurements were made at the center and the periphery (five measurements in total) as indicated on the test pattern and the maximum () and minimum () luminance values are used to calculate the percentage uniformity () using the following equation:
It was noted there was some disparity with the measured values for peak luminance and contrast ratio versus the claimed specifications of the manufacturers. All monitors showed a lower peak luminance compared with the claimed specification except for monitor G, which surprisingly produced a measured luminance value higher than that specified in the technical documentation (329 versus ). Furthermore, two of the monitors on trial (monitors D and F) produced contrast ratios that exceeded the stated specification. The differences between the claimed and measured values are not entirely unexpected, however, as often some technical aspects of a monitor’s performance are derived in controlled conditions, or using specific display curves, which do not necessarily reflect how they would be used in “real-life” scenarios or indeed in this trial. For instance, a monitor may achieve a maximum luminance of in lab conditions but in practice it would not be used in this manner as image contrast would be compromised. Overall, it was observed that monitors that claimed to have higher luminance/contrast ratios were shown to have higher measured luminance/contrast ratios than the lower specification monitors, after they were configured for the experiment by the two medical physicists.
We designed the evaluation to include a quick subjective assessment by pathologists of each of the eight screens according to their preference for image quality and physical size. We chose the assessment to include one haematoxylin and eosin (H&E) stained WSI of average quality scanned on a Leica Aperio AT2 (Milton Keynes, UK) digital slide scanner at objective, showing a benign intradermal nevus.
We also designed a separate, second evaluation for selected participants. These participants assessed two H&E stained slides including the benign intradermal nevus (as in the general evaluation), as well as a further H&E stained slide of a micrometastasis of breast ductal carcinoma within an axillary lymph node, one human epidermal growth factor receptor 2 (HER2) haematoxylin-diaminobenzidine (H-DAB) stained slide of control breast tissue, and one papanicolaou (PAP) stained slide of a cervical spin showing severe dyskaryosis.
The survey questionnaires used visual analogue scales (VAS) from 0 to 100. Each participant was asked to score using a straight line on each of the scales for each of the displays to indicate their preference (0 = the worst possible screen for digital pathology; 100 = the best possible screen for digital pathology). We decided to use the metric of “professional preference” for this evaluation, as it may be considered a surrogate for the “fitness for purpose” of a display. There was also the option of writing comments for the study authors. An example of the VAS used can be seen in Fig. 3. Participants were able to pan and zoom as they so desired. Time limits were not imposed.
Fig. 3.
An example of the 10-cm VAS used for preference scoring by participants (not to scale). The far-left hand of the scale indicated “the worst possible screen for diagnostic digital pathology” and the far-right hand of the scale indicated “the best possible screen for diagnostic digital pathology.” Participants were asked to indicate where on the scale their preference lay for each monitor (separate scale per monitor) by drawing a vertical line. Scores were calculated by measuring with a ruler from the far-left hand side of the scale to the point the participant had drawn.
All logos on the displays were concealed from the participants, and anonymized monitor letters were used in order to remove the effect of prior preference, as can be seen in Fig. 1. The users were also not aware of the technical specifications or cost of the displays.
An email was sent to all histopathology trainees and consultants within Leeds Teaching Hospitals NHS Trust, inviting them to take part in the evaluation. Consultant pathologists were those who have completed their specialist training in histopathology in the United Kingdom (5-year minimum duration) and were registered as a fully qualified histopathologist with the Royal College of Pathologists. Trainee pathologists were junior doctors, who were currently undertaking their specialist training in histopathology. The evaluation took place over a period of 1 week in May 2017, over four separate 1 h “open sessions” during which participants were able to come and complete the evaluation.
Understandably, there is a wide variation in cost of the displays included in this experiment, with the most expensive display having a published cost of 60 times that of the cheapest display. To evaluate the benefit of the displays with respect to the cost, we conducted a cost: benefit analysis. Given the substantial variation in cost between displays and a preference score of 0 to 100, we decided to use the cost ranking (CR) from 1 to 8 and preference ranking (PR) from 1 to 8 in this analysis. Weightings were the relative importance of cost and preference with respect to each other. We used the following equation to calculate the cost-preference (C-P) score:
Ethical approval for this work was obtained from Leeds West LREC 10-H1307-12.
Data were analyzed using STATA version 15.1. Significance was set at . Means and 95% confidence intervals are presented. Correlations were performed using Pearson’s correlation coefficient. Means were compared using one-way ANOVA with Bonferroni correction for multiple comparisons. Linear regression was used to estimate associations between technical parameters and score.
3. Results
A total of 34 pathologists took place in the general evaluation of the single H&E slide (21 consultants and 13 trainees). Four participants took part in the selected evaluation (two pathologists and two medical physicists). The medical physicists were expert scientists in medical imaging.
For the H&E evaluation, the mean score for each display is shown in Table 3. Overall, the preferred display was monitor D (preferred by 22/34 of participants), with a large display size (33.6 inches), high resolution (11.8 MP), high maximum luminance (), and high contrast ratio (1200:1).
Table 3.
Overall mean scores for each display for both the general and selected evaluation. The general evaluation involved a single haematoxylin and eosin (H&E) stained slide. The monitors have been ranked according to preference within the general evaluation. The selected evaluation involved two H&E stained slides, one human epidermal growth factor receptor 2 haematoxylin-diaminobenzidine stained slide of control breast tissue, and one papanicolaou stained slide.
| Monitor | General evaluation (n = 34) | Selected evaluation (n = 4) | ||||
|---|---|---|---|---|---|---|
| All pathologists (n = 34) | Consultants (n = 21) | Trainees (n = 13) | H&E | H-DAB | PAP | |
| D | 81 | 82 | 80 | 95 | 82 | 89 |
| A | 68 | 69 | 74 | 82 | 78 | 71 |
| C | 66 | 62 | 72 | 57 | 51 | 53 |
| E | 64 | 61 | 67 | 79 | 70 | 69 |
| F | 55 | 55 | 52 | 62 | 62 | 60 |
| H | 47 | 44 | 47 | 38 | 61 | 56 |
| B | 45 | 39 | 56 | 21 | 25 | 23 |
| G | 41 | 38 | 43 | 34 | 36 | 18 |
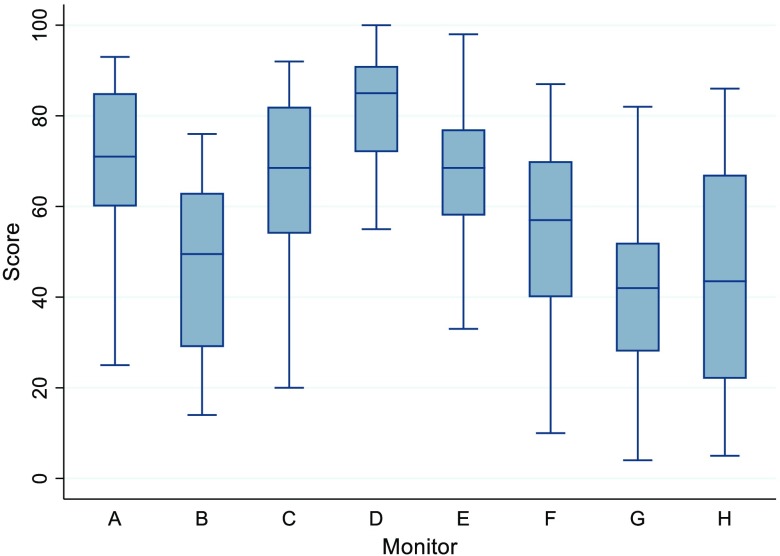
The overall mean scores and associated confidence intervals for all pathologists in the general evaluation can be seen in Fig. 4.
Fig. 4.
Overall scores by display, including all pathologists in the general evaluation.
There were no statistical differences in preference scores between consultants and trainees, except for monitor B, which was preferred more by trainees than consultants (). The consultants and trainee scores were positively correlated, with a Pearson’s correlation coefficient of 0.904 ().
Monitor D was also the most preferred display for H-DAB and PAP slides as determined by the selected participants. The least preferred display for H-DAB was monitor B, whereas monitor G was the least preferred display for the PAP assessment. The results of the H-DAB and PAP evaluation were positively correlated with the results of the H&E assessment (Pearson’s correlation coefficient 0.923 and 0.915, respectively).
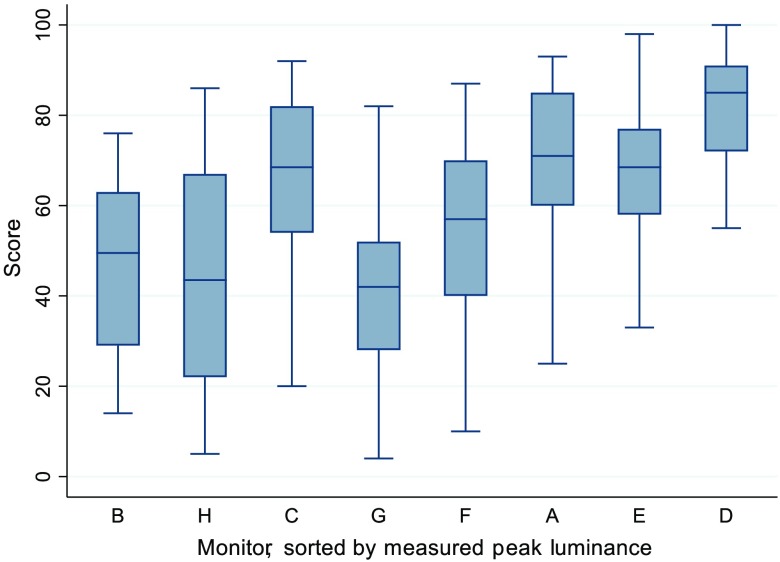
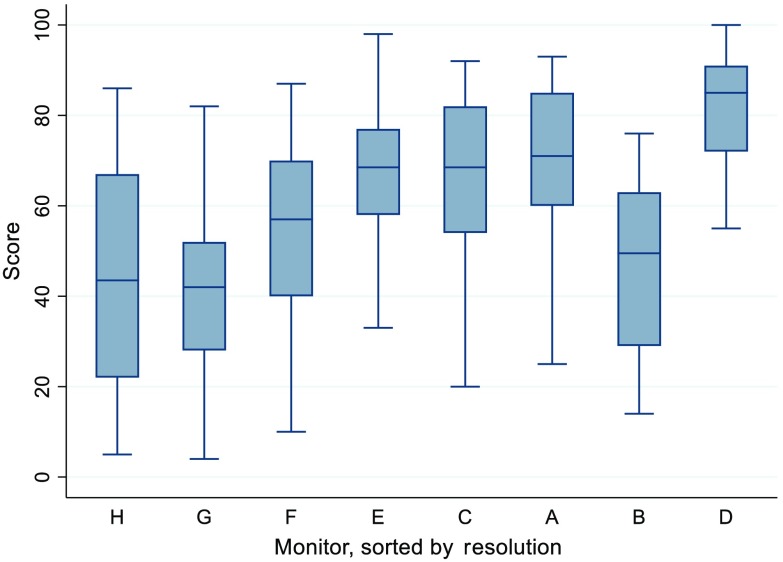
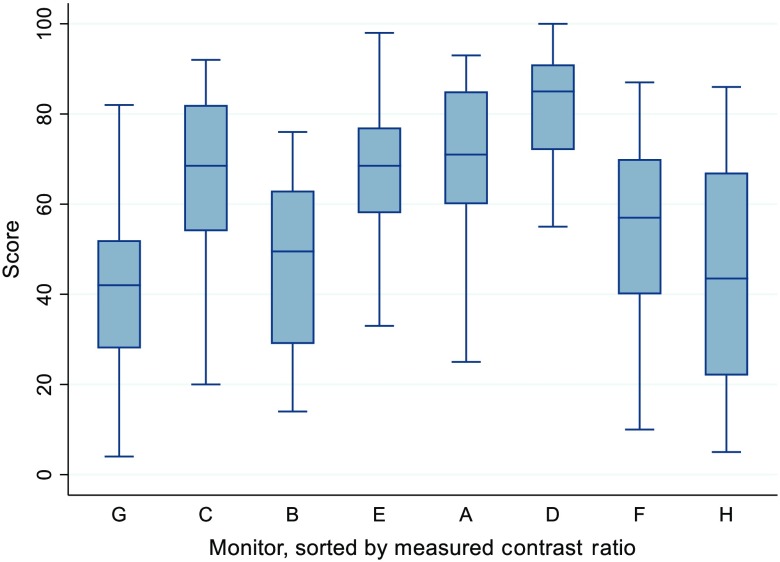
There is a trend for an increase in score as measured peak luminance rises. This can be seen in Fig. 5, where the monitors have been sorted according to peak luminance. Additionally, as resolution increased, so did the score. This can be seen in Fig. 6, where the monitors have been sorted according to peak resolution. In terms of contrast ratio, scores did not seem to increase with increases in contrast ratio, as can be seen in Fig. 7.
Fig. 5.
Graphical representation of the scores for each monitor, sorted by measured peak luminance, low to high, left to right. The monitor with the lowest peak luminance (monitor B) is at the far left, whereas the monitor with the highest luminance (monitor D) is on the far right. This indicates that as measured peak luminance increases, the score generally increases.
Fig. 6.
Graphical representation of the scores for each monitor, sorted by the reported resolution in megapixels, low to high, left to right. The monitor with the lowest resolution (monitor H) is at the far left, whereas the monitor with the highest resolution (monitor D) is on the far right. This indicates that as measured peak resolution increases, the score generally increases.
Fig. 7.
Graphical representation of the scores for each monitor, sorted by the measured contrast ratio, low to high, left to right. The monitor with the lowest contrast ratio (monitor G) is at the far left, whereas the monitor with the highest contrast ratio (monitor H) is on the far right. This indicates that as measured contrast ratio increases, this does not seem to increase the score.
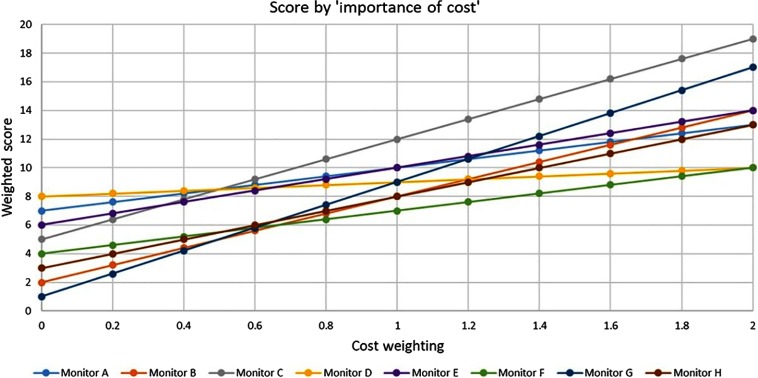
The results of the cost:benefit analysis can be seen in Fig. 8. The cost weighting on the axis is a measure of the “importance of cost,” as compared to a fixed preference weighting of 1. At a cost weighting of “0,” cost is not implicated in the score and instead reflects pure preference. At a weighting of “1,” cost is as important as preference. At a weighting of “2,” cost is twice as important as preference. Monitor D only achieves the highest score, when cost is not included in the evaluation. Monitor C becomes the highest scoring display when cost is as important as preference.
Fig. 8.
“Importance of cost” and its impact on cost-preference score. Cost weightings are varying weightings of cost rank, as compared to a fixed preference rank of 1. A cost weighting of “0” reflects pure preference scores without cost. At a weighting of “1,” cost is as important as preference. are relative cost weightings as compared to a preference of 1, i.e., when cost becomes more important than preference, up to a maximum of cost being twice as important as cost.
4. Discussion
As pathology departments strive to digitize for primary diagnosis, display choice becomes important. The absence of defined minimum display standards may have resulted in departments who have already “gone digital” purchasing displays possibly without a full appreciation for the impact of display choice on the end user.
Philips was the first vendor to achieve FDA approval in 2018, which stipulates the use of a 4-MP medical grade Barco display.14 Arguably, this appreciation by FDA of the influence of the display on primary diagnosis, highlights the need for minimum requirements, in a similar fashion to the detailed minimum display requirements in digital radiology.
As far as we are aware, this experiment represents the first attempt in digital microscopy to evaluate displays of varying specification on user preference. We were unsurprised that there was a substantial difference in user preference between displays of differing specifications. Despite users being blinded to make, model, technical specification, and cost of the displays, monitor D, the most expensive display with the highest technical specifications, was the most preferred. Additionally, the display that scored the lowest for preference for H&E and PAP (monitor G) also had the lowest technical specifications in terms of luminance and contrast ratio and second lowest resolution. This display was also the least expensive display.
Sorting the monitors and their scores by their technical specifications indicates that both increasing resolution and increasing luminance seem to increase the preference. Surprisingly, an increase in contrast ratio did not seem to increase the preference; monitor H, with an organic light emitting diode (OLED) panel and therefore infinite contrast ratio (OLED pixels emit light directly and therefore individual pixels can be completely turned off and emit no light at all), did not perform as well as expected. We had anticipated that this display’s high contrast ratio would have resulted in a substantial improvement on user preference, due to the improved ability to distinguish subtle color differences. However, it appears that contrast ratio does not compensate for low resolution. This is further supported by monitor C, which has a lower contrast ratio than monitor B but otherwise similar specifications, scoring a much better preference score.
Twelve users voiced their preference for the larger displays ( inches), with no users highlighting their preference for the smaller screens ( inches). However, two participants did suggest that monitor D (33.6 inches) was too large with the most preferable size being that of monitor A or E (31.1 inches). This preference for larger displays over the smaller displays is in accordance with PACS and Imaging Informatics Group recommendations6, which do not provide an upper limit for display size.
The main strengths of the work are with regards to the stringent methodology to try and minimize the effect of numerous confounders on the results of this experiment. This is particularly with regards to the set-up of the environment and displays, blinding of the participants and the choice of participant task. A further strength was the number of participants in an experiment of this type. It should also be possible to test new monitors and add their results to the portfolio already created by replicating the methodology.
However, there are limitations to this work. It is important to remember that preference for a display may not neatly translate into improved clinical performance; whether in terms of speed of diagnosis, accuracy of diagnosis, or less user fatigue/eye strain. Therefore, future work will involve evaluation of displays with respect to their quantitative impact on user performance. For ease of participant involvement, we asked most participants to evaluate only one H&E slide and the selected participants only evaluated one PAP and one H-DAB slide. The preference scores may be influenced by the choice of slides and their specific stain properties. Finally, it was not possible to truly isolate the effect of the display size from image quality. Ideally, it would be preferable to vary each independently from the other to fully appreciate the influence of each variable on preference.
5. Conclusions
To conclude, we have shown that pathologists demonstrate a preference for medical-grade displays with the highest technical specifications, with a trend toward an increased preference for displays with increased luminance and resolution. As cost becomes implicated in the decision over display procurement, medical-grade displays with a slightly lower price point become preferable.
We hypothesize that most cases could be diagnosed using any display. However, there will be specific, challenging cases (e.g., assessment of dysplasia or finding small objects such as a micrometastasis) that high technical specifications (particularly high-resolution displays) will prove advantageous in terms of user performance.
Acknowledgments
We would like to take this opportunity to thank all the vendors for taking part in this evaluation, without whom this work would not have been possible. We would also like to thank our pathologist colleagues at Leeds Teaching Hospitals NHS Trust for giving up their valuable time to help us in this assessment. We are also very appreciative of the help of technical support staff from the University of Leeds and Leeds Teaching Hospitals, particularly Dave Turner, Steve Toms, and Michael Todd. The authors of this study are members of the Northern Pathology Imaging Co-operative, NPIC (Project No. 104687), which is supported by a £50 m investment from the Data to Early Diagnosis and Precision Medicine Strand of the Government’s Industrial Strategy Challenge Fund, managed and delivered by UK Research and Innovation (UKRI). However, no specific funding was received for this study.
Biographies
Emily L. Clarke is a histopathology registrar and clinical research training fellow at the University of Leeds and Leeds Teaching Hospitals NHS Trust. She has specific research interests in digital pathology and dermatopathology.
Craig Munnings is a specialist technical officer in the Medical Physics Department at Leeds Teaching Hospitals NHS Trust.
Bethany Williams is a histopathology registrar, PhD fellow in digital pathology, and lead for digital pathology training and validation at Leeds Teaching Hospitals NHS Trust and the Northern Pathology Imaging Co-operative.
David Brettle is the head of the Medical Physics at Leeds Teaching Hospitals NHS Trust. His research interests are concerned with optimizing imaging technologies for health care provision. He is an honorary professor at the University of Salford, UK and a visiting senior research fellow at the University of Leeds, UK
Darren Treanor is a consultant histopathologist and honorary clinical associate professor at Leeds Teaching Hospitals NHS Trust and the University of Leeds. He is also a guest professor at the University of Linköping, Sweden.
Disclosures
Darren Treanor is on the Advisory Board of Sectra and Leica/Aperio. He has had a collaborative research project with FFEI, where technical staff was funded by them. He is a co-inventor on a digital pathology patent, which has been assigned to Roche-Ventana on behalf of his employer. He received no personal remuneration for all.
Contributor Information
Emily L. Clarke, Email: e.l.clarke@leeds.ac.uk.
Craig Munnings, Email: craig.munnings@nhs.net.
Bethany Williams, Email: bethany.williams2@nhs.net.
David Brettle, Email: davidbrettle@nhs.net.
Darren Treanor, Email: darrentreanor@nhs.net.
References
- 1.Leica Biosystems, “Leica Biosystems and Leeds Hospital establish strategic partnership to provide quantifiable benefits of digital pathology,” 2017, https://www.leicabiosystems.com/news-events/news-details/article/leica-biosystems-and-leeds-hospital-establish-strategic-partnership-to-provide-quantifiable-benefits/News/detail/.
- 2.Randell R., et al. , “Effect of display resolution on time to diagnosis with virtual pathology slides in a systematic search task,” J. Digital Imaging 28(1), 68–76 (2015). 10.1007/s10278-014-9726-8 [DOI] [PMC free article] [PubMed] [Google Scholar]
- 3.Randell R., et al. , “Diagnosis of major cancer resection specimens with virtual slides: impact of a novel digital pathology workstation,” Hum. Pathol. 45(10), 2101–2106 (2014). 10.1016/j.humpath.2014.06.017 [DOI] [PubMed] [Google Scholar]
- 4.Cross S., et al. , “Best practice recommendations for implementing digital pathology,” G162, pp. 1–38, 2018, https://www.rcpath.org/uploads/assets/f465d1b3-797b-4297-b7fedc00b4d77e51/Best-practice-recommendations-for-implementing-digital-pathology.pdf.
- 5.Institute of Physics and Engineering in Medicine, “Report 91—recommended standards for the routine performance testing of diagnostic x-ray imaging systems,” Institute of Physics and Engineering in Medicine, York (2005).
- 6.The Royal College of Radiologists, “Picture archiving and communication systems (PACS) and guidelines on diagnostic display devices,” 3rd ed., 2019, https://www.rcr.ac.uk/system/files/publication/field_publication_files/bfcr192_pacs-diagnostic-display.pdf.
- 7.The Royal College of Radiologists, “Picture archiving and communication systems (PACS) and guidelines on diagnostic display devices,” 2nd ed., Board of the Faculty of Clinical Radiology, Royal College of Radiologists (2012).
- 8.Krupsinski E., “Virtual slide telepathology workstation of the future: lessons learned from teleradiology,” Hum Pathol. 26, 194–205 (2009). 10.1053/j.semdp.2009.09.005 [DOI] [PubMed] [Google Scholar]
- 9.Krupinski E. A., “Medical grade vs off-the-shelf color displays: influence on observer performance and visual search,” J. Digital Imaging. 22(4), 363–368 (2009). 10.1007/s10278-008-9156-6 [DOI] [PMC free article] [PubMed] [Google Scholar]
- 10.Chen Y., et al. , “The use of lower resolution viewing devices for mammographic interpretation: implications for education and training,” Eur Radiol. 25(10), 3003–3008 (2015). 10.1007/s00330-015-3718-z [DOI] [PubMed] [Google Scholar]
- 11.Krupinski E a., Kallergi M. Choosing a radiology workstation: technical and clinical considerations. Radiology 242(3), 671–682 (2007). 10.1148/radiol.2423051403 [DOI] [PubMed] [Google Scholar]
- 12.U.S. Department of Health and Human Services, “Display devices for diagnostic radiology guidance for industry and Food and Drug Administration staff,” pp. 1–14, Food and Drug Administration (2017).
- 13.American Association of Physicists in Medicine, “Display quality assurance,” 2019, https://www.aapm.org/pubs/reports/RPT_270.pdf.
- 14.FDA, “FDA allows marketing of first whole slide imaging system for digital pathology,” 2017, https://www.fda.gov/news-events/press-announcements/fda-allows-marketing-first-whole-slide-imaging-system-digital-pathology.


