Abstract
Antxr1/Tem8 is highly expressed in tumor endothelial cells and is a receptor for anthrax toxin. Mutation of Antxr1 causes GAPO syndrome, which is characterized by growth retardation, alopecia, pseudo-anodontia, and optic atrophy. However, the mechanism underlying the growth retardation remains to be clarified. Runx2 is essential for osteoblast differentiation and chondrocyte maturation and regulates chondrocyte proliferation through Ihh induction. In the search of Runx2 target genes in chondrocytes, we found that Antxr1 expression is upregulated by Runx2. Antxr1 was highly expressed in cartilaginous tissues and was directly regulated by Runx2. In skeletal development, the process of endochondral ossification proceeded similarly in wild-type and Antxr1–/– mice. However, the limbs of Antxr1–/– mice were shorter than those of wild-type mice from embryonic day 16.5 due to the reduced chondrocyte proliferation. Chondrocyte-specific Antxr1 transgenic mice exhibited shortened limbs, although the process of endochondral ossification proceeded as in wild-type mice. BrdU-uptake and apoptosis were both increased in chondrocytes, and the apoptosis-high regions were mineralized. These findings indicated that Antxr1, of which the expression is regulated by Runx2, plays an important role in chondrocyte proliferation and that overexpression of Antxr1 causes chondrocyte apoptosis accompanied by matrix mineralization.
Keywords: Antxr1, Runx2, GAPO syndrome, chondrocyte proliferation, apoptosis
1. Introduction
Anthrax toxin receptor 1 (Antxr1)/tumor endothelial marker 8 (Tem8) was discovered in the screening of proteins expressed in tumor endothelium at an increased level and identified as a receptor for protective antigen (PA) of anthrax toxin [1,2]. Mutation of Antxr1 results in GAPO syndrome, which is an autosomal recessive disorder and characterized by growth retardation, alopecia, pseudo-anodontia, and progressive visual impairment. Histologically, it is also characterized by an abnormal accumulation of extracellular matrix [3,4]. Antxr1 in the tumor endothelium interacts with the C-terminal C5 domain of collagen α3(VI) [5]. Antxr1 functions as an adhesion molecule for cell spreading, interacts with PA and collagen I through its extracellular domain, and interacts with actin cytoskeleton through its intracellular domain [6]. Antxr1–/– mice exhibit dwarfism; excess extracellular matrix in ovaries, uterus, skin, and periodontal ligament of the incisors; and the accumulation of collagen I and VI [7,8]. Moreover, there is increased proliferation of endothelial cells, in which the vascular endothelial growth factor receptor (VEGFR) signaling pathway is activated, and the excess extracellular matrix is caused by increased synthesis by fibroblastic cells and reduced degradation by Mmp2 in the skin of Antxr1–/– mice [8]. Although Antxr1–/– mice exhibit dwarfism, the function of Antxr1 in skeletal development remains to be clarified.
Runx2 is an essential transcription factor for osteoblast differentiation and chondrocyte maturation [9]. Runx2 induces the proliferation of osteoblast progenitors through the induction of Fgfr2 and Fgfr3 and induces the proliferation of osteoblast progenitors and their commitment into osteoblast lineage cells through reciprocal regulation with hedgehog, Wnt, and Phtlh signaling pathways [10,11]. Runx2 also regulates the expression of Sp7, an essential transcription factor for osteoblast differentiation [12], and induces the differentiation of preosteoblasts into immature osteoblasts [13,14]. After the differentiation to immature osteoblasts, Runx2 induces the expression of bone matrix protein genes, including Spp1, Ibsp, and Bglap2, which regulates the mineralization and alignment of apatite crystals [14,15]. The growth plate is composed of resting, proliferating, prehypertrophic, hypertrophic, and terminal hypertrophic chondrocyte layers. Col2a1 is expressed in resting, proliferating, and prehypertrophic chondrocyte layers; Ihh is expressed in the prehypertrophic chondrocyte layer; Col10a1 is expressed in the hypertrophic chondrocyte layer; and Spp1 is expressed in the terminal hypertrophic chondrocyte layer and in osteoblasts [16]. Runx2 is weakly expressed in resting and proliferating chondrocytes and is upregulated in prehypertrophic chondrocytes, and its expression is maintained in hypertrophic and terminal hypertrophic chondrocytes [16,17]. Runx2 induces maturation of prehypertrophic chondrocytes into hypertrophic chondrocytes, and Runx3 is also partly involved in this maturation [18,19,20,21]. Runx2 regulates chondrocyte proliferation through the induction of Ihh expression in the prehypertrophic chondrocytes, which directly induces chondrocyte proliferation in the proliferating chondrocyte layer [21,22]. Ihh induces Pthlh, which inhibits chondrocyte maturation at least partly through the inhibition of Runx2 expression, forming a negative feedback loop for chondrocyte maturation [23,24].
We found that Antxr1 expression is upregulated by Runx2 in the screening of Runx2 target genes in chondrocytes. We report that Antxr1 expression is directly regulated by Runx2, that chondrocyte proliferation is reduced in Antxr1–/– mice, and that the overexpression of Antxr1 in chondrocytes increases DNA replication and apoptosis.
2. Results
2.1. Antxr1 Expression Is Directly Regulated by Runx2
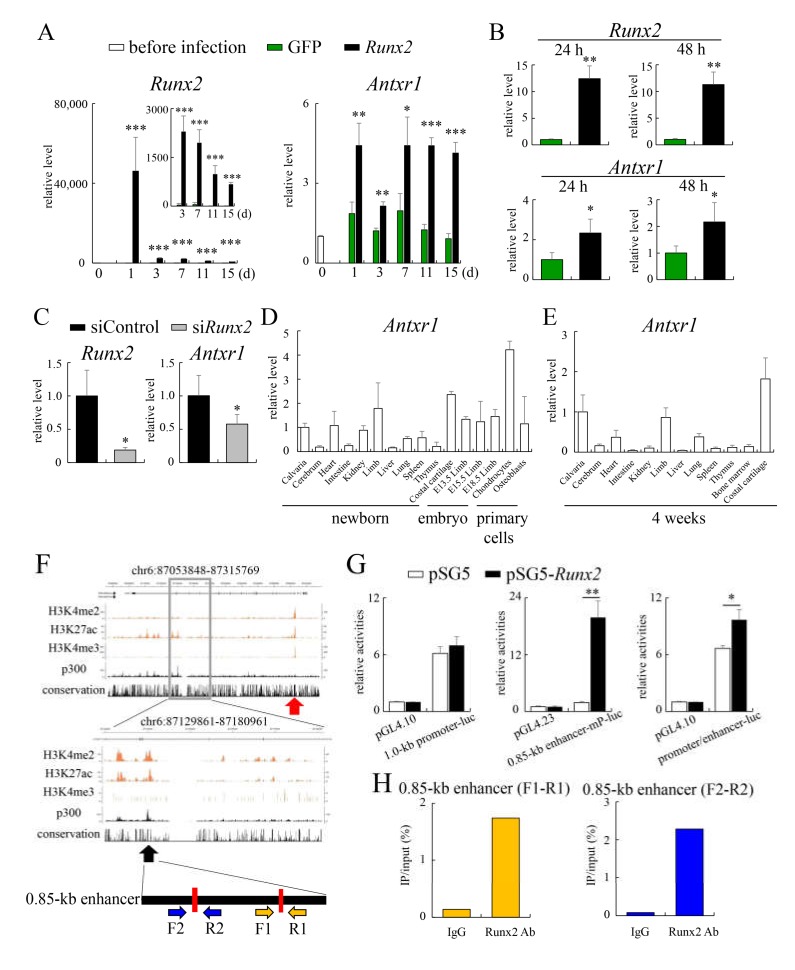
To identify Runx2 target genes in chondrocytes, we introduced Runx2-expressing adenovirus or green fluorescent protein (GFP)-expressing adenovirus into Runx2–/– primary chondrocytes and examined the differentially expressed genes by microarray [23,24]. Antxr1 expression was upregulated 3.7 times by Runx2-expressing adenovirus infection in the microarray analysis. We introduced Runx2- or GFP-expressing adenovirus into Runx2–/– primary chondrocytes or wild-type primary chondrocytes and examined Antxr1 expression by real-time RT-PCR (Figure 1A,B). Antxr1 expression was upregulated by Runx2 introduction. Furthermore, Antxr1 expression was reduced by Runx2 siRNA introduction (Figure 1C). Antxr1 was strongly expressed in the calvaria, heart, kidneys, limbs, and costal cartilage at the newborn stage and in the calvaria, limbs, and costal cartilage at 4 weeks of age (Figure 1D,E). In both developmental stages, Antxr1 was most highly expressed in costal cartilage. Furthermore, Antxr1 was highly expressed in limb skeletons during the embryonic stage and in primary chondrocytes, which originated from limb skeletons at E15.5 (Figure 1D). Thus, we selected Antxr1 as a Runx2 target gene candidate in chondrocytes.
Figure 1.
Real-time RT-PCR analysis, reporter assay, and ChIP: (A,B) Induction of Antxr1 by Runx2. Primary chondrocytes from Runx2–/– embryos at E18.5 (A) or wild-type embryos at E15.5 (B) were infected with an adenovirus expressing green fluorescent protein (GFP) or Runx2-GFP, and Runx2 and Antxr1 expressions were analyzed by real-time RT-PCR. The values before infection (A) and those in GFP-expressing cells (B) were defined as 1, and relative levels are shown. n = 3–4. ∗Versus GFP. * p < 0.05, ** p < 0.01, *** p < 0.001. (C) Reduction of Antxr1 by siRunx2: Primary chondrocytes were infected with siControl or siRunx2. RNA was extracted after 48 h, and Runx2 and Antxr1 expressions were analyzed by real-time RT-PCR. The values of siControl were defined as 1, and relative levels are shown. n = 4. * Versus siControl. * p < 0.05. (D,E) Real-time RT-PCR analysis of Antxr1 expression using RNA from the tissues at the newborn stage; limb skeletons at E13.5, E15.5, and E18.5; and primary cells (D) and the tissues at 4 weeks of age (E) from wild-type mice. The values in calvaria were defined as 1, and relative levels are shown. The samples were prepared from 3–4 mice at each age. (F) ChIP-seq enrichment profiles of H3k4me2, H3K27ac, H3K4me3, and p300 in mouse rib chondrocytes at the Antxr1 gene locus: The scale indicates the intensity of enrichment. Red arrow indicates the peaks around exon 1. The locations of Runx2-binding motifs (red bars) and the primer sets for ChIP are shown on the bottom. (G) Reporter assays: Relative luciferase activity of 1.0-kb promoter-luc, 0.85-kb enhancer-minimal promoter (mP)-luc, and 1.0-kb promoter/0.85-kb enhancer-luc in ATDC5 cells transfected with the empty vector (pSG5) or Runx2 expression vector (pSG5-Runx2). * p < 0.05, ** p < 0.01. n = 4. (H) ChIP assays: DNA before immunoprecipitation (input) and after immunoprecipitation (IP) with anti-Runx2 antibody or rabbit IgG was amplified by real-time PCR using the primers shown in Figure 1F. The percentages of the amplified DNA from IP against that from the input are shown.
To investigate whether Antxr1 expression is directly regulated by Runx2, we examined Runx2-binding regulatory regions in the Antxr1 region by reanalyzing our previously published chromatin immunoprecipitation (ChIP)-seq data of H3K4me2, H3K4me3, H3K27ac, and p300 in mouse primary rib chondrocytes [25]. There were peaks of H3K4me2, H3K4me3, and H3K27ac around exon 1 (Figure 1F). In a reporter assay using a 1.0-kb DNA fragment covering the regions of the three peaks and the conserved sequence among vertebrates around exon 1, the 1.0-kb DNA fragment had strong promoter activity. However, Runx2 failed to enhance the reporter activity, suggesting that it induces Antxr1 expression through enhancers (Figure 1F,G). Antxr1 is composed of 18 exons. By searching for genomic elements marked by tissue-specific active enhancer signatures (H3K4me2high/H3K4me3low/H3K27ac+/p300+) in the ChIP-seq data, we found one enhancer candidate in the 14th intron (Figure 1F). There were two Runx2-binding motifs in this region. The 0.85-kb DNA fragment containing the enhancer candidate was inserted into the luciferase vector containing a minimal promoter. Runx2 strongly increased the reporter activity (Figure 1G). Runx2 also enhanced the reporter activity of 1.0-kb promoter-luciferase-0.85-kb enhancer construct (Figure 1G). In addition, ChIP analysis using Runx2 antibody demonstrated that Runx2 binds to both Runx2-binding motifs in the 0.85-kb region (Figure 1H). This suggested that Runx2 regulates Antxr1 expression mainly through the 0.85-kb enhancer.
2.2. The Process of Endochondral Ossification Proceeded Normally in Antxr1–/– Mice, but Their Femurs and Tibiae Were Shorter than Those of Wild-Type Mice due to Reduced Chondrocyte Proliferation
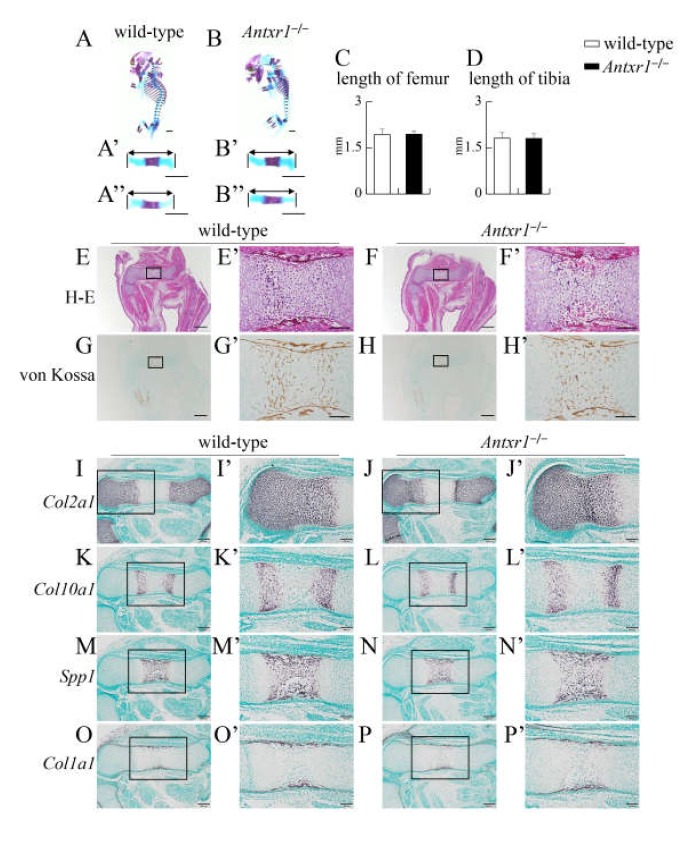
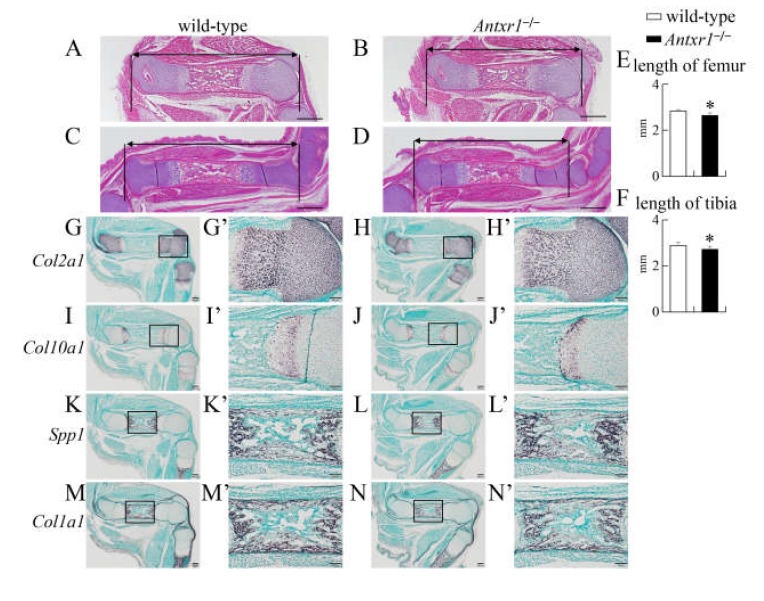
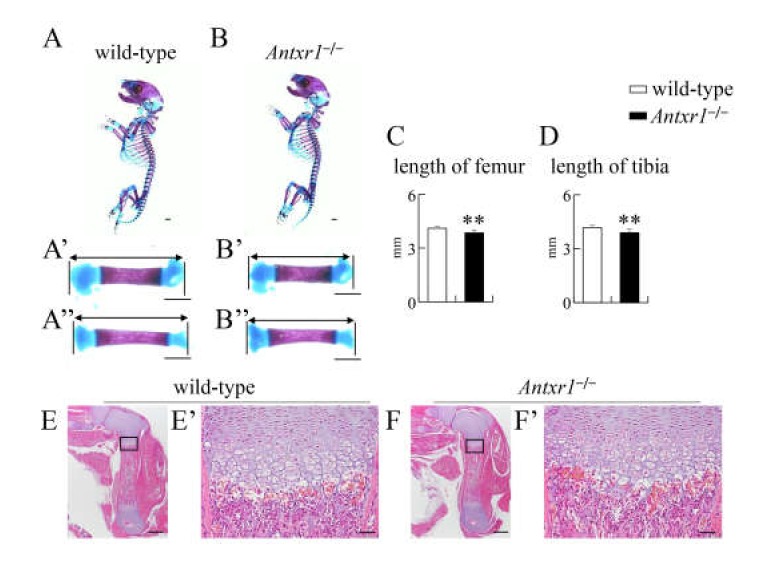
In skeletal preparations at E15.5, mineralization was similar and the lengths of femurs and tibiae were similar between wild-type and Antxr1–/– mice (Figure 2A–D). There was also no apparent difference on histological analysis by hematoxylin and eosin (H-E) or von Kossa staining (Figure 2E–H). Based on in situ hybridization using Col2a1, Col10a1, Spp1, and Col1a1 probes at E15.5 and E16.5, the process of endochondral ossification proceeded similarly in wild-type and Antxr1–/– mice (Figure 2I–P and 3G–N). However, the lengths of femurs and tibiae were shorter in Antxr1–/– mice than in wild-type mice at E16.5 (Figure 3A–F). Although mineralization in skeletal preparations was similar and histological analysis demonstrated no apparent difference between wild-type and Antxr1–/– mice, the lengths of femurs and tibiae in Antxr1–/– mice were also shorter than those in wild-type mice at the newborn stage (Figure 4).
Figure 2.
Skeletal system and histological analyses of wild-type and Antxr1–/– embryos at E15.5: (A,B) Lateral view of the whole skeletons (A,B) and the enlarged views of femurs (A’,B’) and tibiae (A’’,B’’) of wild-type (A) and Antxr1–/– (B) embryos. The lengths of femurs (C) and tibiae (D): The lengths of both sides of femurs and tibiae were measured using the skeletal preparations of 4 wild-type and 4 Antxr1–/– embryos. (E–H) Histological analyses by H-E (E,F) and von Kossa (G,H) staining using femoral sections from wild-type (E,G) and Antxr1–/– (F,H) embryos. (I–P) In situ hybridization using Col2a1 (I,J), Col10a1 (K,L), Spp1 (M,N), and Col1a1 (O,P) probes. The boxed regions in E–P are magnified in E’–P’, respectively. Scale bars: 1 mm (A,B), 500 µm (E–H), 200 µm (I–P), and 100 µm (E’–P’). The number of embryos analyzed: H-E staining, wild-type: 9, Antxr1–/–: 5; von Kossa staining, wild-type: 7, Antxr1–/–: 3; in situ hybridization, wild-type: 2, Antxr1–/–: 3. Similar results were obtained and the representative data are shown.
Figure 3.
Histological analyses of wild-type and Antxr1–/– embryos at E16.5: (A–D) H-E staining of femurs (A,B) and tibiae (C,D) in wild-type (A,C) and Antxr1–/– (B,D) embryos. (E,F) The lengths of femurs (E) and tibiae (F): The lengths of femurs and tibiae were measured using histological sections of 6 wild-type and 4 Antxr1–/– embryos, as shown in A–D. Versus wild-type embryos, * p < 0.05. (G–N) In situ hybridization using Col2a1 (G,H), Col10a1 (I,J), Spp1 (K,L), and Col1a1 (M,N) probes. The boxed regions in G–N are magnified in G’–N’, respectively. Three embryos of each genotype were analyzed by in situ hybridization and showed similar results. Scale bars: 500 µm (A–D), 200 µm (G–N), and 100 µm (G’–N’).
Figure 4.
Skeletal system and histological analysis of wild-type and Antxr1–/– newborns: (A,B) Lateral view of the whole skeletons (A,B) and magnified pictures of femurs (A’,B’) and tibiae (A’’,B’’) in wild-type (A) and Antxr1–/– (B) newborns. (C,D) The lengths of femurs (C) and tibiae (D): The lengths of both sides of femurs and tibiae were measured using skeletal preparations of 4 wild-type and 3 Antxr1–/– newborns, as shown in A’,B’,A’’ and B’’. Versus wild-type newborns, **p < 0.01. (E,F) H-E staining using femoral sections from wild-type (E) and Antxr1–/– (F) newborns. The boxed regions in E and F are magnified in E’ and F’, respectively. Scale bars: 1 mm (A,B), 500 µm (E,F), and 100 µm (E’,F’). The number of mice analyzed: H-E staining, wild-type: 2, Antxr1–/–: 2.
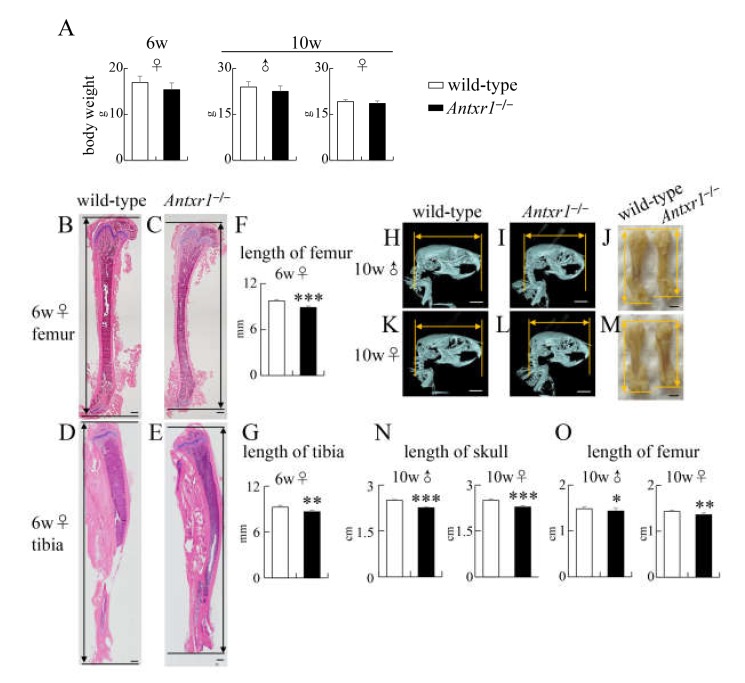
The body weight of Antxr1–/– mice was similar to that of wild-type mice at 6 weeks of age, but the lengths of femurs and tibiae in Antxr1–/– mice were shorter than those in wild-type mice (Figure 5A–G). The body weights of both male and female Antxr1–/– mice were also similar to those of wild-type mice at 10 weeks of age, but the skull length in the sagittal plane and femur length in Antxr1–/– mice were shorter than those in wild-type mice at 10 weeks of age in both sexes (Figure 5A,H–O). Therefore, the lengths of lower limbs in Antxr1–/– mice were consistently shorter than those in wild-type mice after E16.5, irrespective of their similar body weights.
Figure 5.
Body weight and histological and micro-CT analyses of wild-type and Antxr1–/– mice at 6 weeks and 10 weeks of age: (A) Body weights of female mice at 6 weeks of age and of male and female mice at 10 weeks of age. (B–E) H-E staining of femurs (B,C) and tibiae (D,E) in female wild-type (B,D) and Antxr1–/– (C,E) mice at 6 weeks of age. (F,G) The lengths of femurs and tibiae at 6 weeks of age were measured using histological sections, as shown in B–E. (H,I,K,L) Lateral view of micro-CT images of skulls of male (H) and female (K) wild-type mice and of male (I) and female (L) Antxr1–/– mice at 10 weeks of age. (J,M) The appearance of femurs in male wild-type and Antxr1–/– mice (J) and of female wild-type and Antxr1–/– mice (M) at 10 weeks of age. (N) The skull length at 10 weeks of age was measured using micro-CT images, as shown in H, I, K, and L. (O) The length of femurs at 10 weeks of age was measured, as shown in J and M. Scale bars: 500 µm (B–E), 0.5 cm (H,I,K,L), and 0.2 cm (J,M). The number of mice analyzed: body weight at 6 weeks of age, wild-type: 5, Antxr1–/–: 5; the length of femurs at 6 weeks of age, wild-type: 4, Antxr1–/–: 5; body weights and the lengths of skulls and femurs in male mice at 10 weeks of age, wild-type: 12, Antxr1–/–: 7; body weights and the lengths of skulls and femurs in female mice at 10 weeks of age, wild-type: 7, Antxr1–/–: 9. Versus wild-type mice, * p < 0.05, ** p < 0.01, *** p < 0.001.
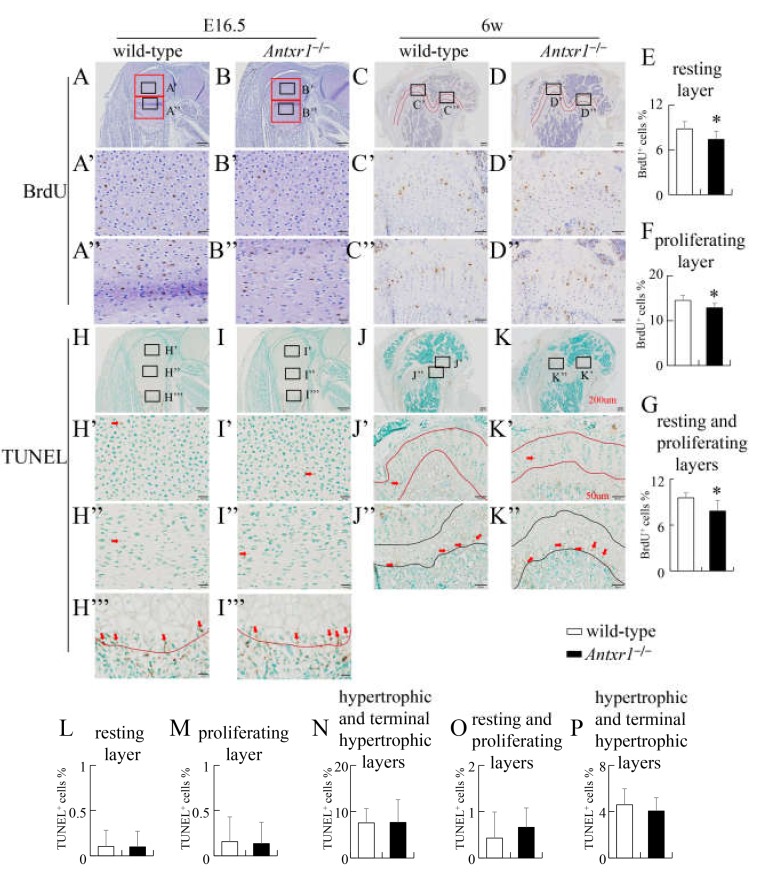
To investigate the reason for the shortening of the lower limbs in Antxr1–/– mice, we performed 5-bromo-2-deoxyuridine (BrdU)-labeling at E16.5 and 6 weeks of age. The percentages of BrdU-positive chondrocytes in Antxr1–/– mice were significantly lower than the respective values in wild-type mice in both resting and proliferating layers at E16.5 (Figure 6A,B,E,F). The percentage of BrdU-positive chondrocytes in the resting and proliferating layers in Antxr1–/– mice was also lower than that in wild-type mice at 6 weeks of age (Figure 6C,D,G). We next examined apoptosis by terminal deoxynucleotidyl transferase-mediated dUTP nick end labeling (TUNEL) staining. There were no differences in the percentages of TUNEL-positive cells in the resting layer, proliferating layer, and hypertrophic and terminal hypertrophic layers between wild-type and Antxr1–/– mice at E16.5 or 6 weeks of age (Figure 6H–P).
Figure 6.
Proliferation and apoptosis of chondrocytes in wild-type and Antxr1–/– mice at E16.5 and 6 weeks of age: (A–D) BrdU staining using femoral sections from wild-type (A,C) and Antxr1–/– (B,D) mice at E16.5 (A,B) and 6 weeks of age (C,D). The boxed regions in A–D are magnified in A’–D’ and A’’–D’’. (E–G) The frequencies of BrdU-positive chondrocytes in the resting (E) and proliferating (F) layers (red boxes in A and B) at E16.5 and those in the resting and proliferating layers (the area between two red lines in C and D) at 6 weeks of age (G). The layer with columnar alignment of chondrocytes without hypertrophy was regarded as a proliferating layer, and the epiphyseal part of the proliferating layer was regarded as a resting layer. (H–K) TUNEL staining using femoral sections from wild-type (H,J) and Antxr1–/– (I,K) mice at E16.5 (H,I) and 6 weeks of age (J,K). The boxed regions in H–K are magnified in H’–K’, H’’–K’’, H’’’, and I’’’. The red arrows in H’–I’’’ indicate TUNEL-positive chondrocytes. (L–P) The frequencies of TUNEL-positive chondrocytes in the resting layers (H’,I’,L), proliferating layers (H’’,J’’,M), and hypertrophic and terminal hypertrophic layers (the upper part of the line in H’’’ and I’’’) (N) at E16.5 and those in the resting and proliferating layers (the area between the two red lines in J’ and K’) (O) and hypertrophic and terminal hypertrophic layers (the area between the two black lines in J’’ and K’’) (P) at 6 weeks of age. The layer with chondrocyte hypertrophy was regarded as hypertrophic and terminal hypertrophic layers. Scale bars: 200 µm (A–D, H–K), 50 µm (A’–D’,A’’–D’’,H’–K’,H’’–K’’,H’’’,I’’’). The number of mice analyzed: BrdU staining at E16.5, wild-type: 7, Antxr1–/–: 6; BrdU staining at 6 weeks of age, wild-type: 5, Antxr1–/–: 5; TUNEL staining at E16.5, wild-type: 3, Antxr1–/–: 3; TUNEL staining at 6 weeks of age, wild-type: 3, Antxr1–/–: 3. Two sections were counted for each mouse. Versus wild-type mice, *p < 0.05.
2.3. The Process of Endochondral Ossification Proceeded Normally, but Ectopic Mineralization Was Observed in Chondrocyte-Specific Antxr1 Transgenic (tg) Mice
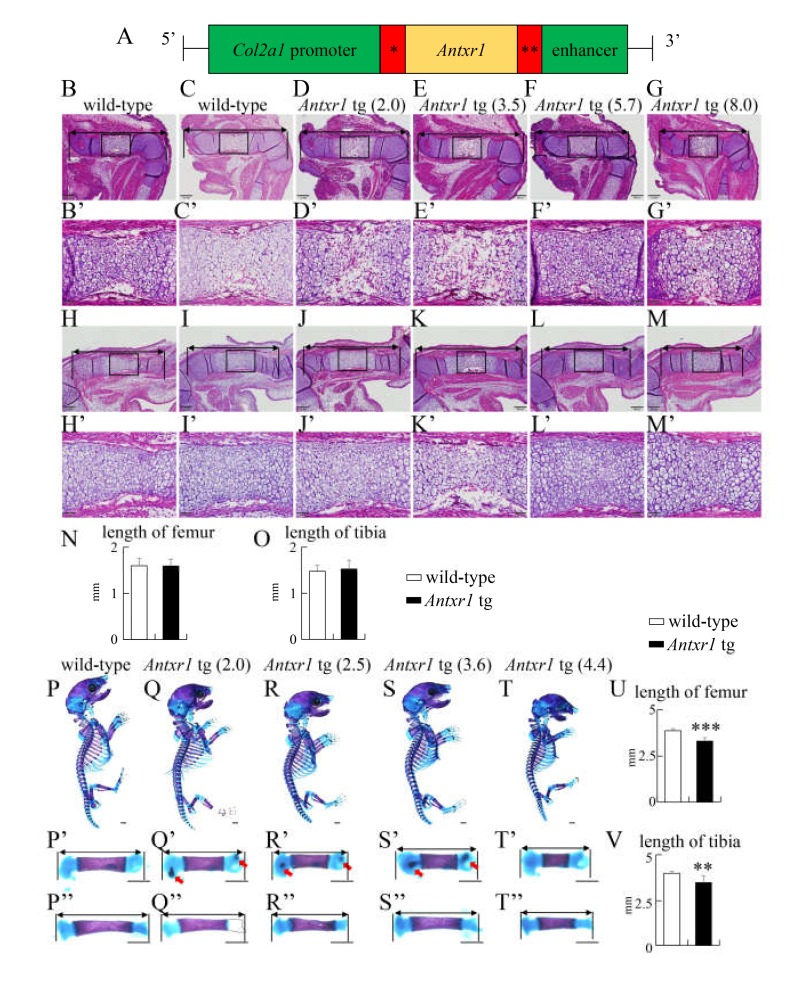
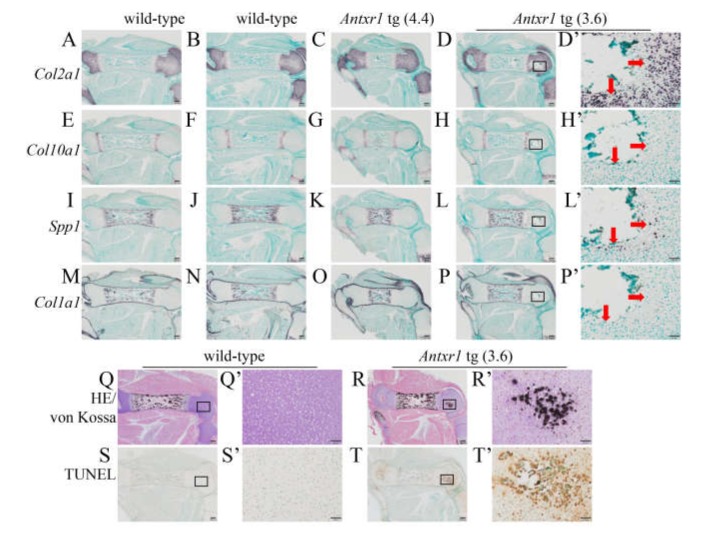
To further assess the functions of Antxr1 in chondrocytes, we generated Antxr1 tg mice using the Col2a1 promoter and enhancer and analyzed the F0 mice at E15.5 and E18.5 because some tg mice died after birth (Figure 7A). We obtained 67 and 199 F0 embryos at E15.5 and E18.5, respectively, and 14 embryos at E15.5 and 30 embryos at E18.5 were Antxr1 tg. Chondrocyte maturation in Antxr1 tg mice, in which Antxr1 expression was 2–8 times higher than endogenous Antxr1 expression, proceeded similarly to that in wild-type mice at E15.5, and the lengths of femurs and tibiae were similar between wild-type and Antxr1 tg mice (Figure 7B–O, 7B’–M’). In skeletal preparations at E18.5, the limbs were shorter and the rib cage was smaller in Antxr1 tg mice, in which the Antxr1 expression was 2–4 times higher than endogenous Antxr1 expression; however, mineralization was similar between wild-type and Antxr1 tg mice, except ectopic mineralization in femurs (Figure 7P–T,P’–T’,P’’–T’’). The lengths of femurs and tibiae in Antxr1 tg mice were shorter than those in wild-type mice (Figure 7U,V). The opposite lower limbs of the same mice were used to perform in situ hybridization. The expression patterns of Col2a1, Col10a1, Spp1, and Col1a1 were similar between wild-type and Antxr1 tg mice (Figure 8A–P). This suggested that the processes of endochondral ossification proceeded similarly in wild-type and Antxr1 tg mice. However, Antxr1 tg mice with 18 times higher Antxr1 expression exhibited dwarfism, markedly shortened limbs, small rib cage, delayed mineralization, and ectopic mineralization in tibia (Supplementary Figure S1A–F). Ectopic mineralization was also observed in vertebra (Supplementary Figure S1G–J).
Figure 7.
Generation of Col2a1-Antxr1 tg mice and histological and skeletal system analyses of wild-type and Antxr1 tg embryos at E15.5 and E18.5: (A) Diagram of the DNA construct used to generate tg mice that express Antxr1 under the control of the mouse Col2a1 promoter-enhancer. * Intron from rabbit β globin gene, **Polyadenylation signal from SV40. (B–M) H-E staining of femurs (B–G) and tibiae (H–M) from wild-type (B,C,H,I) and Antxr1 tg (D–G, J–M) F0 embryos at E15.5. The expression level of Antxr1 in wild-type embryos was set as 1, and the relative levels in tg embryos are shown in parenthesis. The boxed regions in B–M are magnified in B’–M’, respectively. (N,O) The lengths of femurs (N) and tibiae (O) at E15.5 were measured using the sections from 5 wild-type and 4 Antxr1 tg embryos at E15.5, as shown in B–M. (P–T) Lateral view of the whole skeletons of wild-type (P) and Antxr1 tg (Q–T) F0 embryos at E18.5: The expression levels are shown in parentheses. The femurs and tibiae were magnified in P’–T’ and P’’–T’’, respectively. The arrows in Q’, R’, and S’ show ectopic mineralization in the cartilage. (U,V) The lengths of femurs (U) and tibias (V) at E18.5 were measured using skeletal preparations, as shown in P’–T’ and P’’–T’’. Scale bars: 200 µm (B–M), 50 µm (B’–M’), 1 mm (P–T,P’–T’,P’’–T’’). The number of embryos analyzed: H-E staining at E15.5, wild-type: 5, Antxr1 tg: 4; skeletal system at E18.5, wild-type: 9, Antxr1 tg: 4. Versus wild-type embryos, ** p < 0.01, *** p < 0.001.
Figure 8.
Histological analyses of wild-type and Antxr1 tg embryos at E18.5: (A–P) In situ hybridization using femoral sections from wild-type (A,B,E,F,I,J,M,N) and Antxr1 tg (C,D,G,H,K,L,O,P) F0 embryos. Col2a1 (A–D), Col10a1 (E–H), Spp1 (I–L), and Col1a1 (M–P) anti-sense probes were used. The boxed regions in D, H, L, and P are magnified in D’, H’, L’, and P’, respectively. The arrows in D’, H’, L’, and P’ show the location of Spp1-positive cells. (Q–T) Double-staining with H-E and von Kossa (Q,R) and TUNEL staining (S,T) of wild-type (Q,S) and Antxr1 tg (R,T) F0 embryos: The boxed regions in Q–T are magnified in Q’–T’, respectively. Scale bars: 200 µm (A–T), 50 µm (D’,H’,L’,P’–T’). The expression levels in tg embryos are shown in parentheses. The number of embryos analyzed in situ hybridization, wild-type: 3, Antxr1 tg: 2; double staining of H-E and von Kossa, wild-type: 9, Antxr1 tg; 4; TUNEL staining, wild-type: 4, Antxr1 tg: 4. Similar results were obtained and the representative data are shown.
2.4. Ectopic Mineralization Was Caused by Apoptosis Without Chondrocyte Maturation
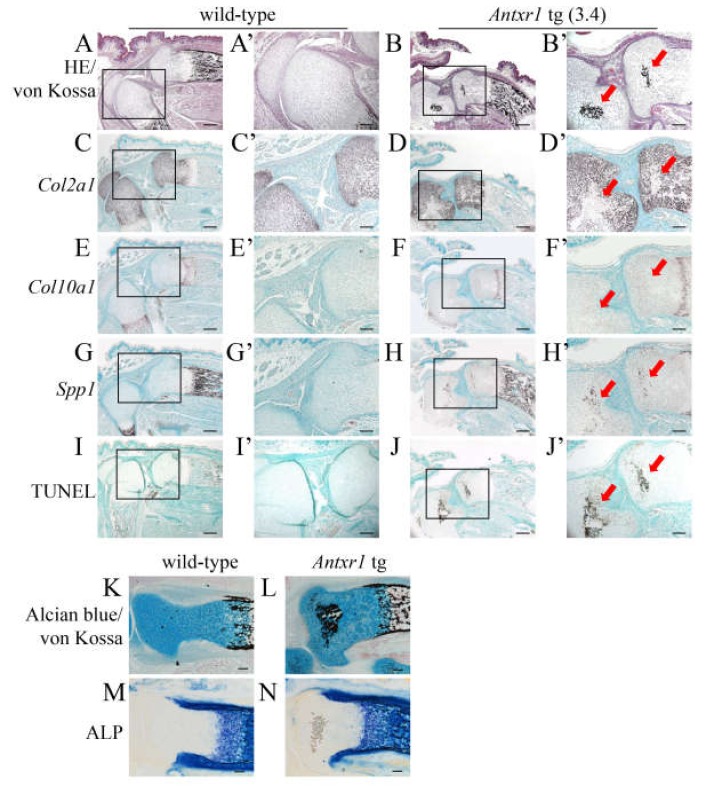
Von Kossa staining and TUNEL staining showed that the region with mineralization in the resting layer of the femur in serial sections from Antxr1 tg mice (Antxr1 tg (3.6)), in which Antxr1 expression was 3.6 times higher than in wild-type mice, was enriched with TUNEL-positive cells (Figure 8Q–T, Q’–T’), although the mineralized region was detached from the sections used for in situ hybridization (Figure 8D,H,L,P,D’,H’,L’,P’). In the growth plate in wild-type mice, the matrix of terminal hypertrophic chondrocytes is mineralized, which is considered to be caused by the apoptosis of terminal hypertrophic chondrocytes due to their increased intracellular phosphate ions [26,27,28]. To investigate whether the mineralization and apoptosis occurred through chondrocyte maturation, limb bones with ectopic mineralization were carefully examined. The cells surrounding the mineralized region were not hypertrophic and expressed Col2a1 and/or Spp1 but not Col10a1 or Col1a1 (Figure 8D’,H’,L’,P’,R’). We also examined the lower limb sections from another Antxr1 tg mouse (Antxr1 tg (3.4)). The mineralized regions were enriched with TUNEL-positive cells (Figure 9B’,J’). The mineralized regions were negative for Col2a1 and Col10a1, and the surrounding cells were Col2a1-positive and/or Spp1-positive but Col10a1-negative (Figure 9B’,D’,F’,H’). Furthermore, double staining with Alcian blue, which stains proteoglycan in the cartilage, and von Kossa demonstrated mineralization in the Alcian blue-stained area (Figure 9K,L). Alkaline phosphatase (ALP) staining using the serial sections revealed that ALP activity was positive in the terminal hypertrophic chondrocytes and osteoblasts in both wild-type and Antxr1 tg mice, whereas the ectopically mineralized region in Antxr1 tg mice was negative for ALP activity (Figure 9M,N). Moreover, neither blood vessels nor hematopoietic cells were observed in the ectopically mineralized regions in histological analyses (Figure 8 and Figure 9, and data not shown). These findings indicate that mineralization and apoptosis occurred in Antxr1 tg mice in the absence of chondrocyte maturation, vascular invasion, and transdifferentiation of chondrocytes into osteoblasts.
Figure 9.
Chondrocyte maturation in the mineralized and apoptosis-enriched regions at E18.5: (A–J) Double-staining with H-E and von Kossa (A,B), in situ hybridization (C–H), and TUNEL staining (I,J) using hind limbs of wild-type (A,C,E,G,I) and Antxr1 tg (B,D,F,H,J) F0 embryos. In situ hybridization was performed using Col2a1 (C,D), Col10a1 (E,F), and Spp1 (G,H) anti-sense probes. The boxed regions in A–J are magnified in A’–J’, respectively. The expression level in the tg embryo is shown in parenthesis. The arrows in B’, D’, F’, H’, and J’ indicate the regions with ectopic mineralization. (K–N) Double-staining with Alcian blue and von Kossa (K,L) and Alkaline phosphatase (ALP) staining (M, N) using frozen sections of tibiae of wild-type (K,M) and Antxr1 tg (L,N) embryos. Scale bars: 200 µm (A–J) and 100 µm (A’–J’,K–N).
2.5. BrdU Uptake Was Increased in Both Resting and Proliferating Layers, and TUNEL-Positive Cells Were Markedly Increased in Both Layers but More Prominently in the Resting Layer in Antxr1 tg Mice
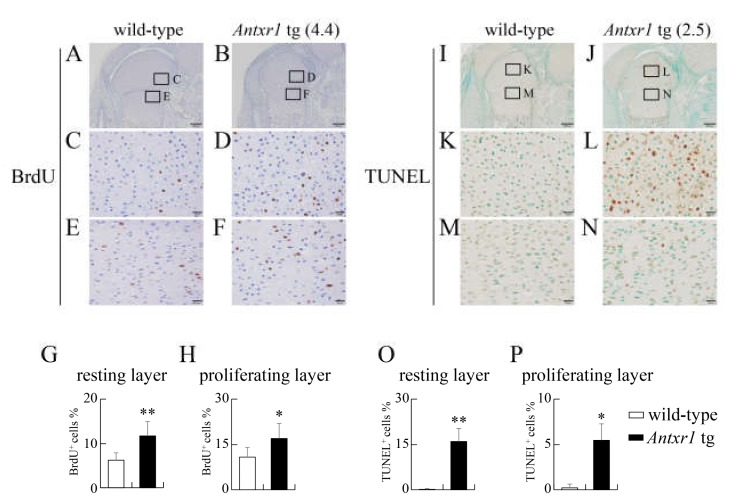
The limb length was shorter in Antxr1 tg mice than in wild-type mice, but the process of endochondral ossification proceeded similarly in wild-type and Antxr1 tg mice. Therefore, we examined chondrocyte proliferation by BrdU labelling and apoptosis by TUNEL staining at E18.5. BrdU-positive cells were increased in resting and proliferating layers of femurs in Antxr1 tg mice compared with wild-type mice (Figure 10A–H). Furthermore, TUNEL-positive cells were markedly increased in both resting and proliferating layers of femurs in Antxr1 tg mice compared with wild-type mice (Figure 10I–P). However, the degree of increase was more marked in the resting layer than in the proliferating layer in Antxr1 tg mice (Figure 10I–P).
Figure 10.
Proliferation and apoptosis in femurs of wild-type and Antxr1 tg embryos at E18.5: (A–H) BrdU staining (A–F) and the frequencies of BrdU-positive chondrocytes in the resting (A–D,G) and proliferating (A,B,E,F,H) layers of wild-type (A,C,E) and Antxr1 tg (B,D,F) F0 embryos. (I–P) TUNEL staining (I–N) and the frequencies of TUNEL-positive chondrocytes in the resting (I,J,K,L,O) and proliferating (I,J,M,N,P) layers in wild-type (I,K,M) and Antxr1 tg (J,L,N) F0 embryos at E18.5. The boxed regions in A, B, I, and J are magnified in C and E, in D and F, in K and M, and in L and N, respectively. The expression levels in tg embryos are shown in parentheses. Scale bars: 200 µm (A,B,I,J) and 20 µm (C–F, K–N). The number of mice analyzed: BrdU staining, wild-type: 6, Antxr1 tg: 4; TUNEL staining, wild-type: 4, Antxr1 tg: 4. The expression levels in tg embryos analyzed are shown in Figure 7Q–T. Versus wild-type, *p < 0.05, ** p < 0.01.
3. Discussion
The mechanism of abnormal accumulation of extracellular matrix in GAPO syndrome, which is caused by Antxr1 mutation, has been well studied [29]. Although growth retardation is a common feature of GAPO syndrome, the mechanism remains to be clarified. The shortening of lower limbs was evident in Antxr1–/– mice at E16.5 and remained thereafter. BrdU uptake was reduced in Antxr1–/– mice at E16.5 and 6 weeks of age. As there was no abnormal accumulation of extracellular matrix in limbs during the embryonic stage and the process of endochondral ossification proceeded normally in Antxr1–/– mice, the growth retardation in Antxr1–/– mice was mainly caused by reduced chondrocyte proliferation. As Antxr1 expression was directly regulated by Runx2, Runx2 regulates chondrocyte proliferation not only through the induction of Ihh expression [21] but also through the induction of Antxr1 expression. This is the first report demonstrating that Antxr1 positively regulates cell proliferation in physiological conditions.
Antxr1 inhibits the Vegfa signaling pathway in endothelial cells, and Antxr1–/– mice exhibit the hyperproliferation of endothelial cells, suggesting that Antxr1 negatively regulates the proliferation of endothelial cells and angiogenesis [8]. However, Antxr1 expression is highly upregulated in the tumor endothelium, and the growth of human tumor xenografts, including melanoma, breast, colon, and lung cancer, is impaired in Antxr1–/– mice. Moreover, an antibody against Antxr1 inhibits tumor-induced angiogenesis, suggesting that Antxr1 expression in the endothelium is required for the proliferation of endothelial cells and angiogenesis in cancer growth [30]. Therefore, the function of Antxr1 in the proliferation of endothelial cells differs between physiological conditions and cancer angiogenesis. Furthermore, knockdown of Antxr1 reduced the proliferation of osteosarcoma and XWLC05 lung adenocarcinoma cells [31,32]. Thus, Antxr1 positively regulates the proliferation of both endothelial cells in cancer and the cancer cells themselves but negatively regulates endothelial cell proliferation in physiological conditions. Our study demonstrated that Antxr1 is a physiologically positive regulator of chondrocyte proliferation. Although Antxr1 knockdown was reported to reduce Ccnd1 and to increase Cdkn1a and Cdkn1b expression in osteosarcoma cells [32], their expression was not changed in the limb cartilage of Antxr1 tg mice compared with that in wild-type mice at E15.5 by microarray analysis (data not shown). Therefore, the mechanism of the positive regulation by Antxr1 in chondrocyte proliferation requires further investigation.
In the growth plate, terminal hypertrophic chondrocytes die by apoptosis and mineralization occurs due to their increased intracellular phosphate ions [26,27,28]. Chondrocyte hypertrophy and Col10a1 expression are prerequisite for the subsequent apoptosis and mineralization, and cellular phosphate ion levels are closely related to chondrocyte maturation [28,33,34,35]. However, chondrocyte hypertrophy and Col10a1 expression were not observed in the TUNEL-positive and mineralized regions, which were mainly observed in the resting chondrocyte layer, in Antxr1 tg mice. This suggests that Antxr1 increased the amount of cellular phosphate ions, which induced apoptosis and mineralization without inducing chondrocyte maturation, or that other mechanisms, including the increase in intracellular calcium ions, are responsible for the apoptosis and mineralization. Spp1 expression in the chondrocytes surrounding TUNEL-positive cells may have been induced by danger-associated molecular patterns (DAMPs) released from the necrotic cells, which originated from apoptotic chondrocytes, because Spp1 expression is induced by inflammation [36,37]. We previously reported that overexpression of both Ccnd1 and Cdk6 increases BrdU uptake but induces chondrocyte apoptosis. Overexpression of both Ccnd1 and Cdk6 promotes G1/S cell cycle transition by phosphorylating pRB, but the cell cycle fails due to the dysregulation of E2F target genes [38,39]. Overexpression of Antxr1 also likely promoted G1/S cell-cycle transition, but the cell cycle failed. In Antxr1 tg mice, BrdU uptake and apoptosis were increased in both resting and proliferating layers but apoptosis was more prominent in the resting layer. Therefore, dysregulated promotion of the cell cycle may have played a role in apoptosis, but it was unlikely to be a major cause in Antxr1 tg mice.
In conclusion, we demonstrated that Antxr1 positively regulates chondrocyte proliferation without affecting chondrocyte maturation, vascular invasion into the cartilage, or osteoblast differentiation. Furthermore, two-times overexpression of Antxr1 in chondrocytes was sufficient to induce marked chondrocyte apoptosis, which was likely caused by mechanisms related to calcium or phosphate metabolism. Apoptosis is an important factor in osteoarthritis, and Runx2 is a causative molecule of osteoarthritis [36,40,41,42]. Thus, elucidation of the regulatory mechanisms for chondrocyte proliferation and apoptosis by Antxr1 will be beneficial not only for understanding physiological skeletal development but also for clarifying the pathogenesis of GAPO syndrome, osteoarthritis, and cancer growth.
4. Materials and Methods
4.1. Cell Culture, Adenoviral Transfer, Transfection of siRNA, and Real-Time RT-PCR Analysis
Primary chondrocytes were prepared from the limb skeletons of Runx2–/– embryos at E18.5 or wild-type embryos at E15.5. Cells were plated on 48-well plates at a density of 7 × 10⁴/well in DMEM/Nutrient Mixture F-12 Ham (Sigma Aldrich, St. Louis, MO, USA) containing 5% fetal bovine serum (FBS) (Sigma Aldrich) and 10 μg/mL of human transferrin (Roche Diagnostics, Mannheim, Germany). The next day, cells were infected with an adenovirus expressing GFP or type II Runx2-GFP at a multiplicity of infection of 10 for 2 h. A total of 2 × 10⁵ cells was subjected to electroporation of 10 pmol of siRNA for the control or Runx2 using the Neon Transfection System (Invitrogen, Carlsbad, CA, USA). RNA was extracted using ISOGEN (Wako, Osaka, Japan). Primary osteoblasts were prepared from calvariae of newborn mice as described previously [11]. RNA was extracted using ISOGEN (Wako). Real-time RT-PCR was performed using a THUNDERBIRD SYBR qPCR Mix (Toyobo, Osaka, Japan) and Light Cycler 480 real-time PCR system (Roche Diagnostics). We normalized the values obtained to those of β-actin. Primer sequences are shown in Supplementary Table S1.
4.2. Screening for Enhancers around the Antxr1 Region
To screen enhancers around the Antxr1 region, we used datasets of ChIP-seq for H3K4me2, H3K4me3, H3K27ac, and p300, which we previously obtained for mouse primary rib chondrocytes [25]. ChIP-seq peaks were visualized in the CisGenome browser [43].
4.3. Reporter and ChIP Assays
The Antrx1 0.85-kb enhancer and 1.0-kb promoter (−762 to +309) were PCR amplified from mouse genomic DNA. The 0.85-kb enhancer was cloned into the NheI-XhoI site of the pGL4.23-Basic luciferase reporter vector containing a minimal promoter (Promega, Madison, WI, USA). The 1.0-kb promoter was cloned into the NheI-XhoI site of the pGL4.10-Basic luciferase reporter vector (Promega). To construct the luciferase reporter vector containing both the enhancer and promoter, the 0.85-kb enhancer was inserted into the BamHI site of pGL4.10 containing the 1.0-kb promoter. The recombinant constructs were confirmed by sequencing. A chondrogenic cell line, ATDC5, was purchased from the RIKEN Cell Bank (Tsukuba Science City, Japan). ATDC5 cells were seeded on 24-well plates at a density of 1.9 × 10⁴ cells/cm2 and cultured in DMEM/Nutrient Mixture F-12 Ham (Sigma Aldrich) containing 5% FBS (Sigma Aldrich) and 10 μg/mL of human transferrin (Roche Diagnostics) overnight. The cells were transiently transfected with a DNA mixture containing either the 1.0-kb promoter-luc, 0.85-kb enhancer-luc, or promoter/enhancer-luc and pRL-TK (Promega) with the empty vector (pSG5) or Runx2-expressing vector (pSG5-Runx2) using X-tremeGENE9 (Roche Diagnostics). Transfected cells were cultured for 48 hrs prior to harvest. Cell lysates were assayed for Firefly and Renilla luciferase activity using the Dual-Luciferase Reporter Assay System (Promega) according to the manufacturer’s instructions. Luciferase activity was normalized to Renilla luciferase activity. To induce chondrogenesis, ATDC5 cells were cultured in the above medium supplemented with 3 × 10⁻⁸ M sodium selenite (Sigma Aldrich) and 10 μg/mL of human recombinant insulin (Wako) for 15 days and were subjected to chromatin preparation. ChIP was performed according to the method previously described [44,45]. Immunoprecipitation was carried out overnight using Dynabeads M-280 (Invitrogen) and the following antibodies: Runx2 (F2) (Santa Cruz, Dallas, TX) or mouse IgG (Cell Signaling, Danvers, MA). Primer sequences are shown in Supplementary Table S1.
4.4. Generation of Antxr1–/– Mice and Antxr1 tg Mice
Antxr1–/– mice were generated as described previously [7]. The mice were backcrossed with C57BL/6 mice more than 7 times before analysis. The embryos at E15.5 and E16.5, newborns, female mice at 6 weeks of age, and male and female mice at 10 weeks of age were analyzed. To generate Antxr1 tg mice, a 1902-bp mouse Antxr1 cDNA fragment was cloned into the NotI site of a pNASSβ expression vector (Clontech, Mountain View, CA, USA), which contained the promoter and enhancer of the mouse Col2a1 gene [18]. The construct was injected into the pronuclei of fertilized eggs from F1 hybrid mice (C57BL/6 × C3H). Mutant embryos were identified by genomic PCR. Transgene expression was measured by real-time RT-PCR using RNA purified from the vertebrae, ribs, or limbs. We normalized the values obtained to those of β-actin. We obtained 67 and 199 F0 embryos at E15.5 and E18.5, respectively; 14 embryos at E15.5 and 30 embryos at E18.5 were Antxr1 tg; and we analyzed the F0 embryos. Prior to the study, all experimental protocols were reviewed and approved by the Animal Care and Use Committee of Nagasaki University Graduate School of Biomedical Sciences (No. 1903131520-2). Animals were housed 3 per cage in a pathogen-free environment on a 12-h light cycle at 22 ± 2 °C with standard chow (CLEA Japan, Tokyo, Japan) and had free access to tap water.
4.5. Skeletal, Histological, and Micro-CT Analyses
For skeletal preparations, embryos at E15.5 and E18.5 and newborn mice whose skin and internal organs were removed were fixed in 99% ethanol for 4 days. The skeletons were then stained for 38 hrs with 0.015% Alcian blue 8GX in 20% acetic acid and 80% ethanol at 37 °C with shaking. After washing with 99% ethanol overnight, the skeletons were stained with 0.004% alizarin red-S in 1% KOH overnight. They were cleared in 1% KOH solution and immersed in 50% glycerol and finally to 100% glycerol. To measure the lengths of femurs and tibiae, they were individually separated from the other skeletons. For histological analyses, mice were fixed in 4% paraformaldehyde/0.1 M phosphate buffer and were embedded in paraffin. Sections of 4 or 7 μm in thickness were stained with H-E or von Kossa or double-stained with von Kossa and H-E. The lengths of femurs and tibiae were also measured using the longitudinal sections through the center of the bones with the same anterior-posterior axis. TUNEL staining was performed using the ApopTag® Peroxidase In Situ Apoptosis Detection Kit (Sigma Aldrich). To analyze BrdU incorporation, we subcutaneously injected BrdU into the back of pregnant mice at E18.5 at 100 μg/g of body weight 1 h before sacrifice and detected BrdU incorporation using a BrdU staining kit (Invitrogen). The sections were counterstained with hematoxylin. We carried out in situ hybridization using mouse Col2a1, Col10a1, Spp1, and Col1a1 antisense probes as described previously [16]. In situ hybridization using sense probes produced no significant signals (data not shown). For ALP staining and double-staining with Alcian blue and von Kossa, E18.5 embryos were fixed in 4% paraformaldehyde at 4 °C for 2 h, washed with PBS at 4 °C for 1 hr, immersed in 20% sucrose at 4 °C overnight, embedded in O. C. T. Compound (Sakura Finetek, Tokyo, Japan), frozen in a refrigerated installation (Rikakikai UT-2000F, Tokyo, Japan) containing −100 °C hexane and pentane (10:3), and sectioned at 7-μm thickness using a Leica CM3050S (Leica Biosystems, Tokyo, Japan). For ALP staining, the cryosections were stained with the solution containing 0.1 mg/mL of Naphthol AS–MX phosphate (Sigma Aldrich), 0.05% N,N–dimethylformamide (Wako), 0.1 M Tris–HCl (pH: 8.5), and 0.6 mg/mL of Fast BB salt (Sigma Aldrich). For double-staining of Alcian blue and von Kossa, the cryosections were stained with Alcian blue and then stained with 5% silver nitrate in DDW. The skull length was measured using a micro-CT system (R_mCT, Rigaku Corporation, Tokyo, Japan). All measurements of the lengths of bones or skulls using skeletal preparations, histological sections, raw bones, or micro-CT images were done by two researchers in a double-blind manner.
4.6. Statistical Analysis
Values are shown as the mean ± SD. Statistical analyses were performed by the Student’s t-test. A p-value of less than 0.05 was considered significant.
Acknowledgments
We thank M. Maki for secretarial assistance.
Supplementary Materials
Supplementary materials can be found in additional file. Supplementary materials can be found at https://www.mdpi.com/1422-0067/21/7/2425/s1.
Author Contributions
Methodology, Q.J. and X.Q.; formal analysis, Q.J. and X.Q.; investigation, Q.J., X.Q., C.A.Y., H.K., K.Y., and V.K.; software, S.O. and H.H.; resources, B.S.C.; data curation, Q.J., X.Q., and T.K.; writing-original draft preparation, Q.J., X.Q, and T.K.; writing—review and editing, T.K.; supervision, T.K.; project administration, T.K.; funding acquisition, X.Q., H.K., V.K.S.K.-M., and T.K. All authors have read and agreed to the published version of the manuscript.
Funding
This work was supported by grants from the Japanese Ministry of Education, Culture, Sports, Science and Technology to X.Q. (Grant number: 19K24124), H.K. (19K18946), V.K. (18K17017), and T.K. (Grant number: 18H05283).
Conflicts of Interest
The authors declare no conflict of interest.
References
- 1.Croix B.S., Bourne J. Genes Expressed in Human Tumor Endothelium. Science. 2000;289:1197–1202. doi: 10.1126/science.289.5482.1197. [DOI] [PubMed] [Google Scholar]
- 2.Bradley K.A., Mogridge J., Mourez M., Collier R.J., Young J.A.T. Identification of the cellular receptor for anthrax toxin. Nature. 2001;414:225–229. doi: 10.1038/n35101999. [DOI] [PubMed] [Google Scholar]
- 3.Stranecky V., Hoischen A., Hartmannova H., Zaki M., Chaudhary A., Zudaire E., Noskova L., Baresova V., Pristoupilova A., Hodaňová K., et al. Mutations in ANTXR1 Cause GAPO Syndrome. Am. J. Hum. Genet. 2013;92:792–799. doi: 10.1016/j.ajhg.2013.03.023. [DOI] [PMC free article] [PubMed] [Google Scholar]
- 4.Wajntal A., Koiffmann C.P., Mendonca B., Sotto M.N., Rati P.B.M., Opitz J.M., Epps-Quaglia D. GAPO syndrome (McKusick 23074)—A connective tissue disorder: Report on two affected sibs and on the pathologic findings in the older. Am. J. Med Genet. 1990;37:213–223. doi: 10.1002/ajmg.1320370210. [DOI] [PubMed] [Google Scholar]
- 5.Nanda A., Carson-Walter E.B., Seaman S., Barber T.D., Stampfl J., Singh S., Vogelstein B., Kinzler K.W., Croix B.S. TEM8 Interacts with the Cleaved C5 Domain of Collagen α3(VI) Cancer Res. 2004;64:817–820. doi: 10.1158/0008-5472.CAN-03-2408. [DOI] [PubMed] [Google Scholar]
- 6.Werner E., Kowalczyk A.P., Faundez V. Anthrax toxin receptor 1/tumor endothelium marker 8 mediates cell spreading by coupling extracellular ligands to the actin cytoskeleton. J. Biol. Chem. 2006;281:23227–23236. doi: 10.1074/jbc.M603676200. [DOI] [PubMed] [Google Scholar]
- 7.Cullen M., Seaman S., Chaudhary A., Yang M.Y., Hilton M.B., Logsdon D., Haines D.C., Tessarollo L., Croix B.S. Host-derived tumor endothelial marker 8 promotes the growth of melanoma. Cancer Res. 2009;69:6021–6026. doi: 10.1158/0008-5472.CAN-09-1086. [DOI] [PMC free article] [PubMed] [Google Scholar]
- 8.Besschetnova T.Y., Ichimura T., Katebi N., Croix B.S., Bonventre J.V., Olsen B.R. Regulatory mechanisms of anthrax toxin receptor 1-dependent vascular and connective tissue homeostasis. Matrix Boil. 2015;42:56–73. doi: 10.1016/j.matbio.2014.12.002. [DOI] [PMC free article] [PubMed] [Google Scholar]
- 9.Komori T. Molecular Mechanism of Runx2-Dependent Bone Development. Mol Cells. 2020;43:168–175. doi: 10.14348/molcells.2019.0244. [DOI] [PMC free article] [PubMed] [Google Scholar]
- 10.Kawane T., Qin X., Jiang Q., Miyazaki T., Komori H., Yoshida C.A., Matsuura-Kawata V.K.D.S., Sakane C., Matsuo Y., Nagai K., et al. Runx2 is required for the proliferation of osteoblast progenitors and induces proliferation by regulating Fgfr2 and Fgfr3. Sci. Rep. 2018;8:13551. doi: 10.1038/s41598-018-31853-0. [DOI] [PMC free article] [PubMed] [Google Scholar]
- 11.Qin X., Jiang Q., Miyazaki T., Komori T. Runx2 regulates cranial suture closure by inducing hedgehog, Fgf, Wnt and Pthlh signaling pathway gene expressions in suture mesenchymal cells. Hum. Mol. Genet. 2018;28:896–911. doi: 10.1093/hmg/ddy386. [DOI] [PubMed] [Google Scholar]
- 12.Nakashima K., Zhou X., Kunkel G.R., Zhang Z., Deng J.M., Behringer R.R., De Crombrugghe B. The novel zinc finger-containing transcription factor osterix is required for osteoblast differentiation and bone formation. Cell. 2002;108:17–29. doi: 10.1016/S0092-8674(01)00622-5. [DOI] [PubMed] [Google Scholar]
- 13.Yoshida C.A., Komori H., Maruyama Z., Miyazaki T., Kawasaki K., Furuichi T., Fukuyama R., Mori M., Yamana K., Nakamura K., et al. SP7 Inhibits Osteoblast Differentiation at a Late Stage in Mice. PLOS ONE. 2012;7:e32364. doi: 10.1371/journal.pone.0032364. [DOI] [PMC free article] [PubMed] [Google Scholar]
- 14.Nakatomi C., Nakatomi M., Matsubara T., Komori T., Doi-Inoue T., Ishimaru N., Weih F., Iwamoto T., Matsuda M., Kokabu S., et al. Constitutive activation of the alternative NF-kappaB pathway disturbs endochondral ossification. Bone. 2019;121:29–41. doi: 10.1016/j.bone.2019.01.002. [DOI] [PubMed] [Google Scholar]
- 15.Moriishi T., Ozasa R., Ishimoto T., Nakano T., Hasegawa T., Miyazaki T., Liu W., Fukuyama R., Wang Y., Komori H., et al. Osteocalcin is necessary for the alignment of apatite crystallites, but not glucose metabolism, testosterone synthesis, or muscle mass. PLoS Genet. 2020 doi: 10.1371/journal.pgen.1008586. in press. [DOI] [PMC free article] [PubMed] [Google Scholar]
- 16.Inada M., Yasui T., Nomura S., Miyake S., Deguchi K., Himeno M., Sato M., Yamagiwa H., Kimura T., Yasui N., et al. Maturational disturbance of chondrocytes inCbfa1-deficient mice. Dev. Dyn. 1999;214:279–290. doi: 10.1002/(SICI)1097-0177(199904)214:4<279::AID-AJA1>3.0.CO;2-W. [DOI] [PubMed] [Google Scholar]
- 17.Kim I.S., Otto F., Zabel B., Mundlos S. Regulation of chondrocyte differentiation by Cbfa1. Mech. Dev. 1999;80:159–170. doi: 10.1016/S0925-4773(98)00210-X. [DOI] [PubMed] [Google Scholar]
- 18.Ueta C., Iwamoto M., Kanatani N., Yoshida C., Liu Y., Enomoto-Iwamoto M., Ohmori T., Enomoto H., Nakata K., Takada K., et al. Skeletal Malformations Caused by Overexpression of Cbfa1 or Its Dominant Negative Form in Chondrocytes. J. Cell Boil. 2001;153:87–100. doi: 10.1083/jcb.153.1.87. [DOI] [PMC free article] [PubMed] [Google Scholar]
- 19.Takeda S., Bonnamy J.-P., Owen M.J., Ducy P., Karsenty G. Continuous expression of Cbfa1 in nonhypertrophic chondrocytes uncovers its ability to induce hypertrophic chondrocyte differentiation and partially rescues Cbfa1-deficient mice. Genome Res. 2001;15:467–481. doi: 10.1101/gad.845101. [DOI] [PMC free article] [PubMed] [Google Scholar]
- 20.Enomoto H., Enomoto-Iwamoto M., Iwamoto M., Nomura S., Himeno M., Kitamura Y., Kishimoto T., Komori T. Cbfa1 Is a Positive Regulatory Factor in Chondrocyte Maturation. J. Boil. Chem. 2000;275:8695–8702. doi: 10.1074/jbc.275.12.8695. [DOI] [PubMed] [Google Scholar]
- 21.Yoshida C.A., Yamamoto H., Fujita T., Furuichi T., Ito K., Inoue K.-I., Yamana K., Zanma A., Takada K., Ito Y., et al. Runx2 and Runx3 are essential for chondrocyte maturation, and Runx2 regulates limb growth through induction of Indian hedgehog. Genome Res. 2004;18:952–963. doi: 10.1101/gad.1174704. [DOI] [PMC free article] [PubMed] [Google Scholar]
- 22.St-Jacques B., Hammerschmidt M., McMahon A.P. Indian hedgehog signaling regulates proliferation and differentiation of chondrocytes and is essential for bone formation. Genome Res. 1999;13:2072–2086. doi: 10.1101/gad.13.16.2072. [DOI] [PMC free article] [PubMed] [Google Scholar]
- 23.Vortkamp A., Lee K., Lanske B., Segre G.V., Kronenberg H.M., Tabin C.J. Regulation of Rate of Cartilage Differentiation by Indian Hedgehog and PTH-Related Protein. Sci. 1996;273:613–622. doi: 10.1126/science.273.5275.613. [DOI] [PubMed] [Google Scholar]
- 24.Iwamoto M., Kitagaki J., Tamamura Y., Gentili C., Koyama E., Enomoto H., Komori T., Pacifici M., Enomoto-Iwamoto M. Runx2 expression and action in chondrocytes are regulated by retinoid signaling and parathyroid hormone-related peptide (PTHrP) Osteoarthr. Cartil. 2003;11:6–15. doi: 10.1053/joca.2002.0860. [DOI] [PubMed] [Google Scholar]
- 25.Ohba S., He X., Hojo H., McMahon A.P. Distinct Transcriptional Programs Underlie Sox9 Regulation of the Mammalian Chondrocyte. Cell Rep. 2015;12:229–243. doi: 10.1016/j.celrep.2015.06.013. [DOI] [PMC free article] [PubMed] [Google Scholar]
- 26.Wu L.N.Y., Ishikawa Y., Sauer G.R., Genge B.R., Mwale F., Mishima H., Wuthier R.E. Morphological and biochemical characterization of mineralizing primary cultures of avian growth plate chondrocytes: Evidence for cellular processing of Ca2+ and Pi prior to matrix mineralization. J. Cell. Biochem. 1995;57:218–237. doi: 10.1002/jcb.240570206. [DOI] [PubMed] [Google Scholar]
- 27.Mansfield K., Teixeira C., Adams C.S., Shapiro I. Phosphate ions mediate chondrocyte apoptosis through a plasma membrane transporter mechanism. Bone. 2001;28:1–8. doi: 10.1016/S8756-3282(00)00409-9. [DOI] [PubMed] [Google Scholar]
- 28.Magne D., Bluteau G., Faucheux C., Palmer G., Vignes-Colombeix C., Pilet P., Rouillon T., Caverzasio J., Weiss P., Daculsi G., et al. Phosphate is a specific signal for ATDC5 chondrocyte maturation and apoptosis-associated mineralization: possible implication of apoptosis in the regulation of endochondral ossification. J. Bone Miner. Res. 2003;18:1430–1442. doi: 10.1359/jbmr.2003.18.8.1430. [DOI] [PMC free article] [PubMed] [Google Scholar]
- 29.Olsen B.R., Berendsen A.D., Besschetnova T.Y., Duan X., Hu K. Regulatory mechanisms of skeletal and connective tissue development and homeostasis – lessons from studies of human disorders. Int. J. Exp. Pathol. 2016;97:296–302. doi: 10.1111/iep.12198. [DOI] [PMC free article] [PubMed] [Google Scholar]
- 30.Chaudhary A., Hilton M.B., Seaman S., Haines D.C., Stevenson S., Lemotte P.K., Tschantz W.R., Zhang X.M., Saha S., Fleming T., et al. TEM8/ANTXR1 blockade inhibits pathological angiogenesis and potentiates tumoricidal responses against multiple cancer types. Cancer Cell. 2012;21:212–226. doi: 10.1016/j.ccr.2012.01.004. [DOI] [PMC free article] [PubMed] [Google Scholar]
- 31.Gong Q., Liu C., Wang C., Zhuang L., Zhang L., Wang X. Effect of silencing TEM8 gene on proliferation, apoptosis, migration and invasion of XWLC-05 lung cancer cells. Mol. Med. Rep. 2017;17:911–917. doi: 10.3892/mmr.2017.7959. [DOI] [PMC free article] [PubMed] [Google Scholar]
- 32.Cao C., Wang Z., Huang L., Bai L., Wang Y., Liang Y., Dou C., Wang L. Down-regulation of tumor endothelial marker 8 suppresses cell proliferation mediated by ERK1/2 activity. Sci. Rep. 2016;6:23419. doi: 10.1038/srep23419. [DOI] [PMC free article] [PubMed] [Google Scholar]
- 33.Wang D., Canaff L., Davidson D., Corluka A., Liu H., Hendy G., Henderson J.E. Alterations in the Sensing and Transport of Phosphate and Calcium by Differentiating Chondrocytes. J. Boil. Chem. 2001;276:33995–34005. doi: 10.1074/jbc.M007757200. [DOI] [PubMed] [Google Scholar]
- 34.Kakuta S., Golub E.E., Shapiro I.M. Morphochemical analysis of phosphorus pools in calcifying cartilage. Calcif. Tissue Int. 1985;37:293–299. doi: 10.1007/BF02554877. [DOI] [PubMed] [Google Scholar]
- 35.Mwale F., Chetina E.V., Wu C.W., Poole A.R. The Assembly and Remodeling of the Extracellular Matrix in the Growth Plate in Relationship to Mineral Deposition and Cellular Hypertrophy: An In Situ Study of Collagens II and IX and Proteoglycan. J. Bone Miner. Res. 2002;17:275–283. doi: 10.1359/jbmr.2002.17.2.275. [DOI] [PubMed] [Google Scholar]
- 36.Komori T. Cell Death in Chondrocytes, Osteoblasts, and Osteocytes. Int. J. Mol. Sci. 2016;17:2045. doi: 10.3390/ijms17122045. [DOI] [PMC free article] [PubMed] [Google Scholar]
- 37.O’Regan A., Berman J.S. Osteopontin: a key cytokine in cell-mediated and granulomatous inflammation. Int. J. Exp. Pathol. 2000;81:373–390. doi: 10.1046/j.1365-2613.2000.00163.x. [DOI] [PMC free article] [PubMed] [Google Scholar]
- 38.Ito K., Maruyama Z., Sakai A., Izumi S., Moriishi T., A Yoshida C., Miyazaki T., Komori H., Takada K., Kawaguchi H., et al. Overexpression of Cdk6 and Ccnd1 in chondrocytes inhibited chondrocyte maturation and caused p53-dependent apoptosis without enhancing proliferation. Oncogene. 2013;33:1862–1871. doi: 10.1038/onc.2013.130. [DOI] [PubMed] [Google Scholar]
- 39.Komori T. Regulation of Rb family proteins by Cdk6/Ccnd1 in growth plates. Cell Cycle. 2013;12:2161–2162. doi: 10.4161/cc.25515. [DOI] [PMC free article] [PubMed] [Google Scholar]
- 40.Kamekura S., Kawasaki Y., Hoshi K., Shimoaka T., Chikuda H., Maruyama Z., Komori T., Sato S., Takeda S., Karsenty G., et al. Contribution of runt-related transcription factor 2 to the pathogenesis of osteoarthritis in mice after induction of knee joint instability. Arthritis Rheum. 2006;54:2462–2470. doi: 10.1002/art.22041. [DOI] [PubMed] [Google Scholar]
- 41.Liao L., Zhang S., Gu J., Takarada T., Yoneda Y., Huang J., Zhao L., Oh C., Li J., Wang B., et al. Deletion of Runx2 in Articular Chondrocytes Decelerates the Progression of DMM-Induced Osteoarthritis in Adult Mice. Sci. Rep. 2017;7:2371. doi: 10.1038/s41598-017-02490-w. [DOI] [PMC free article] [PubMed] [Google Scholar]
- 42.Catheline S., Hoak D., Chang M., Ketz J.P., Hilton M.J., Zuscik M.J., Jonason J.H. Chondrocyte-Specific RUNX2 Overexpression Accelerates Post-traumatic Osteoarthritis Progression in Adult Mice. J. Bone Miner. Res. 2019;34:1676–1689. doi: 10.1002/jbmr.3737. [DOI] [PMC free article] [PubMed] [Google Scholar]
- 43.Ji H., Jiang H., Ma W., Johnson D.S., Myers R.M., Wong W. An integrated software system for analyzing ChIP-chip and ChIP-seq data. Nat. Biotechnol. 2008;26:1293–1300. doi: 10.1038/nbt.1505. [DOI] [PMC free article] [PubMed] [Google Scholar]
- 44.Odom D.T., Zizlsperger N., Gordon D.B., Bell G.W., Rinaldi N., Murray H.L., Volkert T.L., Schreiber J., Rolfe P.A., Gifford D.K., et al. Control of Pancreas and Liver Gene Expression by HNF Transcription Factors. Sci. 2004;303:1378–1381. doi: 10.1126/science.1089769. [DOI] [PMC free article] [PubMed] [Google Scholar]
- 45.Vokes S.A., Ji H., McCuine S., Tenzen T., Giles S., Zhong S., Longabaugh W.J., Davidson E.H., Wong W., McMahon A.P. Genomic characterization of Gli-activator targets in sonic hedgehog-mediated neural patterning. Dev. 2007;134:1977–1989. doi: 10.1242/dev.001966. [DOI] [PubMed] [Google Scholar]
Associated Data
This section collects any data citations, data availability statements, or supplementary materials included in this article.


