

Abstract

Murine double minute 2 (MDM2) proteins are found to be overproduced by many human tumors in order to inhibit the functioning of p53 molecules, a tumor suppressor protein. Thus, reactivating p53 functioning in cancer cells by disrupting p53–MDM2 interactions may offer a significant approach in cancer treatment. However, the structural characterization of the p53–MDM2 complex at the atomistic level and the mechanism of binding/unbinding of the p53–MDM2 complex still remain unclear. Therefore, we demonstrate here the probable binding (unbinding) pathway of transactivation domain 1 of p53 during the formation (dissociation) of the p53–MDM2 complex in terms of free energy as a function of reaction coordinate from the potential of mean force (PMF) study using two different force fields: ff99SB and ff99SB-ILDN. From the PMF plot, we noticed the PMF to have a minimum value at a p53–MDM2 separation of 12 Å, with a dissociation energy of 30 kcal mol–1. We also analyzed the conformational dynamics and stability of p53 as a function of its distance of separation from MDM2. The secondary structure content (helix and turns) in p53 was found to vary with its distance of separation from MDM2. The p53–MDM2 complex structure with lowest potential energy was isolated from the ensemble at the reaction coordinate corresponding to the minimum PMF value and subjected to molecular dynamics simulation to identify the interface surface area, interacting residues at the interface, and the stability of the complex. The simulation results highlight the importance of hydrogen bonds and the salt bridge between Lys94 of MDM2 and Glu17 of p53 in the stability of the p53–MDM2 complex. We also carried out the binding free energy calculations and the per residue energy decomposition analyses of the interface residues of the p53–MDM2 complex. We found that the binding affinity between MDM2 and p53 is indeed high [ΔGbind = −7.29 kcal mol–1 from molecular mechanics/Poisson–Boltzmann surface area (MM/PBSA) and ΔGbind = −53.29 kcal mol–1 from molecular mechanics/generalized borne surface area]. The total binding energy obtained using the MM/PBSA method was noticed to be closer to the experimental values (−6.4 to −9.0 kcal mol–1). The p53–MDM2 complex binding profile was observed to follow the same trend even in the duplicate simulation run and also in the simulation carried out with different force fields. We found that Lys51, Leu54, Tyr100, and Tyr104 from MDM2 and the residues Phe19, Trp23, and Leu26 from p53 provide the highest energy contributions for the p53–MDM2 interaction. Our findings highlight the prominent structural and binding characteristics of the p53–MDM2 complex that may be useful in designing potential inhibitors to disrupt the p53–MDM2 interactions.
1. Introduction
Protein–protein interactions (PPIs) have a dominant role in the identification of huge number of biological processes as well as biomolecules.1−3 Most of the essential biological processes such as enzyme catalysis, immune system modulation, gene expression, and adjustment of signal pathways depend crucially on the regulation of the PPIs.4−6 Moreover, the designing of drugs is mainly based on the modification of PPIs. The current focus of the researchers is on studying the structure and function of proteins. This is because the root cause of many diseases is related to disorders present in proteins.
The tumor suppressor p53 plays a significant role in many essential biological processes, which include regulation of cell cycle, DNA repair, apoptosis, and senescence.7−11 It has been found that p53 is among the commonly mutated proteins in human tumors because of its highly potent tumor suppressor role. Nearly 50% of human cancers have modifications in the p53 gene, causing inactivation or loss of p53 protein. Moreover, p53 function is effectively inhibited even in cancer cells retaining wild-type p53.8,12 This type of p53 function inhibition is carried out by the murine double minute 2 (MDM2; HDM2 in humans) protein.
MDM2 is an oncoprotein, discovered by its overexpression in a spontaneously transformed mouse cancer cell line.8,12−15 MDM2 is known to exhibit both p53-independent and p53-dependent functions. Considering the p53-dependent manner, MDM2 directly binds to p53, forms a complex with it, and then inhibits transactivation of p53.13 Moreover, it has also been found that there are two other sites of interaction between p53 and MDM2: one is between the acidic domain of MDM2 and the DNA binding domain of p53,16−18 and the other is between the N-terminal domain (NTD) of MDM2 and the C-terminal domain of p53.19 An extensive amount of data has confirmed that MDM2 plays the central role in the p53 pathway.
In normal cells, the activity and protein levels of p53 are controlled by MDM2 via an auto-regulatory loop. p53 activation transcribes mRNAs of MDM2, resulting in an increase in the number of MDM2 proteins, which results in inhibition of p53 activity.20 MDM2 is a ubiquitously expressed protein and known for its role in the development of tissues, whereas p53 provides a powerful tumor surveillance mechanism. Deregulation of MDM2–p53 balance leads to the malignant alteration of cells. Overexpression of MDM2 results in cells with a growth advantage, supports tumorigenesis, correlates with poorer clinical prognosis, and thereby affects the response to cancer therapy.21−27 The basic finding is that MDM2 inhibits the function of p53 upon binding. This has led to the remarks that MDM2 overexpression and p53 mutations should be mutually exclusive in tumors. Moreover, in a study, gene amplification of MDM2 was found in tumors of 28 different types consisting of more than 3000 tumors, which strongly favored this notion and established a negative correlation between amplification of MDM2 and occurrence of p53 mutations.19 Hence, MDM2 is considered as a therapeutic target in the cancers retaining wild-type p53.
All the characteristics of biomolecules, including PPIs can be investigated at the molecular to atomic level by means of molecular dynamics (MD) simulation,28 which can help us understand the microscopic mechanisms of biological processes. The force field used determines the accuracy of the simulation. In this study, the Assisted Model Building with Energy Refinement (AMBER) ff99SB force field29 is used in the MD simulation. One of the key issues in MD simulation, as well as drug design, is calculating the binding free energy (BFE) between the receptor and the ligand. BFE30 is the parameter that determines the binding strength between the receptor and the ligand, making its calculation vital for both studying the mechanism of interaction and drug design. There exist certain residues, which act as potential binding sites for drug-like molecules, called hot areas. Drug-like molecules tend to bind to these hot areas in PPI surfaces. The determination of such hotspot residues is another key issue in MD simulation and drug design.31,32 The efficiency of drug design can be substantially improved by the implementation of precise free energy prediction methods. The molecular mechanics/Poisson–Boltzmann surface area (MM/PBSA)33−40 method is usually used in calculating the absolute BFE because of their high efficiency, along with the normal mode (Nmode) method to estimate the change in entropy. However, MM/PBSA is usually used in calculating the relative BFE in the absence of the Nmode method. Per residue energy decomposition (PRED) is a suitable method to obtain hotspot residues in the MM/PBSA method.39−41
Many in silico studies have been performed on the p53–MDM2 interaction.42,43 Some of the simulation studies have discussed about the initial capture of Phe19, which serves to unlock the binding cleft through crack propagation. The results obtained in these studies could explain why the F19A p53 mutant does not bind to MDM2.44 The detrimental effects of the phosphorylation of p53 Thr18,45 p53 Ser20,46 and MDM2 Ser1747 in the p53–MDM2 complex have also been extensively studied using MD and Brownian dynamics.48 The studies have also confirmed that p53 predominantly interacts with the NTD of MDM2 via its transactivation domain 1 (TAD1). The crystal structure of MDM2 complexed with TAD1 of p53 shows the interaction mediated by three critical residues (Phe19, Trp23, and Leu26) of p53.49 The p53–MDM2 interaction was chosen as the model system to validate the computational alanine scanning technique,50−52 and the computed BFE change upon alanine mutation of the p53 peptide residues agreed qualitatively with the experimental data. Phe19, Trp23, Leu26, and Leu22 of p53 were found to play a critical role in forming the complex with MDM2. Some of the comprehensive computational studies like enhanced sampling techniques, umbrella sampling (US), and variational free energy profile methods have emphasized on the effect of ligand binding on the structure and dynamics of the N-terminal lid region of MDM2.53 The p53–MDM2 interaction was one of the first to be targeted by stapled peptides, the most successful of which has reached clinical trials.54 Computational methods have played a significant role in understanding the mechanism of stapled peptide binding to MDM2 and also the design of new stapled peptide inhibitors of MDM2.55 In 2016, Markov state models (MSMs) of apo-MDM2 were constructed from large collections of unbiased simulation trajectories to find strong evidence for diffuse yet two-state folding and binding of the N-terminal region to the p53 receptor site.56 In the recent past, using replica exchange MD (REMD) and MSM, the conformational distribution and kinetics of p53 N-terminal TAD2 and its dual-site phosphorylated form (pSer46 and pThr55) were studied.57 In addition, a simple four-state kinetic model was parameterized using microscopic rate information from the MSM in order to predict the binding mechanisms, pathways, and rates of the p53–MDM2 complex.58 The dissociation pathways of the complex of MDM2 protein and the TAD of p53 protein (TAD1) were efficiently generated without applying force bias with parallel cascade selection MD (PaCS-MD) and showed that PaCS-MD when combined with the MSM resulted in a BFE comparable to experimental values.59 The energy landscape of the total mutagenesis of MDM2 was also determined to identify highly mutable and constrained sites within the protein. For the computational analysis, MUMBO was used to rotamerize the p53–MDM2 crystal structure (PDB ID: 1YCR) to obtain the point mutations.60 The weighted ensemble path sampling strategy was used to coordinate MD simulations, generating atomistic views of protein–peptide binding pathways involving the MDM2 oncoprotein and an intrinsically disordered p53 peptide.61 A quite a number of computational studies40,50,60,62,63 have been carried out earlier to determine the BFE for the p53–MDM2 complex, and the values have been found to be near to the experimental BFE values (−6.4 to −9.0 kcal mol–1).64,65 The p53–MDM2 interaction has also been studied by considering the complex as a CABS coarse-grained protein model that utilizes a Monte Carlo sampling scheme and a knowledge-based statistical force field.66 The conformational landscapes of MDM2-binding p53 peptides were characterized using REMD simulations.67
In the present study, the probable binding and unbinding pathways of the TAD1 of p53 and MDM2 during the formation and dissociation of the p53–MDM2 complex have been determined in terms of the potential of mean force (PMF) using two different force fields. We have also investigated the conformational dynamics and stability of the TAD1 of the p53 molecule as a function of its center of mass (CoM) distance from MDM2. We also carried out BFE and PRED analyses to infer the binding characteristics and identify hotspot residues across the interface of the p53–MDM2 complex.
For the BFE and PRED analyses, we have used molecular mechanics energies combined with Poisson–Boltzmann or generalized Born and surface area continuum solvation [MM/PBSA and molecular mechanics/generalized borne surface area (MM/GBSA)] methods33−41 using MMPBSA.py script of the AMBER software package. This method is considered to be one of the popular approaches owing to their modular nature to calculate the free energy of binding of small molecules to a biomolecule. This method provides better results as it allows the user to adopt flexible and appropriate values for the complex system under study in relation to the dielectric constant, parameters for the non-polar energy, thermodynamic approximations, the radii used for the PB or GB calculations, whether to include the entropy term, and whether to perform MD simulations or minimizations. Moreover, it provides an instinctive mechanism for predicting the ligand and receptor covers of a complex based on the topology files provided and analyses topology files for parameter constancy. This MMPBSA.py script was also reported as an efficient program for end state free energy calculations.68 For better results, in this MMPBSA.py script, a more detailed estimates of non-polar energies has been implemented by considering a new non-polar solvation term, which comprises a (repulsive) cavitation term and a (attractive) dispersion term.37,69−74
2. Results & Discussion
2.1. PMF Profile of the p53–MDM2 Complex
We have conducted a PMF study by combining MD simulations with the US method75 to examine the degree of association of p53 with MDM2 in forming the complex. The PMF profile for the p53–MDM2 complex in water at room temperature as a function of reaction coordinate has been shown in Figure 1. Here, the reaction coordinate is described as the distance between the centers of mass of p53 and MDM2. From Figure 1, we see the presence of a minimum PMF value of the p53–MDM2 complex at a distance of separation of 12 Å with a dissociation energy of 30 kcal mol–1. We observed p53 and MDM2 to show no more interactions when the distance of separation between them crosses 22 Å. However, when the interchain distance between p53 and MDM2 was decreased from an optimum distance of 12 Å, we noticed the PMF to increase because of repulsive forces between p53 and MDM2. To ensure the PMF profile of the p53–MDM2 complex, we have carried out the MD simulations of this complex using another force field (ff99SB-ILDN) and obtained almost a similar PMF profile (as depicted in the Figure S1).
Figure 1.

PMF as a function of the reaction coordinate for the association and dissociation of the p53–MDM2 complex.
2.2. Analysis of Conformational Dynamics of p53 as a Function of Its CoM Distance from MDM2
During the US simulation of the p53–MDM2 complex, we found p53 to undergo a rapid change in its conformational dynamics. The snapshots of the p53–MDM2 complex obtained at different windows of the distance of separation as defined by the reaction coordinate are shown in Figure 2. The snapshots have been constructed using UCSF Chimera v.1.13.1.76 Distinct colors have been used to depict the secondary structure portions of the p53–MDM2 complex. We observed the helical portion present in p53 to decrease with its distance of separation from MDM2.
Figure 2.

Snapshots of p53–MDM2 complex structures at discrete distance of separation (in Å) from MDM2 (purple color = helices, green color = coils, and red color = strands).
2.2.1. Root Mean Square Deviation Analysis for p53 as a Function of Its CoM Distance from MDM2
We have carried out the root mean square deviation (rmsd) analysis to know the structural stability of p53 in the p53–MDM2 complex during the course of US simulation. Figure 3a represents the rmsd analysis for the p53 molecule in the complex when the interchain distance between p53 and MDM2 is decreased from an optimum distance of 12 to 7 Å. Figure 3b represents the rmsd analysis for the p53 molecule in the complex when the interchain distance between p53 and MDM2 is increased from an optimum distance of 12 to 26 Å. From Figure 3a, it can be seen that p53 undergo changes in its conformation more rapidly when it is pushed more toward MDM2 from its optimum distance. This is because of an increase in strong van der Waals forces with a decrease in distance between p53 and MDM2. From Figure 3b, it can be observed that p53 exhibits different foldings at different intervals of distance from MDM2 when it is pulled away from its optimum distance. p53 was initially observed to take a fold that is maintained until the distance of separation from MDM2 reaches 17 Å. At 17 Å, p53 takes a new fold and that is maintained till the distance of separation reaches 22 Å. However, when the distance of separation between p53 and MDM2 crosses 22 Å, p53 shows no more interaction with MDM2, and therefore it shows rapid changes in its conformation. As a whole, we have monitored the different folding patterns of p53 during the course of its separation from MDM2. These folding pattern inferences are very much important to design the methods of inhibition for the p53–MDM2 complex.
Figure 3.

rmsd analysis for p53 molecule when the distance of separation between p53 and MDM2 (a) decreased from 12 to 7 Å and (b) increased from 12 to 26 Å.
2.2.2. Dictionary of Secondary Structure of Protein Analysis of p53 as a Function of Its CoM Distance from MDM2
We then performed the dictionary of secondary structure of protein (DSSP)77 analysis using the Kabsch and Sander algorithm78 to investigate the changes in secondary structural elements in the p53 molecule. Figure 4a depicts the secondary structural changes in the p53 molecule when the interchain distance between p53 and MDM2 is decreased from an optimum distance of 12 to 7 Å. Figure 4b represents the secondary structural changes in the p53 molecule when the interchain distance between p53 and MDM2 is increased from an optimum distance of 12 to 26 Å. From Figure 4a, it can be seen that there is an increase in the 310-helix content of p53 with a decrease in the distance of separation between p53 and MDM2. The secondary structural transition from α/3-10 helix to turns have been observed in p53 with an increase in distance of separation between p53 and MDM2 (Figure 4b). However, when the distance of separation between p53 and MDM2 crosses 22 Å, p53 shows no more interaction with MDM2, and therefore it shows marked changes in its conformation and found to contain more turns instead of helical content.
Figure 4.

Evolution of secondary structure evaluated using DSSP is shown for p53 molecule when the distance of separation between p53 and MDM2 (a) decreased from 12 to 7 Å and (b) increased from 12 to 26 Å. Y-axis depicts p53 residues and X-axis depicts time frames as well distance of separation of p53 from MDM2. The secondary structure components of p53 are color-coded as shown in the panel.
2.2.3. Analysis of Probable Secondary Structure per Residue of p53 as a Function of Its CoM Distance from MDM2
Then, we carried out the analysis of the probable secondary structure that can be retained by each residue of p53. Figure 5a represents the probability score versus residue index for the p53 molecule when the interchain distance between p53 and MDM2 is decreased from an optimum distance of 12 to 7 Å. Figure 5b represents the probability score versus residue index for the p53 molecule when the interchain distance between p53 and MDM2 is increased from an optimum distance of 12 to 26 Å. From Figure 5a, we observe that the p53 molecule contains the secondary structure α-helix and 310-helix predominantly in the region 87–95. We also noticed turns with fewer probability scores in the region 92–95. From Figure 5b, we see the p53 molecule to contain α-helical secondary structure with a higher probability score in the region 87–95. However, we also observed the secondary structure turn to evolve with a higher probability score than 310-helix in the region 87–95. This is because when the distance of separation between p53 and MDM2 crosses 22 Å, p53 shows no more interaction with MDM2, and therefore it shows marked changes in the secondary structure resulting in the increase in turns content and decrease in the α-helical as well as 3-10 helix content.
Figure 5.

Probability score for secondary structure analysis for p53 when the distance of separation between p53 and MDM2 (a) decreased from 12 to 7 Å and (b) increased from 12 to 26 Å.
2.2.4. Intramolecular Hydrogen Bond Analyses for p53 as a Function of CoM Distance
Using the trajectory files generated from each window during the PMF analysis, we have performed the intramolecular hydrogen bond analysis for p53. In Figure 6a,b, the intramolecular hydrogen bond analysis for the p53 molecule was shown as a function of the interchain distance (by decreasing and increasing from its optimum distance) between p53 and MDM2. From Figure 6a,b, we see that the number of intramolecular hydrogen bonds present in the p53 molecule to increase evidently when the interchain distance between p53 and MDM2 increases or decreases from an optimum distance of 12 Å. This is because p53 molecule experience varied binding affinity from MDM2 as the distance between them changes.
Figure 6.

Intramolecular hydrogen bond analysis for p53 when the distance of separation between p53 and MDM2 (a) decreased from 12 to 7 Å and (b) increased from 12 to 26 Å.
2.3. Salient Structural Features of the Minimum PMF Structure of the p53–MDM2 Complex
2.3.1. MD Simulation Trajectory Analyses
The minimum PMF structure of the p53–MDM2 complex was isolated from the PMF analysis and then subjected to MD simulation for 100 ns to study the salient structural features of the p53–MDM2 complex: rmsd, root mean square fluctuation (RMSF), radius of gyration (Rg), solvent accessible surface area (SASA), hydrogen bond analyses, protein–protein interface interaction, BFE, and PRED analyses. MD simulations yield in-depth knowledge about the dynamic behavior of a particular system that is being studied and help us to understand the changes in their stability and flexibility over the time period. To check the correctness of our NPT simulation algorithm, we have plotted the density, temperature, pressure, potential energy, kinetic energy, and total energy of the p53–MDM2 complex as a function of the simulation time period (shown in Figure S2a–d).
2.3.1.1. rmsd Analysis of the p53–MDM2 Complex
In a typical MD simulation, the stability of the system is generally studied by tracking the rmsd of that protein/biological molecule as a function of time. For the p53–MDM2 complex studied here, the rmsd values as a function of time have been shown in Figure 7a. Figure 7a shows a comparative rmsd plot for p53, MDM2, and p53–MDM2 complex, where p53, MDM2, and p53–MDM2 complex were observed to have converged at 7500 ps with average rmsd values of 2, 2.5, and 2.5 Å, respectively.
Figure 7.

Structural characteristics (a) rmsd, (b) RMSF, (c) radius of gyration (Rg), and (d) SASA of p53, MDM2, and the complex during 100 ns MD simulation.
2.3.1.2. RMSF Analysis of the p53–MDM2 Complex
Residue flexibility of the p53–MDM2 system was evaluated using the RMSF. Figure 7b shows the RMSF values for C-α atoms of individual p53 and MDM2 in the p53–MDM2 complex with respect to the time evolution of 100 ns trajectories. For the complex, the residue fluctuations were seen for MDM2 between residue numbers 40 and 60, and residue fluctuations were found to be present for N-terminal and C-terminal residues of the p53 chain. The RMSF comparison of p53 and MDM2 from the p53–MDM2 system revealed that MDM2 shows more number of average residue fluctuations than p53.
2.3.1.3. Radius of Gyration (Rg) Analysis of the p53–MDM2 Complex
Rg is generally calculated to assess the total dispersion of atoms in a particular biomolecule from their common center of gravity/axis. The Rg analysis for the p53, MDM2, and p53–MDM2 complex is given in Figure 7c. Here, we observed the Rg values for p53, MDM2, and p53–MDM2 to oscillate within the mean value of 8, 13, and 13 Å, respectively. The curves for p53, MDM2, and p53–MDM2 are seen to be settled throughout the entire course of production dynamics. The profile trend we see in the Rg values for each structure are the reflections endured by each structure because of their intermolecular interactions during the course of the simulation.
2.3.1.4. SASA Analysis of the p53–MDM2 Complex
Overall variations in the total SASA of p53, MDM2, and p53–MDM2 are shown in Figure 7d. The SASA values reflects all the unsuitable (hydrophobic) contacts between the water molecules and biomolecules. To determine the surface area accessible by the water solvent for the p53–MDM2 system, a probe with a radius of 1.4 Å was used. The SASAs of the p53 and MDM2 remained constant at 1000 and 5000 Å2, respectively. However, SASA for the p53–MDM2 complex fluctuated around 6000 Å2. Thus, more the number of residues, more is the number of hydrophobic contacts possible, resulting in a higher SASA value.
2.3.2. Hydrogen Bond Analysis of the p53–MDM2 Complex
Additionally, we also calculated the number of intramolecular hydrogen bonds present in p53 and in MDM2, as well as the number of intermolecular hydrogen bonds present in the p53–MDM2 complex to analyze the stability of the protein complex. The hydrogen bonds obtained are shown in Figure 8 and found to contain the values within the ideal range as proposed for globular proteins.79 An average of 35 hydrogen bonds was found to be present in MDM2 (Figure 8a), an average of three hydrogen bonds was found to be present in p53 (Figure 8b), and an average of five inter-molecular hydrogen bonds was found to be seen in the p53–MDM2 complex (Figure 8c).
Figure 8.

Intramolecular hydrogen bond analysis of (a) MDM2, and (b) p53 and (c) intermolecular hydrogen bond analysis for the p53–MDM2 complex structure.
2.3.3. Determination of the Interface Interactions of the p53–MDM2 Complex
An interface area is generally defined as a region where two sets of proteins come into contact with each other. Surface residues with large surface regions accessible to the solvent available usually characterize them. The interface statistics for the p53–MDM2 complex were obtained upon the submission of the lowest energy structure of the p53–MDM2 complex extracted from the PMF analysis to the PDBsum server.80 The interface statistics have been shown in Table 1. The summarized intermolecular interactions between p53 and MDM2 of the p53–MDM2 complex at the residue levels are shown in Figure 9. The comprehensive contributions of each interface residue stabilizing the p53–MDM2 complex are accordingly given in Table S1. The total number of interface residues in the p53–MDM2 complex was found to be 27. The interface area for the MDM2 chain and the p53 chain involved in the interaction was observed to be 660 and 809 Å2, respectively. The docked complex was stabilized by molecular interactions like salt bridges, hydrogen bonding, and non-bonded contacts. According to Figure 9, eighty-four non-bonded interactions are present along with one salt bridge and three hydrogen bonds between MDM2 and p53. Sixteen residues from MDM2 and eleven residues from p53 are involved in the interaction between MDM2 and p53. The three hydrogen bonds and the single salt bridge present aid the stability of the p53–MDM2 complex. It can be seen that Gln72, Leu54, and Thr26 of MDM2 form hydrogen bonds with Glu17, Trp23, and Asn29 of p53, respectively. Another key observation is that Lys94 of MDM2 forms a salt bridge with Glu17 of p53 in the complex which is the only key difference between the interface statistics of the lowest energy p53–MDM2 structure and the experimentally determined p53–MDM2 complex structure present in the RCSB Protein Data Bank,81 bearing the PDB ID: 1YCR.
Table 1. Interface Statistics for the Minimum PMF Structure of the p53–MDM2 Complex.
| chain | no. of interface residues | interface area (Å2) | no. of salt bridges | no. of disulfide bonds | no. of hydrogen bonds | no. of non-bonded contacts |
|---|---|---|---|---|---|---|
| MDM2 | 16 | 660 | 1 | 3 | 84 | |
| p53 | 11 | 809 |
Figure 9.
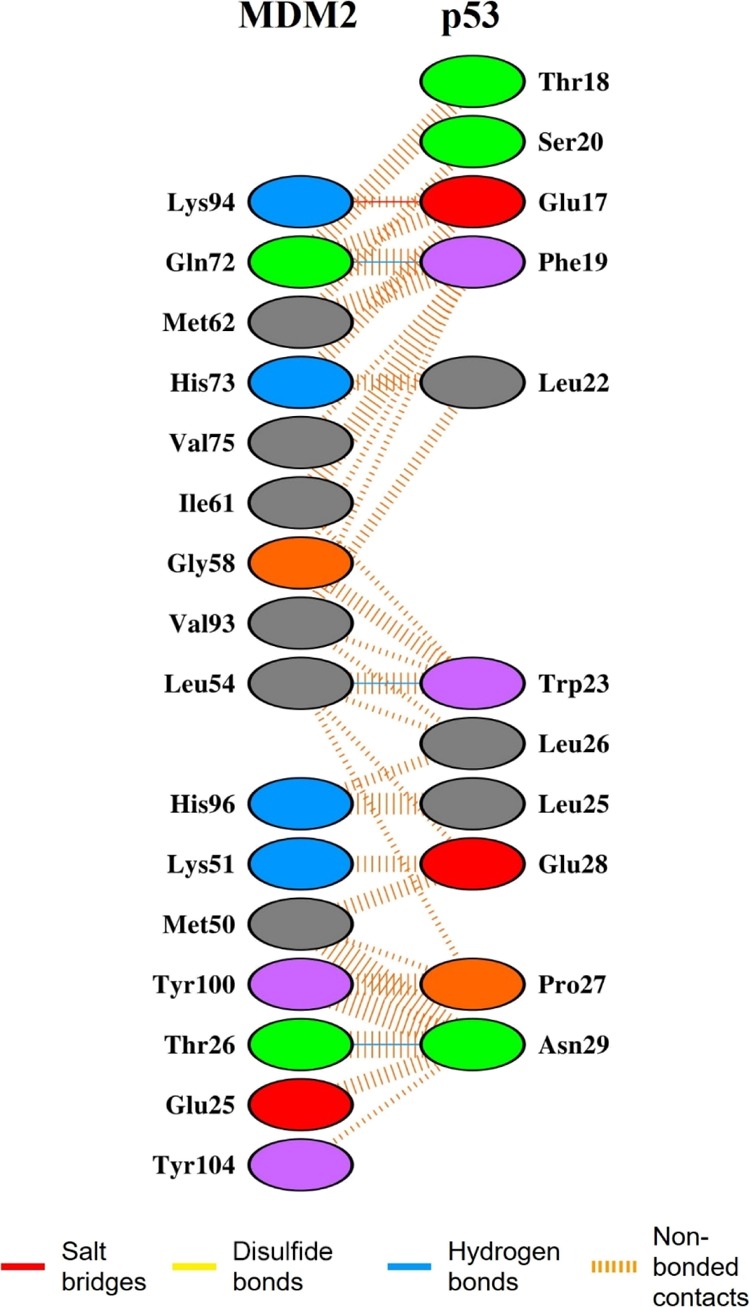
Intermolecular interactions between MDM2 and p53 in the minimum PMF structure of the p53–MDM2 complex.
2.3.4. BFE and PRED Analysis
The BFE calculations of p53 and MDM2 to form the p53–MDM2 complex were done using the MM–PBSA/GBSA method. The values here represent only the relative BFE rather than absolute or total binding energy, as MM–PBSA/GBSA utilizes a continuum solvent approach to calculate the BFEs of a system. The BFEs determined for the p53–MDM2 complex using MM/GBSA and MM/PBSA methods, along with the energy terms, are given in Tables 2 and 3 respectively.
Table 2. Various Components of the BFE (kcal mol–1) Evaluated by the MM/GBSA Method between the p53–MDM2 Complexa.
| p53–MDM2 |
MDM2 |
p53 |
Δ |
|||||
|---|---|---|---|---|---|---|---|---|
| average | std. dev. (±) | average | std. dev. (±) | average | std. dev. (±) | average | std. dev. (±) | |
| VDW | –776.69 | 12.17 | –638.49 | 11.02 | –65.47 | 3.10 | –72.72 | 5.38 |
| ELE | –7415.31 | 32.88 | –5970.25 | 31.26 | –1015.38 | 16.09 | –429.68 | 16.07 |
| GB | –1177.75 | 24.57 | –1244.09 | 23.12 | –390.48 | 12.80 | 456.82 | 16.43 |
| GBSUR | 40.87 | 0.84 | 40.68 | 0.82 | 10.96 | 0.19 | –10.76 | 0.38 |
| GAS | –8192.00 | 34.49 | –6608.75 | 31.12 | –1080.85 | 16.19 | –502.41 | 18.49 |
| GBSOL | –1136.88 | 24.19 | –1203.41 | 22.76 | –379.52 | 12.82 | 446.06 | 16.19 |
| GBTOT | –9328.88 | 26.38 | –7812.16 | 23.31 | –1460.37 | 7.37 | –56.35 | 4.64 |
| TSTRA | 16.06 | 0.00 | 15.93 | 0.00 | 14.29 | 0.00 | –14.16 | 0.00 |
| TSTRO | 15.93 | 0.00 | 15.76 | 0.00 | 13.17 | 0.01 | –13.01 | 0.01 |
| TSVIB | 1138.95 | 2.35 | 973.43 | 2.87 | 141.41 | 1.16 | 24.11 | 3.65 |
| TSTOT | 1170.94 | 2.36 | 1005.12 | 2.87 | 168.87 | 1.16 | –3.06 | 3.66 |
| ΔGbind | –53.29 | |||||||
Electrostatic energy (ELE); van der Waals contribution (VDW); total gas phase energy (GAS); nonpolar contribution to the solvation free energy (GBSUR); the electrostatic contribution to the solvation free energy (GB); sum of nonpolar and polar contributions to solvation (GBSOL); final estimated BFE (GBTOT); translational energy (TSTRA); rotational energy (TSROT); vibrational energy (TSVIB), total entropic contribution (TSTOT); and BFE (ΔGbind).
Table 3. Various Components of the BFE (kcal mol–1) Evaluated by the MM/PBSA Method between the p53–MDM2 Complexa.
| p53–MDM2 |
MDM2 |
p53 |
Δ |
|||||
|---|---|---|---|---|---|---|---|---|
| average | std. dev. (±) | average | std. dev. (±) | average | std. dev. (±) | average | std. dev. (±) | |
| VDW | –776.69 | 12.17 | –638.49 | 11.02 | –65.47 | 3.10 | –72.72 | 5.38 |
| ELE | –7415.31 | 32.88 | –5970.25 | 31.26 | –1015.38 | 16.09 | –429.68 | 16.07 |
| PB | –1153.54 | 21.57 | –1191.66 | 20.58 | –410.03 | 12.71 | 448.15 | 16.30 |
| NPOLAR | 849.68 | 3.88 | 761.05 | 3.86 | 146.79 | 1.26 | –58.16 | 1.99 |
| DISPER | –520.70 | 3.46 | –496.58 | 3.93 | –126.18 | 0.98 | 102.06 | 2.38 |
| GAS | –8192.00 | 34.49 | –6608.75 | 31.12 | –1080.85 | 16.19 | –502.41 | 18.49 |
| PBSOL | –824.56 | 19.95 | –927.20 | 19.43 | –389.42 | 12.80 | 492.06 | 16.79 |
| PBTOT | –9016.56 | 27.48 | –7535.94 | 24.79 | –1470.27 | 7.71 | –10.35 | 4.91 |
| TSTRA | 16.06 | 0.00 | 15.93 | 0.00 | 14.29 | 0.00 | –14.16 | 0.00 |
| TSTRO | 15.93 | 0.00 | 15.76 | 0.00 | 13.17 | 0.01 | –13.01 | 0.01 |
| TSVIB | 1138.95 | 2.35 | 973.43 | 2.87 | 141.41 | 1.16 | 24.11 | 3.65 |
| TSTOT | 1170.94 | 2.36 | 1005.12 | 2.87 | 168.87 | 1.16 | –3.06 | 3.66 |
| ΔGbind | –7.29 | |||||||
Electrostatic energy (ELE); van der Waals contribution (VDW); total gas phase energy (GAS); nonpolar contribution to the solvation free energy (NPOLAR + DISPER); the electrostatic contribution to the solvation free energy (PB); sum of nonpolar and polar contributions to solvation (PBSOL); final estimated BFE (PBTOT); translational energy (TSTRA); rotational energy (TSROT); vibrational energy (TSVIB), total entropic contribution (TSTOT); and BFE (ΔGbind).
From Tables 2 and 3, we observed that all the derived components for the BFE analysis contributed to the binding of p53 and MDM2 to form the p53–MDM2 complex. The ΔGbind for the p53–MDM2 complex was calculated to be −53.29 and −7.29 kcal mol–1 using MM/GBSA and MM/PBSA methods, respectively. We found the calculated BFE value for the p53–MDM2 complex using MM/PBSA to be more closer to the experimental values (−6.4 to −9.0 kcal mol–1). To ensure the BFE findings, we have carried out the duplicate simulation run and also another simulation using different force field (ff99SB-ILDN) for the p53–MDM2 complex. The BFE results obtained for the duplicate simulation run and for the simulation with ff99SB-ILDN force field have been summarized in the Tables S2–S5. From these tables, we observe the BFE values calculated using the MM/PBSA method to be closer to the experimental values.
To know the contribution of the interacting amino acid residues at the interface to the overall PPI of the p53–MDM2 complex, PRED values were calculated using the MM/PBSA module of the AMBER 14 software package.82−84 The PRED results for the entire interface residues present in our complex have been given in Figure 10. The highest energy contributions for MDM2 come from the residues LYS51, LEU54, TYR100, and TYR104. On the other hand, the highest energy contributions for p53 come from the residues PHE19, TRP23, and LEU26.
Figure 10.

PRED plots for the interface residues of (a) MDM2 and (b) p53.
3. Conclusions
In this work, we have demonstrated the binding and unbinding mechanisms of the p53–MDM2 complex by calculating PMF using US simulations. The p53–MDM2 complex structure with a minimum PMF value was obtained at a CoM distance of separation of 12 Å, with a dissociation energy of 30 kcal mol–1. The distance of separation of p53 from MDM2 was found to affect the secondary structure content (helical and turns) and the stability of the p53 molecule. We have also monitored the different folding patterns of p53 during the course of its separation from MDM2. These folding pattern inferences are very much important to design the methods of inhibition for the p53–MDM2 complex. We also found hydrogen bonds and salt bridge between Lys94 of MDM2 and Glu17 of p53 to be critical factors for the stability of the p53–MDM2 complex. The binding affinity between MDM2 and p53 was observed to be indeed high (ΔGbind = −7.29 kcal mol–1 from MM/PBSA and ΔGbind = −53.29 kcal mol–1 from MM/GBSA). The binding energy calculated for the p53–MDM2 complex using the MM/PBSA method was found to be near to the experimental binding values. The binding energy values for the complex estimated using MM/PBSA and MM/GBSA methods were ensured by performing the duplicate simulation run and also simulation with another force field. From the PRED analysis, the residues Lys51, Leu54, Tyr100, and Tyr104 from MDM2 and the residues Phe19, Trp23, and Leu26 from p53 were found to provide the highest energy contributions for the p53–MDM2 interaction. Our findings in this study provide insights into the binding pathway and the degree of association of p53 and MDM2 in forming the complex. These findings may be useful for designing potential inhibitors that disrupt the p53–MDM2 interactions.
4. Materials and Methodology
4.1. Preparation of the p53–MDM2 System
The initial 3-D structure of the MDM2 bound to the TAD of the p53 complex was obtained from RCSB Protein Data Bank, bearing the PDB ID: 1YCR. The p53 and MDM2 structures were separated from the p53–MDM2 complex, using UCSF Chimera v.1.13.1. Using the AMBER ff99SB force field, the initial coordinate and the topology file for the separated p53 and MDM2 structures were generated using the Leap module of the AMBER 14 software package. Then, p53 and MDM2 were loaded together, followed by the preparation of the coordinate and topology files of the loaded p53–MDM2 complex in both implicit and explicit environments using the Leap module. The loaded system was solvated with TIP3P85 water model with a solvent buffer of 10 Å in all directions. The charge of the complex was then neutralized by adding appropriate numbers of counter ions.
Then, the p53–MDM2 complex was minimized using AMBER 14 software package in two stages, wherein, it was first subjected to 500 steps of steepest descent minimization (by keeping restraints over the solute) followed by 500 steps of conjugate gradient minimization (devoid of restraints on the solute).
4.2. MD Simulation of the p53–MDM2 Complex
The MD study was carried out using a standard procedure, which consisted of heating dynamics followed by density, equilibration, and production dynamics. We used a minimized system as our starting structure for subsequent MD steps. The p53–MDM2 system was gradually heated from 0 to 300 K in constant volume (NVT) conditions, after which the density procedure was carried out. The equilibration of our system was carried out in NPT conditions (300 K and 1 atm pressure) for 1 ns. To ensure successful equilibration of the system, the density, temperature, pressure, and energy graphs were plotted and analyzed. Next, we performed 5 ns MD production run for the equilibrated structure of the p53–MDM2 system using the particle mesh Ewald (PME) algorithm86,87 with a time step of 2 fs. A cut-off of 8 Å was set to treat the nonbonding interactions (short-range electrostatic as well as van der Waals interactions) during the simulation, while the long-range electrostatic interactions were treated with the PME method. All the bonds present in the system were constrained using the SHAKE algorithm.88 The pressure and temperature (0.5 ps of heat bath and 0.2 ps of pressure relaxation) were kept constant by the Berendsen weak coupling algorithm89 throughout the simulation process.
After completion of the 5 ns of production dynamics of the p53–MDM2 complex, the lowest energy conformer of the complex was extracted out using the rmsd clustering algorithm from the highly populated clusters, followed by the measurement of the CoM distance between p53 and MDM2 in the complex structure. The extracted structure was then used as the initial structure for PMF90 analysis.
4.3. PMF Calculation
The PMF of the p53–MDM2 complex was calculated using the equilibrium US simulations combined with the weighted histogram analysis method (WHAM).91,92 The free energy profile for the p53–MDM2 complex was traced out conducting US simulations. The analysis of phase space in US relies on MD simulations over a set of regions (windows) that are spread along a predefined direction of reaction. Biasing potentials are generally added to the Hamiltonian to limit the molecular system around the selected regions of phase space. This is carried out in a number of windows along the path of the reaction. In each window, simulations of fixed time interval are carried out and the biased probability distribution (histogram) is obtained.
The WHAM is therefore used to determine the optimal free energy constants for the combined simulations. To study the extent of association of p53 and MDM2 in the p53–MDM2 complex, we calculated the PMF by changing the CoM distance between p53 and MDM2 in the complex. Initial configurations for the different windows of US MD simulation for the p53–MDM2 complex were generated by performing CoM distance constrained MD simulations. The distance between CoMs of the p53 and MDM2 was changed with time from 7 to 26 Å spanning different configurations. At each window of US, the system was carried out for a 10 ns time period of MD simulation with harmonic potentials to maintain the CoM distance between the two molecules near the desired values.
After every MD run, the trajectories generated were visualized by the means of VMD package.93 At large separation of p53 and MDM2 in the complex, the PMF data was normalized by means of centering and standard deviation method. rmsd, DSSP, probability score of secondary structure, and intramolecular hydrogen bond analyses were performed for p53 only for all the increasing and decreasing coordinates.
4.4. MD Simulation of the Lowest Energy Structure of the p53–MDM2 Complex
From the ensemble of the p53–MDM2 complex structures at the reaction coordinate corresponding to the minimum PMF value, a structure of lowest potential energy was selected and then subjected to MD simulation in order to study its salient structural features. Minimization, heating, density, equilibration, and production dynamics were carried out using the same standard procedure used above but with a change in the duration of the production run. The production dynamics were run for 100 ns. The MD trajectories for the complex were analyzed using the PTRAJ (short for Process TRAJectory) and CPPTRAJ (a rewrite of PTRAJ in C++) modules94 of AMBER 14 Tools. To evaluate the convergence of our system, we studied the rmsds for p53, MDM2, and p53–MDM2 complex, wherein the starting structure of MD was used as the reference. We also calculated the RMSFs to analyze the flexibility of both protein complexes. In addition, Rg, SASA, and intra/inter-molecular hydrogen bond analyses were also performed for p53, MDM2, and p53–MDM2 complex in order to understand how the stability of the p53–MDM2 complex is affected during the course of MD simulation.
4.5. Determination of the Interface Residues
For the determination of the PPI of p53–MDM2, we have pulled out the lowest potential energy structure of the p53–MDM2 complex from ensemble of the p53–MDM2 complex structures at the reaction coordinate corresponding to the minimum PMF value. The resultant lowest energy structure was then uploaded in the PDBsum server to visualize the intermolecular interface residues of p53–MDM2. The residues of a protein whose contact CoM distances from its interacting protein partner are less than 6 Å are called the interface residues.95
4.6. BFE Analyses for the p53–MDM2 System
The relative BFE and the PRED of the interface residues of the p53–MDM2 complex in this present study were acquired using MMPBSA.py script of the AMBER 14 suite. This script is based on the MM/PBSA and molecular mechanics/generalized Borne surface area (MM/GBSA) algorithms. The MM–PBSA/GBSA methods were utilized to determine the BFE (ΔGbind) and to understand the contributions from electrostatic and van der Waals terms in the formation of complexes. The PRED analysis provides the energy contribution from each residue of a protein by studying its molecular interactions over all residues in the system/complex. All the trajectories were taken into consideration for the MM–PBSA/GBSA calculations. The free energy analyses are considered important in establishing the binding affinity in the protein–protein, ligand–protein, DNA–protein, and DNA–ligand interaction studies. Hence, to gather the differences in the binding affinities of our system (p53–MDM2 complex), the MM–PBSA/GBSA analysis was done for our system by considering the following components (i) p53 (ligand), (ii) MDM2 (receptor), and (iii) p53–MDM2 (complex).
The BFE of p53ligand–MDM2receptor = p53–MDM2complex was calculated using eq 1, derived from the second law of thermodynamics, where studies were conducted in both gas (vacuum) and aqueous environments.
| 1 |
where ΔGbind is the final estimated BFE. It can be calculated by two methods. If it is calculated using the PB method, it is depicted with ΔGPB_TOT, and when it is calculated using the GB method, it is depicted as ΔGGB_TOT.68,96 We have also calculated the Nmodes for the complex, receptor, and ligand and average the results to estimate the binding entropy using Nmode analysis.
Acknowledgments
The authors extend their deepest gratitude to Tezpur University and University Grants Commission, India, for the start-up grant. They also thank Navamallika Dutta for doing the necessary English corrections. P.D. thanks Department of Science & Technology (DST), India for the INSPIRE Fellowship (IF180422).
Glossary
Abbreviations
- AMBER
Assisted Model Building with Energy Refinement
- BFE
binding free energy
- CoM
centre of mass
- CPPTRAJ
a rewrite of PTRAJ in C++
- DSSP
dictionary of secondary structure of proteins
- LCPO
linear combinations of pairwise overlaps
- MD
molecular dynamics
- MDM2
murine double minute 2
- MM/GBSA
molecular mechanics/generalized Borne surface area
- MM/PBSA
molecular mechanics/Poisson–Boltzmann surface area
- PME
particle mesh Ewald
- PMF
potential of mean force
- PRED
per residue energy decomposition
- PTRAJ
process trajectory
- RCSB
research collaboratory for structural bioinformatics
- Rg
radius of gyration
- RMSF
root mean square fluctuation
- rmsd
root mean square deviation
- SASA
solvent accessible surface area
- TAD1
transactivation domain 1
- TIP3P
transferable intermolecular potential with 3 points
- UCSF
University of California, San Francisco
- US
umbrella sampling
- VMD
visual molecular dynamics
- WHAM
weighted histogram analysis method
Supporting Information Available
The Supporting Information is available free of charge at https://pubs.acs.org/doi/10.1021/acsomega.9b03372.
Figure S1. PMF as a function of the reaction coordinate for the association and dissociation of the p53-MDM2 complex using force field: ff99SB-ILDN. Figure S2. Assessment of stability of MD parameters: (a) density, (b) temperature, (c) pressure, and (d) energy of p53–MDM2 complex during the equilibration phases of MD simulation. Table S1. List of atom–atom interactions across p53–MDM2 interface. Table S2. The various components of the BFE (kcal mol–1) evaluated by MM/GBSA method between p53–MDM2 complex for duplicate simulation run. Table S3. The various components of the BFE (kcal mol–1) evaluated by MM/PBSA method between p53–MDM2 complex for duplicate simulation run. Table S4. The various components of the BFE (kcal mol–1) evaluated by MM/GBSA method between p53–MDM2 complex using force field ff99SB-ILDN. Table S5. The various components of the BFE (kcal mol–1) evaluated by MM/PBSA method between p53–MDM2 complex using force field ff99SB-ILDN (PDF)
Author Contributions
The manuscript was written through the contributions of all authors. All authors have given approval to the final version of the manuscript.
The authors declare no competing financial interest.
Supplementary Material
References
- Pawson T.; Nash P. Protein–protein interactions define specificity in signal transduction. Genes Dev. 2000, 14, 1027–1047. [PubMed] [Google Scholar]
- Jones S.; Thornton J. M. Principles of protein-protein interactions. Proc. Natl. Acad. Sci. U.S.A. 1996, 93, 13–20. 10.1073/pnas.93.1.13. [DOI] [PMC free article] [PubMed] [Google Scholar]
- Keskin O.; Gursoy A.; Ma B.; Nussinov R. Principles of Protein–Protein Interactions: What are the Preferred Ways For Proteins To Interact?. Chem. Rev. 2008, 108, 1225–1244. 10.1021/cr040409x. [DOI] [PubMed] [Google Scholar]
- Schreiber G.; Fersht A. R. Energetics of protein-protein interactions: Analysis of the Barnase-Barstar interface by single mutations and double mutant cycles. J. Mol. Biol. 1995, 248, 478–486. 10.1006/jmbi.1995.0235. [DOI] [PubMed] [Google Scholar]
- Pazos F.; Helmer-Citterich M.; Ausiello G.; Valencia A. Correlated mutations contain information about protein-protein interaction. J. Mol. Biol. 1997, 271, 511–523. 10.1006/jmbi.1997.1198. [DOI] [PubMed] [Google Scholar]
- Schreiber G.; Haran G.; Zhou H.-X. Fundamental Aspects of Protein–Protein Association Kinetics. Chem. Rev. 2009, 109, 839–860. 10.1021/cr800373w. [DOI] [PMC free article] [PubMed] [Google Scholar]
- Fridman J. S.; Lowe S. W. Control of apoptosis by p53. Oncogene 2003, 22, 9030. 10.1038/sj.onc.1207116. [DOI] [PubMed] [Google Scholar]
- Hainaut P.; Hollstein M. p53 and human cancer: the first ten thousand mutations. Adv. Cancer Res. 1999, 77, 81–137. 10.1016/s0065-230x(08)60785-x. [DOI] [PubMed] [Google Scholar]
- Vogelstein B.; Lane D.; Levine A. J. Surfing the p53 network. Nature 2000, 408, 307. 10.1038/35042675. [DOI] [PubMed] [Google Scholar]
- Vousden K. H.; Lu X. Live or let die: the cell’s response to p53. Nat. Rev. Cancer 2002, 2, 594. 10.1038/nrc864. [DOI] [PubMed] [Google Scholar]
- Shangary S.; Wang S. Small-molecule inhibitors of the MDM2-p53 protein-protein interaction to reactivate p53 function: a novel approach for cancer therapy. Annu. Rev. Pharmacol. Toxicol. 2009, 49, 223–241. 10.1146/annurev.pharmtox.48.113006.094723. [DOI] [PMC free article] [PubMed] [Google Scholar]
- Feki A.; Irminger-Finger I. Mutational spectrum of p53 mutations in primary breast and ovarian tumors. Crit. Rev. Oncol. Hematol. 2004, 52, 103–116. 10.1016/j.critrevonc.2004.07.002. [DOI] [PubMed] [Google Scholar]
- Momand J.; Zambetti G. P.; Olson D. C.; George D.; Levine A. J. The mdm-2 oncogene product forms a complex with the p53 protein and inhibits p53-mediated transactivation. Cell 1992, 69, 1237–1245. 10.1016/0092-8674(92)90644-r. [DOI] [PubMed] [Google Scholar]
- Fakharzadeh S. S.; Trusko S. P.; George D. L. Tumorigenic potential associated with enhanced expression of a gene that is amplified in a mouse tumor cell line. EMBO J. 1991, 10, 1565–1569. 10.1002/j.1460-2075.1991.tb07676.x. [DOI] [PMC free article] [PubMed] [Google Scholar]
- Fakharzadeh S. S.; Rosenblum-Vos L.; Murphy M.; Hoffman E. K.; George D. L. Structure and organization of amplified DNA on double minutes containing the mdm2 oncogene. Genomics 1993, 15, 283–290. 10.1006/geno.1993.1058. [DOI] [PubMed] [Google Scholar]
- Yu G. W.; Rudiger S.; Veprintsev D.; Freund S.; Fernandez-Fernandez M. R.; Fersht A. R. The central region of HDM2 provides a second binding site for p53. Proc. Natl. Acad. Sci. U.S.A. 2006, 103, 1227–1232. 10.1073/pnas.0510343103. [DOI] [PMC free article] [PubMed] [Google Scholar]
- Ma J.; Martin J. D.; Zhang H.; Auger K. R.; Ho T. F.; Kirkpatrick R. B.; Grooms M. H.; Johanson K. O.; Tummino P. J.; Lai Z.; Lai Z. A second p53 binding site in the central domain of Mdm2 is essential for p53 ubiquitination. Biochemistry 2006, 45, 9238–9245. 10.1021/bi060661u. [DOI] [PubMed] [Google Scholar]
- Kulikov R.; Winter M.; Blattner C. Binding of p53 to the central domain of Mdm2 is regulated by phosphorylation. J. Biol. Chem. 2006, 281, 28575–28583. 10.1074/jbc.m513311200. [DOI] [PubMed] [Google Scholar]
- Poyurovsky M. V.; Katz C.; Laptenko O.; Beckerman R.; Lokshin M.; Ahn J.; Byeon I.-J. L.; Gabizon R.; Mattia M.; Zupnick A.; Brown L. M.; Friedler A.; Prives C. The C terminus of p53 binds the N-terminal domain of MDM2. Nat. Struct. Mol. Biol. 2010, 17, 982. 10.1038/nsmb.1872. [DOI] [PMC free article] [PubMed] [Google Scholar]
- Wang S.; Zhao Y.; Aguilar A.; Bernard D.; Yang C.-Y. Targeting the MDM2-p53 Protein-Protein Interaction for New Cancer Therapy: Progress and Challenges. Cold Spring Harbor Perspect. Med. 2017, 7, a026245. 10.1101/cshperspect.a026245. [DOI] [PMC free article] [PubMed] [Google Scholar]
- Bond G. L.; Hu W.; Bond E. E.; Robins H.; Lutzker S. G.; Arva N. C.; Bargonetti J.; Bartel F.; Taubert H.; Wuerl P.; Onel K.; Yip L.; Hwang S.-J.; Strong L. C.; Lozano G.; Levine A. J. A single nucleotide polymorphism in the MDM2 promoter attenuates the p53 tumor suppressor pathway and accelerates tumor formation in humans. Cell 2004, 119, 591–602. 10.1016/j.cell.2004.11.022. [DOI] [PubMed] [Google Scholar]
- Oliner J. D.; Kinzler K. W.; Meltzer P. S.; George D. L.; Vogelstein B. Amplification of a gene encoding a p53-associated protein in human sarcomas. Nature 1992, 358, 80. 10.1038/358080a0. [DOI] [PubMed] [Google Scholar]
- Zhou M.; Gu L.; Abshire T.; Homans A.; Billett A.; Yeager A.; Findley H. Incidence and prognostic significance of MDM2 oncoprotein overexpression in relapsed childhood acute lymphoblastic leukemia. Leukemia 2000, 14, 61. 10.1038/sj.leu.2401619. [DOI] [PubMed] [Google Scholar]
- Rayburn E.; Zhang R.; He J.; Wang H. MDM2 and human malignancies: expression, clinical pathology, prognostic markers, and implications for chemotherapy. Curr. Cancer Drug Targets 2005, 5, 27–41. 10.2174/1568009053332636. [DOI] [PubMed] [Google Scholar]
- Momand J.; Jung D.; Wilczynski S.; Niland J. The MDM2 gene amplification database. Nucleic Acids Res. 1998, 26, 3453–3459. 10.1093/nar/26.15.3453. [DOI] [PMC free article] [PubMed] [Google Scholar]
- Günther T.; Schneider-Stock R.; Häckel C.; Kasper H.-U.; Pross M.; Hackelsberger A.; Lippert H.; Roessner A. Mdm2 gene amplification in gastric cancer correlation with expression of Mdm2 protein and p53 alterations. Mod. Pathol. 2000, 13, 621. 10.1038/modpathol.3880107. [DOI] [PubMed] [Google Scholar]
- Bond G.; Hu W.; Levine A. MDM2 is a central node in the p53 pathway: 12 years and counting. Curr. Cancer Drug Targets 2005, 5, 3–8. 10.2174/1568009053332627. [DOI] [PubMed] [Google Scholar]
- McCammon J. A.; Gelin B. R.; Karplus M. Dynamics of folded proteins. Nature 1977, 267, 585–590. 10.1038/267585a0. [DOI] [PubMed] [Google Scholar]
- Hornak V.; Abel R.; Okur A.; Strockbine B.; Roitberg A.; Simmerling C. Comparison of multiple Amber force fields and development of improved protein backbone parameters. Proteins: Struct., Funct., Bioinf. 2006, 65, 712–725. 10.1002/prot.21123. [DOI] [PMC free article] [PubMed] [Google Scholar]
- Woo H.-J.; Roux B. Calculation of absolute protein-ligand binding free energy from computer simulations. Proc. Natl. Acad. Sci. U.S.A. 2005, 102, 6825–6830. 10.1073/pnas.0409005102. [DOI] [PMC free article] [PubMed] [Google Scholar]
- Burgoyne N. J.; Jackson R. M. Predicting protein interaction sites: binding hot-spots in protein-protein and protein-ligand interfaces. Bioinf 2006, 22, 1335–1342. 10.1093/bioinformatics/btl079. [DOI] [PubMed] [Google Scholar]
- Cheung L. S.-L.; Kanwar M.; Ostermeier M.; Konstantopoulos K. A hot-spot motif characterizes the interface between a designed ankyrin-repeat protein and its target ligand. Biophys. J. 2012, 102, 407–416. 10.1016/j.bpj.2012.01.004. [DOI] [PMC free article] [PubMed] [Google Scholar]
- Srinivasan J.; Cheatham T. E.; Cieplak P.; Kollman P. A.; Case D. A. Continuum Solvent Studies of the Stability of DNA, RNA, and Phosphoramidate–DNA Helices. J. Am. Chem. Soc. 1998, 120, 9401–9409. 10.1021/ja981844+. [DOI] [Google Scholar]
- Wang W.; Kollman P. A. Free energy calculations on dimer stability of the HIV protease using molecular dynamics and a continuum solvent model 1 1Edited by B. Honig. J. Mol. Biol. 2000, 303, 567–582. 10.1006/jmbi.2000.4057. [DOI] [PubMed] [Google Scholar]
- Wang J.; Morin P.; Wang W.; Kollman P. A. Use of MM-PBSA in reproducing the binding free energies to HIV-1 RT of TIBO derivatives and predicting the binding mode to HIV-1 RT of efavirenz by docking and MM-PBSA. J. Am. Chem. Soc. 2001, 123, 5221–5230. 10.1021/ja003834q. [DOI] [PubMed] [Google Scholar]
- Sun H.; Li Y.; Tian S.; Xu L.; Hou T. Assessing the performance of MM/PBSA and MM/GBSA methods. 4. Accuracies of MM/PBSA and MM/GBSA methodologies evaluated by various simulation protocols using PDBbind data set. Phys. Chem. Chem. Phys. 2014, 16, 16719–16729. 10.1039/c4cp01388c. [DOI] [PubMed] [Google Scholar]
- Genheden S.; Ryde U. The MM/PBSA and MM/GBSA methods to estimate ligand-binding affinities. Expert Opin. Drug Discovery 2015, 10, 449–461. 10.1517/17460441.2015.1032936. [DOI] [PMC free article] [PubMed] [Google Scholar]
- Chen F.; Liu H.; Sun H.; Pan P.; Li Y.; Li D.; Hou T. Assessing the performance of the MM/PBSA and MM/GBSA methods. 6. Capability to predict protein-protein binding free energies and re-rank binding poses generated by protein-protein docking. Phys. Chem. Chem. Phys. 2016, 18, 22129–22139. 10.1039/c6cp03670h. [DOI] [PubMed] [Google Scholar]
- Martins S. A.; Perez M. A. S.; Moreira I. S.; Sousa S. F.; Ramos M. J.; Fernandes P. A. Computational alanine scanning mutagenesis: MM-PBSA vs TI. J. Chem. Theory Comput. 2013, 9, 1311–1319. 10.1021/ct4000372. [DOI] [PubMed] [Google Scholar]
- Li M.; Cong Y.; Li Y.; Zhong S.; Wan R.; Li H.; Duan L. Insight into the binding mechanism of p53/pDIQ-MDMX/MDM2 with the interaction entropy method. Front. Chem. 2019, 7, 33. 10.3389/fchem.2019.00033. [DOI] [PMC free article] [PubMed] [Google Scholar]
- Simões I. C. M.; Costa I. P. D.; Coimbra J. T. S.; Ramos M. J.; Fernandes P. A. New parameters for higher accuracy in the computation of binding free energy differences upon Alanine Scanning Mutagenesis on protein–protein interfaces. J. Chem. Inf. Model. 2016, 57, 60–72. 10.1021/acs.jcim.6b00378. [DOI] [PubMed] [Google Scholar]
- Chen H.-F.; Luo R. Binding Induced Folding in p53–MDM2 Complex. J. Am. Chem. Soc. 2007, 129, 2930–2937. 10.1021/ja0678774. [DOI] [PMC free article] [PubMed] [Google Scholar]
- Dastidar S. G.; Lane D. P.; Verma C. S. Why is F19Ap53 unable to bind MDM2? Simulations suggest crack propagation modulates binding. Cell Cycle 2012, 11, 2239–2247. 10.4161/cc.20333. [DOI] [PubMed] [Google Scholar]
- Böttger A.; Böttger V.; Sparks A.; Liu W.-L.; Howard S. F.; Lane D. P. Design of a synthetic Mdm2-binding mini protein that activates the p53 response in vivo. Curr. Biol. 1997, 7, 860–869. 10.1016/s0960-9822(06)00374-5. [DOI] [PubMed] [Google Scholar]
- Lee H. J.; Srinivasan D.; Coomber D.; Lane D. P.; Verma C. S. Modulation of the p53-MDM2 interaction by phosphorylation of Thr18: a computational study. Cell Cycle 2007, 6, 2604–2611. 10.4161/cc.6.21.4923. [DOI] [PubMed] [Google Scholar]
- ElSawy K. M.; Sim A.; Lane D. P.; Verma C. S.; Caves L. S. A spatiotemporal characterization of the effect of p53 phosphorylation on its interaction with MDM2. Cell Cycle 2015, 14, 179–188. 10.4161/15384101.2014.989043. [DOI] [PMC free article] [PubMed] [Google Scholar]
- Dastidar S. G.; Raghunathan D.; Nicholson J.; Hupp T. R.; Lane D. P.; Verma C. S. Chemical states of the N-terminal “lid” of MDM2 regulate p53 binding: Simulations reveal complexities of modulation. Cell Cycle 2011, 10, 82–89. 10.4161/cc.10.1.14345. [DOI] [PubMed] [Google Scholar]
- Tan Y. S.; Mhoumadi Y.; Verma C. S. Roles of computational modelling in understanding p53 structure, biology, and its therapeutic targeting. J. Mol. Cell Biol. 2019, 11, 306–316. 10.1093/jmcb/mjz009. [DOI] [PMC free article] [PubMed] [Google Scholar]
- Kussie P. H.; Gorina S.; Marechal V.; Elenbaas B.; Moreau J.; Levine A. J.; Pavletich N. P. Structure of the MDM2 oncoprotein bound to the p53 tumor suppressor transactivation domain. Science 1996, 274, 948–953. 10.1126/science.274.5289.948. [DOI] [PubMed] [Google Scholar]
- Massova I.; Kollman P. A. Computational Alanine Scanning To Probe Protein–Protein Interactions: A Novel Approach To Evaluate Binding Free Energies. J. Am. Chem. Soc. 1999, 121, 8133–8143. 10.1021/ja990935j. [DOI] [Google Scholar]
- Zhong H.; Carlson H. A. Computational studies and peptidomimetic design for the human p53–MDM2 complex. Proteins: Struct., Funct., Bioinf. 2004, 58, 222–234. 10.1002/prot.20275. [DOI] [PubMed] [Google Scholar]
- Kollman P. A.; Massova I.; Reyes C.; Kuhn B.; Huo S.; Chong L.; Lee M.; Lee T.; Duan Y.; Wang W.; Donini O.; Cieplak P.; Srinivasan J.; Case D. A.; Cheatham T. E. Calculating structures and free energies of complex molecules: combining molecular mechanics and continuum models. Acc. Chem. Res. 2000, 33, 889–897. 10.1021/ar000033j. [DOI] [PubMed] [Google Scholar]
- Bueren-Calabuig J. A.; Michel J. Elucidation of ligand-dependent modulation of disorder-order transitions in the oncoprotein MDM2. PLoS Comput. Biol. 2015, 11, e1004282. 10.1371/journal.pcbi.1004282. [DOI] [PMC free article] [PubMed] [Google Scholar]
- Chang Y. S.; Graves B.; Guerlavais V.; Tovar C.; Packman K.; To K.-H.; Olson K. A.; Kesavan K.; Gangurde P.; Mukherjee A.; Baker T.; Darlak K.; Elkin C.; Filipovic Z.; Qureshi F. Z.; Cai H.; Berry P.; Feyfant E.; Shi X. E.; Horstick J.; Annis D. A.; Manning A. M.; Fotouhi N.; Nash H.; Vassilev L. T.; Sawyer T. K. Stapled α–helical peptide drug development: A potent dual inhibitor of MDM2 and MDMX for p53-dependent cancer therapy. Proc. Natl. Acad. Sci. U.S.A. 2013, 110, E3445–E3454. 10.1073/pnas.1303002110. [DOI] [PMC free article] [PubMed] [Google Scholar]
- Tan Y. S.; Lane D. P.; Verma C. S. Stapled peptide design: principles and roles of computation. Drug Discovery Today 2016, 21, 1642–1653. 10.1016/j.drudis.2016.06.012. [DOI] [PubMed] [Google Scholar]
- Mukherjee S.; Pantelopulos G. A.; Voelz V. A. Markov models of the apo-MDM2 lid region reveal diffuse yet two-state binding dynamics and receptor poses for computational docking. Sci. Rep. 2016, 6, 31631. 10.1038/srep31631. [DOI] [PMC free article] [PubMed] [Google Scholar]
- Zhao L.; Ouyang Y.; Li Q.; Zhang Z. Modulation of p53 N-terminal transactivation domain 2 conformation ensemble and kinetics by phosphorylation. J. Biomol. Struct. Dyn. 2019, 1–11. 10.1080/07391102.2019.1637784. [DOI] [PubMed] [Google Scholar]
- Zhou G.; Pantelopulos G. A.; Mukherjee S.; Voelz V. A. Bridging microscopic and macroscopic mechanisms of p53-MDM2 binding with kinetic network models. Biophys. J. 2017, 113, 785–793. 10.1016/j.bpj.2017.07.009. [DOI] [PMC free article] [PubMed] [Google Scholar]
- Tran D. P.; Kitao A. Dissociation Process of a MDM2/p53 Complex Investigated by Parallel Cascade Selection Molecular Dynamics and the Markov State Model. J. Phys. Chem. B 2019, 123, 2469–2478. 10.1021/acs.jpcb.8b10309. [DOI] [PubMed] [Google Scholar]
- Thayer K. M.; Beyer G. A. Energetic landscape of MDM2-p53 interactions by computational mutagenesis of the MDM2-p53 interaction. PLoS One 2016, 11, e0147806. 10.1371/journal.pone.0147806. [DOI] [PMC free article] [PubMed] [Google Scholar]
- Zwier M. C.; Pratt A. J.; Adelman J. L.; Kaus J. W.; Zuckerman D. M.; Chong L. T. Efficient Atomistic Simulation of Pathways and Calculation of Rate Constants for a Protein-Peptide Binding Process: Application to the MDM2 Protein and an Intrinsically Disordered p53 Peptide. J. Phys. Chem. Lett. 2016, 7, 3440–3445. 10.1021/acs.jpclett.6b01502. [DOI] [PMC free article] [PubMed] [Google Scholar]
- Bharatham N.; Chi S.-W.; Yoon H. S. Molecular basis of Bcl-XL-p53 interaction: insights from molecular dynamics simulations. PLoS One 2011, 6, e26014. 10.1371/journal.pone.0026014. [DOI] [PMC free article] [PubMed] [Google Scholar]
- Zhong H.; Carlson H. A. Computational studies and peptidomimetic design for the human p53–MDM2 complex. Proteins: Struct., Funct., Bioinf. 2004, 58, 222–234. 10.1002/prot.20275. [DOI] [PubMed] [Google Scholar]
- Schon O.; Friedler A.; Bycroft M.; Freund S. M. V.; Fersht A. R. Molecular mechanism of the interaction between MDM2 and p53. J. Mol. Biol. 2002, 323, 491–501. 10.1016/s0022-2836(02)00852-5. [DOI] [PubMed] [Google Scholar]
- Böttger A.; Böttger V.; Garcia-Echeverria C.; Chène P.; Hochkeppel H.-K.; Sampson W.; Ang K.; Howard S. F.; Picksley S. M.; Lane D. P. Molecular characterization of the hdm2-p53 interaction 1 1Edited by J. Karn. J. Mol. Biol. 1997, 269, 744–756. 10.1006/jmbi.1997.1078. [DOI] [PubMed] [Google Scholar]
- Ciemny M.; Badaczewska-Dawid A.; Pikuzinska M.; Kolinski A.; Kmiecik S. Modeling of disordered protein structures using monte carlo simulations and knowledge-based statistical force fields. Int. J. Mol. Sci. 2019, 20, 606. 10.3390/ijms20030606. [DOI] [PMC free article] [PubMed] [Google Scholar]
- Yadahalli S.; Li J.; Lane D. P.; Gosavi S.; Verma C. S. Characterizing the conformational landscape of MDM2-binding p53 peptides using Molecular Dynamics simulations. Sci. Rep. 2017, 7, 15600. 10.1038/s41598-017-15930-4. [DOI] [PMC free article] [PubMed] [Google Scholar]
- Miller B. R. III; McGee T. D. Jr.; Swails J. M.; Homeyer N.; Gohlke H.; Roitberg A. E. MMPBSA.py: An Efficient Program for End-State Free Energy Calculations. J. Chem. Theory Comput. 2012, 8, 3314–3321. 10.1021/ct300418h. [DOI] [PubMed] [Google Scholar]
- Wang C.; Nguyen P. H.; Pham K.; Huynh D.; Le T.-B. N.; Wang H.; Ren P.; Luo R. Calculating protein-ligand binding affinities with MMPBSA: Method and error analysis. J. Comput. Chem. 2016, 37, 2436–2446. 10.1002/jcc.24467. [DOI] [PMC free article] [PubMed] [Google Scholar]
- Foloppe N.; Hubbard R. Towards predictive ligand design with free-energy based computational methods?. Curr. Med. Chem. 2006, 13, 3583–3608. 10.2174/092986706779026165. [DOI] [PubMed] [Google Scholar]
- Wang J.; Hou T.; Xu X. Recent advances in free energy calculations with a combination of molecular mechanics and continuum models. Curr. Comput.-Aided Drug Des. 2006, 2, 287–306. 10.2174/157340906778226454. [DOI] [Google Scholar]
- Homeyer N.; Gohlke H. Free Energy Calculations by the Molecular Mechanics Poisson–Boltzmann Surface Area Method. Mol. Inf. 2012, 31, 114–122. 10.1002/minf.201100135. [DOI] [PubMed] [Google Scholar]
- Homeyer N.; Gohlke H. FEW: A workflow tool for free energy calculations of ligand binding. J. Comput. Chem. 2013, 34, 965–973. 10.1002/jcc.23218. [DOI] [PubMed] [Google Scholar]
- Tan C.; Tan Y.-H.; Luo R. Implicit nonpolar solvent models. J. Phys. Chem. B 2007, 111, 12263–12274. 10.1021/jp073399n. [DOI] [PubMed] [Google Scholar]
- Torrie G. M.; Valleau J. P. Nonphysical sampling distributions in Monte Carlo free-energy estimation: Umbrella sampling. J. Comput. Phys. 1977, 23, 187–199. 10.1016/0021-9991(77)90121-8. [DOI] [Google Scholar]
- Pettersen E. F.; Goddard T. D.; Huang C. C.; Couch G. S.; Greenblatt D. M.; Meng E. C.; Ferrin T. E. UCSF Chimera?A visualization system for exploratory research and analysis. J. Comput. Chem. 2004, 25, 1605–1612. 10.1002/jcc.20084. [DOI] [PubMed] [Google Scholar]
- Kabsch W.; Sander C. Dictionary of protein secondary structure: Pattern recognition of hydrogen-bonded and geometrical features. Biopolymers 1983, 22, 2577–2637. 10.1002/bip.360221211. [DOI] [PubMed] [Google Scholar]
- Kabsch W.; Sander C. On the use of sequence homologies to predict protein structure: identical pentapeptides can have completely different conformations. Proc. Natl. Acad. Sci. U.S.A. 1984, 81, 1075–1078. 10.1073/pnas.81.4.1075. [DOI] [PMC free article] [PubMed] [Google Scholar]
- Baker E. N.; Hubbard R. E. Hydrogen bonding in globular proteins. Prog. Biophys. Mol. Biol. 1984, 44, 97–179. 10.1016/0079-6107(84)90007-5. [DOI] [PubMed] [Google Scholar]
- Laskowski R. A. PDBsum: summaries and analyses of PDB structures. Nucleic Acids Res. 2001, 29, 221–222. 10.1093/nar/29.1.221. [DOI] [PMC free article] [PubMed] [Google Scholar]
- Berman H. M.; Westbrook J.; Feng Z.; Gilliland G.; Bhat T. N.; Weissig H.; Shindyalov I. N.; Bourne P. E. The protein data bank. Nucleic Acids Res. 2000, 28, 235–242. 10.1093/nar/28.1.235. [DOI] [PMC free article] [PubMed] [Google Scholar]
- Appiah-Kubi P.; Soliman M. Hybrid Receptor-Bound/MM-GBSA-Per-residue Energy-Based Pharmacophore Modelling: Enhanced Approach for Identification of Selective LTA4H Inhibitors as Potential Anti-inflammatory Drugs. Cell Biochem. Biophys. 2017, 75, 35–48. 10.1007/s12013-016-0772-3. [DOI] [PubMed] [Google Scholar]
- Chaudhary N.; Aparoy P. Deciphering the mechanism behind the varied binding activities of COXIBs through Molecular Dynamic Simulations, MM-PBSA binding energy calculations and per-residue energy decomposition studies. J. Biomol. Struct. Dyn. 2017, 35, 868–882. 10.1080/07391102.2016.1165736. [DOI] [PubMed] [Google Scholar]
- Case D. A.; Babin V.; Berryman J. T.; Betz R. M.; Cai Q.; Cerutti D. S.; Cheatham T. E.; Darden T. A.; Duke R. E.; Gohlke H.; Goetz A. W.; Gusarov S.; Homeyer N.; Janowski P.; Kaus J.; Kolossváry I.; Kovalenko A.; Lee T. S.; LeGrand S.; Luchko T.; Luo R.; Madej B.; Merz K. M.; Paesani F.; Roe D. R.; Roitberg A.; Sagui C.; Salomon-Ferrer R.; Seabra G.; Simmerling C. L.; Smith W.; Swails J.; Walker R. C.; Wang J.; Wolf R. M.; Wu X.; Kollman P. A.. AMBER 14; University of California: San Francisco, 2014.
- Jorgensen W. L.; Chandrasekhar J.; Madura J. D.; Impey R. W.; Klein M. L. Comparison of simple potential functions for simulating liquid water. J. Chem. Phys. 1983, 79, 926–935. 10.1063/1.445869. [DOI] [Google Scholar]
- Darden T.; York D.; Pedersen L. Particle mesh Ewald: AnN·log(N) method for Ewald sums in large systems. J. Chem. Phys. 1993, 98, 10089–10092. 10.1063/1.464397. [DOI] [Google Scholar]
- Salomon-Ferrer R.; Götz A. W.; Poole D.; Le Grand S.; Walker R. C. Routine microsecond molecular dynamics simulations with AMBER on GPUs. 2. Explicit solvent particle mesh Ewald. J. Chem. Theory Comput. 2013, 9, 3878–3888. 10.1021/ct400314y. [DOI] [PubMed] [Google Scholar]
- Ryckaert J.-P.; Ciccotti G.; Berendsen H. J. C. Numerical integration of the cartesian equations of motion of a system with constraints: molecular dynamics of n-alkanes. J. Comput. Phys. 1977, 23, 327–341. 10.1016/0021-9991(77)90098-5. [DOI] [Google Scholar]
- Berendsen H. J. C.; Postma J. P. M.; van Gunsteren W. F.; DiNola A.; Haak J. R. Molecular dynamics with coupling to an external bath. J. Chem. Phys. 1984, 81, 3684–3690. 10.1063/1.448118. [DOI] [Google Scholar]
- Roux B. The calculation of the potential of mean force using computer simulations. Comput. Phys. Commun. 1995, 91, 275–282. 10.1016/0010-4655(95)00053-i. [DOI] [Google Scholar]
- Kumar S.; Rosenberg J. M.; Bouzida D.; Swendsen R. H.; Kollman P. A. THE weighted histogram analysis method for free-energy calculations on biomolecules. I. The method. J. Comput. Chem. 1992, 13, 1011–1021. 10.1002/jcc.540130812. [DOI] [Google Scholar]
- Souaille M.; Roux B. Extension to the weighted histogram analysis method: combining umbrella sampling with free energy calculations. Comput. Phys. Commun. 2001, 135, 40–57. 10.1016/s0010-4655(00)00215-0. [DOI] [Google Scholar]
- Humphrey W.; Dalke A.; Schulten K. VMD: visual molecular dynamics. J. Mol. Graphics 1996, 14, 33–38. 10.1016/0263-7855(96)00018-5. [DOI] [PubMed] [Google Scholar]
- Roe D. R.; Cheatham T. E. III PTRAJ and CPPTRAJ: software for processing and analysis of molecular dynamics trajectory data. J. Chem. Theory Comput. 2013, 9, 3084–3095. 10.1021/ct400341p. [DOI] [PubMed] [Google Scholar]
- Kruger D. M.; Gohlke H. DrugScorePPI webserver: fast and accurate in silico alanine scanning for scoring protein–protein interactions. Nucleic Acids Res. 2010, 38, W480–W486. 10.1093/nar/gkq471. [DOI] [PMC free article] [PubMed] [Google Scholar]
- Wang C.; Greene D. A.; Xiao L.; Qi R.; Luo R. Recent developments and applications of the MMPBSA method. Front. Mol. Biosci. 2018, 4, 87. 10.3389/fmolb.2017.00087. [DOI] [PMC free article] [PubMed] [Google Scholar]
Associated Data
This section collects any data citations, data availability statements, or supplementary materials included in this article.