

Abstract

Hydrocarbon dew point (HCDP) is one of the most important quality specifications of natural gas. Measuring and predicting the HCDP accurately are essential for the natural gas industry. However, the comprehensive experimental HCDP curve data are still rare, and knowledge about adopting proper prediction models remains unclear. In view of this, HCDP determination work by use of an improved test system and model evaluation based on more than 1000 dew points data have been done to improve the aforementioned dilemma. HCDP curve data of three gravimetrically prepared synthetic natural gases (SNGs) and one real gas (RG) are determined first. Then, one set of data containing 712 dew points from 28 SNGs and 334 dew points from 14 RGs is used to evaluate the performance of eight different HCDP prediction models including Soave–Redlich–Kwong (SRK), SRK–Twu, Peng–Robinson (PR), Twu–Sim–Tassone (TST), predictive SRK (PSRK), GERG-2008, PSRK, and perturbed-chain statistical associating fluid theory (PC-SAFT) models. Considerable prediction deviation of these models in the high-pressure region (pressure above 6.0 MPa) is observed compared to that in the low-pressure region (under 6.0 MPa), and the reasons for that difference are discussed. Evaluation results reveal that among the eight prediction models, GERG-2008 has the best performance (overall average absolute deviation (AAD): 1.44 °C) for SNGs, and PSRK and SRK–Twu fits the experimental data best for RGs (overall AAD: 2.50 °C). Therefore, GERG-2008 is recommended for HCDP prediction of relatively lean gas, whereas PSRK and SRK–Twu are recommended for calculating the HCDP of relatively heavy natural gases in low-pressure and high-pressure regions, respectively.
Introduction
Hydrocarbon dew point (HCDP) is a key quality specification of natural gas. To obtain accurate HCDP value is of great importance for natural gas engineers to gauge whether the operational parameters are optimal and to further guarantee the efficiency and safety of processing and transportation system.
So far, using manual or automatic chilled mirror instrument is the most well-known method to directly determine the HCDP.1 The determination of HCDP at one or several specific pressures is common, whereas the systematical study of the dew point curve containing dozens of dew point data under pressures up to cricondenbar is relatively rare. To the best of our knowledge, there are only two institutions that have reported the comprehensive dew point curve data until now. The data published by Aliva2−8 were determined by an automatic chilled mirror instrument, the claimed uncertainty of which was better than ±0.1 °C, evoking the most attention. In Statoil R&D laboratories, a customized apparatus that adopts a chandler manual chilled mirror instrument was built to measure HCDP. Their published dew point curve data are listed in references (1, 9−11). With the optimized determination procedure, the reported uncertainty of HCDP was around 0.5 °C.
The accuracy of indirectly determined HCDP is related to natural gas composition analysis and HCDP prediction model selection. Both comprehensive analysis of natural gas composition and proper selection of the HCDP prediction model are facing challenges.
Regarding natural gas composition analysis, ISO 2387412 gives the requirements on gas chromatography (GC) for calculating HCDP of natural gas. Brown13,14 reported that the analyzed composition difference between Lab GC and Process GC can induce up to 2.5 °C deviation in the predicted value of HCDP when the same calculation model is employed.
A large number of models have been applied for HCDP prediction though all of them have their limitations. Nasrifar15 evaluated the performance of 15 equations of state in HCDP prediction and concluded that the RK family equation of state (EoS) was superior, but this conclusion was based on the dew point curve data of only five synthetic natural gases (SNGs). Similarly, based on two or three scattered experimental dew points of each of 20 natural gas samples in total, George16 also recommended using Soave–Redlich–Kwong (SRK) to calculate the HCDP through comparison of Peng–Robinson (PR), SRK, and GERG-2004. Yet, Martinez17 pointed out that the performance of SRK close to the cricondenbar was less accurate. Other RK family models, such as SRK–Twu18 and PSRK,19 also showed potential abilities to predict the HCDP precisely. The modified models of PR EoS exhibited good agreement with the experimental data too. The UMR-PR model,10,20 an attractive term of which is expressed by the combination of PR EoS and UNIFAC liquid activity, performs well in HCDP prediction when taking 23 SNGs and two real gases (RGs) as the evaluation samples.10 Valiollahi21 performed the PR model modification and comparison work using a data set covering 23 SNGs and 13 RGs (most of the adopted RGs merely provided several dew point data near the cricondentherm); the comparison results suggested that the modified PR model can predict HCDP accurately. The GERG-2008 model,22 which has been adopted to calculate thermodynamic properties of natural gas in ISO 20765, has aroused great interests lately. Extensive evaluation works23−25 revealed that the GERG has great performance in calculation of HCDP as well as other thermodynamic properties. Varzandeh25 compared the phase equilibrium and physical property calculation performance of GERG-2008 and some simpler EOSs and concluded that GERG-2008 can give satisfactory predictions of hydrocarbon dew point phase envelope after comparison with experimental data of 30 synthetic natural gases. The perturbed-chain statistical associating fluid theory (PC-SAFT)26 model is a noncubic model originating from SAFT,27 also showing great performance in hydrocarbon modeling according to recent research works.1,11,28 It was considered to have enormous potential in applications related to reservoir fluids.
Despite considerable works that had been carried out, finding a model that can be used in a specific HCDP prediction situation is still challenging due to the paucity of experimental data and complex composition of real natural gas. Devoting great effort to acquire more comprehensive and reliable experimental data becomes more and more important. According to the previously reported work, it has been observed that the deviation between prediction and measured HCDP values was notable in the high-pressure region (above the pressure corresponding to the maximum condensation temperature). However, there has been no detailed investigation into how “large” the deviation is. It is of great significance for model evaluation and modification to obtain in-depth understandings of this issue.
This work focuses on HCDP determination as well as calculation model evaluation. The first part of this paper presents the theoretical expressions of the eight evaluated models. Combining dew point data (three SNGs and one RG) obtained by this work and experimental data retrieved from some previous works, the following part gives a data set containing 28 SNGs and 14 RGs to evaluate the eight different models, and the comparison results are discussed in detail. After conclusions, the last part elaborates the experimental apparatus and materials of this work.
The research results can help natural gas engineers in selecting proper models for predicting the HCDP accurately, which will be beneficial for optimal operation of the natural gas industry infrastructure.
Theoretical Descriptions of the EoS Models
Four types of equations of state, including cubic EoS (such as SRK, PR, and their variations), predictive cubic EoS (PSRK), viral-type EoS (GERG-2008), and EoS based on statistical thermodynamics derivation (PC-SAFT), are evaluated in this work.
Cubic EoSs (CEoS)
The selected cubic equations of state are some of the most commonly used two-parameter models. PVT relations and α-functions of these cubic EoSs are listed in Table 1. The binary interaction parameters of these cubic EoSs are in accordance with Aspen HYSYS10.0, which has been listed in Tables S5–S7 of the Supporting Information.
Table 1. PVT Relations and α-Functions of Cubic EoSs Evaluated in this Study.
| CEOS | PVT relation | α-function | model features |
|---|---|---|---|
| SRK29 |  |
α(Tr) = [1 + (0.480 + 1.574 ω – 0.176 ω2)·(1 – Tr0.5)]2 | the accuracy of SRK EoS was significantly improved from RK in vapor pressure prediction. |
| SRK–Twu18 | α(Tr) = α(0)(Tr) + ω(α(1)(Tr) – α(0)(Tr)) | α of attractive term is a linear function of the acentric factor, which can be easily extrapolated to the high-pressure region. This model ensured more reliable and precise calculation results of the high-pressure region for heavy hydrocarbons. | |
| α(i)(Tr) = TrN(i)(M(i) – 1)eL(i)(1 – TrN(i)(M(i))a For | |||
| PR30 |  |
α(Tr) = [1 + (0.37464 + 1.54226 ω – 0.26992 ω2)·(1 – Tr0.5)]2 | the PR EoS had comparable accuracy of SRK EoS in vapor pressure prediction and performed much better in liquid density calculation. |
| PRSV31 | α(Tr) = [1 + m(1 – Tr0.5)]2 | this model proposed an additional parameter for every pure substance and can yield a good agreement with equilibrium data. | |
| m = k0 + k1(1 +Tr0.5)(0.7 – Tr)b For | |||
| k0 = 0.378893 + 1.4897153 ω – 0.17131848 ω2 + 0.0196544 ω3 | |||
| TST32 |  |
α(Tr) = α(0) (Tr) + ω(α(1)(Tr) – α(0)(Tr)) | the PVT relation of Twu–Sim–Tassone (TST) was slightly different from PR or SRK. This EoS has been found to have better prediction of vapor pressure as well as liquid densities from the triple point to the critical point. |
| α(i) (Tr) = TrN(i)(M(i) – 1)eL(i)(1 – TrN(i)(M(i))c |
Predictive SRK (PSRK)
Predictive SRK19 is a kind of an EoS-GE model. The PSRK model’s mixing rule for the attractive term is expressed by embedding a UNIFAC activity coefficient model; thus, there is no need to have knowledge of expressions of α-functions as the traditional CEoSs. The attractive term can be expressed as follows:
| 1 |
where A1 = −0.64663 and
| 2 |
where γi is the activity coefficient for component i, and it can be calculated from UNIFAC group contribution models.
Eventually, the mixing rules for PSRK can be expressed as
| 3 |
| 4 |
GERG-2008
Based on the multifluid mixture model, GERG-200822 can be used with high accuracy over a very wide range of pressures and temperatures. GERG-2008 is explicit in the Helmholtz free energy as a function of density ρ, temperature T, and mole composition x. The dimensionless reduced form of this model is as follows:
| 5 |
where δ is the reduced mixture density and τ is the inverse reduced mixture temperature according to
| 6 |
| 7 |
The term α0(ρ,τ,x̅) of eq 5 is the dimensionless form of the Helmholtz free energy for the ideal-gas mixture, which is defined by the following equations:
| 8 |
The term α0ir(δ,τ) in eq 5 is the residual part of the reduced Helmholtz free energy contributed by pure substances in the real mixture.
The term Δαr(δ,τ,x̅) of eq 5 is the departure function that depends on the reduced mixture variables δ and τ.
The following mixing rules are adopted in GERG-2008 to model the thermodynamic properties of mixtures:
 |
9 |
| 10 |
In the equations above, βv,ij, γv,ij, βT,ij, and γT,ij are the binary parameters fitting to experimental data, and ρc,i and Tc,i are the critical parameters for pure substances. All of these parameters and more detailed information of this model can be found in reference (22).
PC-SAFT
The perturbed-chain statistical associating fluid theory (PC-SAFT) EoS, developed from the SAFT EoS,27 has shown great performance in hydrocarbon modeling according to recent research works. This EoS gives the expression of the reduced Helmholtz free energy as follows:
| 11 |
where αid is the ideal-gas contribution, αhc is the contribution of the hard-sphere chain reference system, αdisp is the dispersion contribution arising from the square well attractive potential, and αassoc is the association contribution.
For systems containing nonassociating components, the last term in eq 11 is equal to zero. In addition, there are just three model parameters for a nonassociating component, the chain length m, the segment diameter s, and the segment energy ε. For these parameters and more detailed information about this model, see reference (26).
Results and Discussion
In this paper, 25 SNGs and 13 RGs are collected from other published works.
The composition of SNGs is relatively simple. They mainly comprise n-alkane from methane to n-octane as well as nitrogen and carbon dioxide. SNG1–SNG5 are collected from reference (9), SNG6–SNG11 are collected from reference (10), SNG12–16 from reference (4), SNG17–SNG20 from reference (5), SNG21–SNG23 from reference (7), and SNG24 and SNG25 from reference (11).
The real gases contain all of the components in SNGs as well as hydrogen, oxygen, benzene, cyclohexane, and n-alkane up to C12. RG1–RG6 are collected from reference (1), RG7–RG12 are collected from reference (8), and RG13 from reference (11).
The constitution and composition of all of these gases are listed in Tables S1–S4 of the Supporting Information of this paper.
Experimental Results
The SNG26–SNG28 and RG14 are natural gases contributed by this work. The compositions of these four gases are presented in Table 2, and dew point test results are listed in Table 3.
Table 2. Components and Compositions of Synthetic and Real Natural Gas Mixtures in This Work.
| component | SNG26 | SNG27 | SNG28 | RG14 |
|---|---|---|---|---|
| He | 0.0109 | |||
| H2 | 0.0148 | |||
| N2 | 0.5096 | 0.7056 | 0.7772 | 0.8611 |
| CO2 | 0.1500 | 0.2940 | 0.0549 | 0.0541 |
| C1 | 92.9111 | 85.5114 | 89.7150 | 90.7842 |
| C2H6 | 4.8700 | 8.8100 | 6.1800 | 6.4497 |
| C3H8 | 0.9350 | 2.9400 | 1.9100 | 1.0973 |
| i-C4 | 0.2410 | 0.6060 | 0.3480 | 0.1642 |
| n-C4 | 0.1490 | 0.5820 | 0.4280 | 0.2053 |
| neoC5 | 0.0071 | 0.0060 | 0.0089 | 0.0042 |
| i-C5 | 0.0814 | 0.2210 | 0.1440 | 0.0710 |
| n-C5 | 0.0308 | 0.1120 | 0.1330 | 0.0675 |
| n-C6 | 0.1150 | 0.2120 | 0.3010 | 0.0756 |
| benzene | 0.0234 | |||
| cyclohexane | 0.0119 | |||
| n-C7 | 0.0450 | |||
| methylcyclohexane | 0.0256 | |||
| toluene | 0.0087 | |||
| n-C8 | 0.0190 | |||
| n-C9 | 0.0059 | |||
| n-C10 | 0.0006 | |||
| n-C11 | 0.0000 | |||
| n-C12 | 0.0000 |
Table 3. Hydrocarbon Dew Point Test Results for Three SNGs and One RG.
| SNG26 |
SNG27 |
SNG28 |
RG14 |
||||
|---|---|---|---|---|---|---|---|
| P/MPa | T/°C | P/MPa | T/°C | P/MPa | T/°C | P/MPa | T/°C |
| 8.01 | –26.0 | 9.15 | –13.2 | 9.20 | –34.7 | 8.50 | 2.5 |
| 7.71 | –26.2 | 9.05 | –10.1 | 9.38 | –28.8 | 7.50 | 7.0 |
| 7.40 | –23.8 | 8.95 | –8.2 | 9.47 | –11.4 | 6.60 | 10.5 |
| 7.12 | –21.3 | 8.85 | –7.7 | 9.34 | –10.4 | 5.56 | 14.6 |
| 6.81 | –18.8 | 8.76 | –7.1 | 9.23 | –9.3 | 4.55 | 15.5 |
| 6.50 | –18.0 | 8.64 | –6.5 | 9.10 | –8.3 | 4.02 | 15.6 |
| 6.21 | –17.4 | 8.51 | –5.5 | 9.00 | –7.9 | 3.57 | 15.0 |
| 5.85 | –17.0 | 8.37 | –3.2 | 8.82 | –7.4 | 3.05 | 14.8 |
| 5.55 | –16.6 | 8.25 | –2.2 | 8.58 | –5.8 | 1.90 | 12.2 |
| 5.22 | –16.4 | 7.95 | –0.8 | 8.26 | –4.2 | 1.20 | 7.8 |
| 4.88 | –16.3 | 7.65 | –0.2 | 7.90 | –2.5 | 0.60 | –0.6 |
| 4.58 | –16.3 | 7.35 | 0.4 | 7.60 | –1.0 | ||
| 4.20 | –16.5 | 7.05 | 1.0 | 7.38 | –0.3 | ||
| 3.85 | –16.7 | 6.76 | 2.1 | 7.08 | 0.0 | ||
| 3.50 | –16.9 | 6.40 | 2.3 | 6.76 | 0.5 | ||
| 3.18 | –17.1 | 6.10 | 2.5 | 6.45 | 1.4 | ||
| 2.91 | –17.5 | 5.80 | 2.6 | 6.15 | 2.0 | ||
| 2.60 | –17.8 | 5.50 | 3.0 | 5.85 | 2.3 | ||
| 2.25 | –18.7 | 5.20 | 3.1 | 5.50 | 2.8 | ||
| 1.90 | –21.2 | 5.00 | 3.1 | 5.18 | 3.5 | ||
| 1.40 | –24.6 | 4.70 | 3.0 | 4.88 | 3.8 | ||
| 0.90 | –28.8 | 4.40 | 2.8 | 4.58 | 4.0 | ||
| 0.40 | –38.2 | 4.10 | 2.5 | 4.26 | 4.8 | ||
| 3.80 | 2.2 | 3.94 | 5.0 | ||||
| 3.50 | 1.6 | 3.65 | 4.7 | ||||
| 3.18 | 1.2 | 3.35 | 3.5 | ||||
| 2.88 | 0.4 | 3.05 | 2.4 | ||||
| 2.58 | –0.6 | 2.75 | 1.2 | ||||
| 2.28 | –2.2 | 2.40 | 0.1 | ||||
| 1.98 | –4.0 | 2.10 | –1.2 | ||||
| 1.48 | –8.1 | 1.71 | –3.8 | ||||
| 0.96 | –15.2 | 1.30 | –7.0 | ||||
| 0.44 | –23.6 | 0.92 | –12.2 | ||||
| 0.41 | –23.5 | ||||||
The data of 101 dew points of four natural gases are shown in Table 3. The HCDP test pressure is up to 9.47 MPa, and the dew point temperature ranges from −38.2 to 15.6 °C.
Model Evaluation Results for SNGs
The five cubic models are programmed to predict the HCDP, Aspen software is adopted for PSRK and PC-SAFT calculation, and GERG-2008 calculation is performed by RefProp9.1. The composition analysis of RG14 shows that it contains trace He and H2, the composition values of which are 0.0109 and 0.0148%, respectively. Because the basic properties of these two components are largely different from other components in natural gas, such differences will result in nonconvergence calculation problem. An amount of He and H2 was added into the composition of N2 during dew point calculation to avoid nonconvergence. Surely, the influence of this treatment on the HCDP prediction results can be negligible.
As shown in Table 4, a data set covering 712 dew point data from 28 SNGs was formed to evaluate the eight models. The evaluation results suggest that the GERG-2008 and SRK family models are more accurate in HCDP prediction than the other evaluated models. The overall AADs in the full pressure region of GERG-2008, SRK, SRK–Twu, and PSRK are 1.44, 1.83, 2.04, and 2.21 °C, respectively. More detailed information about deviation of every natural gas sample and the number of rejected data points (NRPs) can be also found in Table 4. The reason for different NRPs (Table 4) from one model to another lies in that the values of experimental cricondenbar are higher than the highest predicted value in most of these cases. Models with higher predicted cricondenbar will have a smaller number of NRPs.
Table 4. AAD of the Model Prediction Value Against Experimental Data of SNGs.
| AADb(NRPc) |
||||||||
|---|---|---|---|---|---|---|---|---|
| SNG (NP) | SRK | PR | SRK–Twu | TST | PRSV | GERG-2008 | PSRK | PC-SAFT |
| SNG1(18) | 1.46(2) | 3.06(2) | 1.93(2) | 3.20(3) | 2.76(2) | 0.69(2) | 2.56(2) | 2.07(3) |
| SNG2(18) | 1.19(2) | 2.23(2) | 2.03(1) | 2.76(2) | 2.19(2) | 0.74(2) | 2.66(1) | 1.08(3) |
| SNG3(16) | 0.65(0) | 2.23(0) | 0.98(0) | 2.87(0) | 2.74(0) | 0.43(0) | 1.58(0) | 1.67(0) |
| SNG4(23) | 2.36(0) | 4.49(0) | 2.39(0) | 4.96(0) | 4.23(0) | 2.13(1) | 3.12(0) | 3.09(1) |
| SNG5(20) | 1.08(0) | 2.81(0) | 1.09(0) | 3.56(0) | 3.45(0) | 0.71(1) | 1.69(0) | 2.29(0) |
| SNG6(20) | 2.58(0) | 1.62(0) | 3.35(0) | 1.71(0) | 1.61(0) | -d | 2.40(0) | 2.80(0) |
| SNG7(13) | 3.61(0) | 2.18(1) | 4.83(0) | 2.36(0) | 2.90(0) | -d | 2.76(0) | 3.19(1) |
| SNG8(18) | 2.98(1) | 1.35(1) | 3.23(1) | 1.48(1) | 1.64(1) | 2.63(1) | 2.72(1) | 2.70(1) |
| SNG9(25) | 2.55(3) | 2.32(4) | 2.71(1) | 2.62(3) | 2.55(3) | -d | 2.57(2) | 4.86(3) |
| SNG10(28) | 4.7(2) | 3.82(3) | 5.22(0) | 4.37(2) | 4.26(2) | -d | 4.64(1) | 6.08(3) |
| SNG11(26) | 2.65(3) | 1.99(5) | 2.38(2) | 2.16(5) | 2.20(4) | 2.46(3) | 2.30(2) | 3.90(3) |
| SNG12(18) | 1.35(0) | 1.90(3) | 1.18(0) | 0.79(2) | 1.34(0) | 1.43(0) | 1.41(0) | 0.74(1) |
| SNG13(17) | 1.59(3) | 2.64(4) | 1.92(4) | 2.43(4) | 1.93(4) | 2.07(3) | 2.07(4) | 1.35(4) |
| SNG14(17) | 1.43(0) | 1.97(2) | 1.14(0) | 0.85(0) | 1.19(0) | 1.50(0) | 1.51(0) | 0.85(0) |
| SNG15(18) | 1.03(0) | 3.15(0) | 0.79(0) | 2.99(0) | 1.70(0) | 0.74(0) | 1.05(0) | 1.39(0) |
| SNG16(27) | 0.76(3) | 3.23(5) | 0.81(1) | 3.15(5) | 1.89(3) | 0.87(3) | 0.85(2) | 1.02(5) |
| SNG17(15) | 1.24(3) | 1.65(3) | 1.40(3) | 1.28(3) | 1.65(3) | 0.90(3) | 2.77(3) | 2.80(3) |
| SNG18(19) | 0.68(2) | 1.70(3) | 1.15(2) | 1.78(3) | 1.62(3) | 1.06(2) | 1.38(2) | 1.95(3) |
| SNG19(22) | 1.02(4) | 2.05(4) | 1.48(4) | 2.27(4) | 2.00(4) | 1.00(4) | 1.73(4) | 0.91(5) |
| SNG20(14) | 0.92(2) | 2.16(3) | 1.20(3) | 1.94(3) | 1.20(3) | 2.41(2) | 2.07(3) | 1.38(2) |
| SNG21(63) | 1.11(0) | 0.68(0) | 0.88(0) | 3.41(0) | 1.26(0) | 0.58(0) | 0.55(0) | 9.41(0) |
| SNG22(47) | 1.99(0) | 2.77(0) | 2.33(0) | 2.45(0) | 2.04(0) | 1.19(0) | 2.60(0) | 2.56(0) |
| SNG23(100) | 1.79(0) | 3.37(3) | 2.04(0) | 4.13(3) | 3.30(0) | 1.54(0) | 2.54(0) | 2.52(2) |
| SNG24(12) | 2.16(1) | 2.15(2) | 2.09(1) | 2.09(2) | 1.78(2) | 2.36(2) | 2.04(1) | 2.10(2) |
| SNG25(8) | 2.35(2) | 5.27(2) | 2.42(2) | 5.60(2) | 3.76(2) | 1.88(2) | 2.58(2) | 2.50(2) |
| SNG26(23) | 2.81(2) | 4.66(3) | 3.03(2) | 4.40(2) | 3.02(2) | 2.17(2) | 3.44(2) | 3.16(2) |
| SNG27(33) | 1.93(0) | 3.41(3) | 1.42(0) | 4.22(2) | 2.23(1) | 1.31(0) | 1.92(0) | 2.75(2) |
| SNG28(34) | 1.41(5) | 3.45(6) | 1.59(3) | 3.79(6) | 1.97(4) | 1.60(2) | 2.23(3) | 2.37(5) |
| Overall(712) | 1.83(40) | 2.65(64) | 2.04(32) | 2.84(57) | 2.30(45) | 1.44(35) | 2.21(35) | 2.63(56) |
NP, number of experimental data points.
AAD, average absolute deviations, °C.
NRP, number of rejected data points.
The GERG-2008 model cannot be adopted because of its limited component list.
The result of AADs for the eight evaluated models in low- and high-pressure regions is presented in Figure 1. What is interesting is that the overall AADs for 28 SNGs are almost doubled in the relatively high-pressure region (P > 6.0 MPa) with respect to the low-pressure region (P < 6.0 MPa) for all models except for GERG-2008. The deviations of these models in the low-pressure region are all lower than 2.00 °C, while they are above 3.00 °C or even above 5.00 °C in the high-pressure region. The overall AADs of SRK and its variations in the high-pressure region are around 3.0 °C. PR, TST, PRSV, and PC-SAFT have bigger AADs, larger than 4.5 °C. With the AAD of 2.10 °C, the GERG-2008 matches the experimental data in the high-pressure region much better than the other evaluation models.
Figure 1.
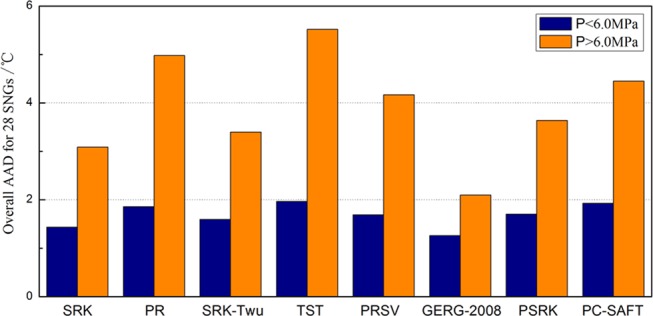
AADs between experimental and model prediction values for different pressure regions of SNGs.
Through comparison between the predicted phase envelop curves and experimental data, as illustrated in Figure 2, we can also easily find that the deviation in the high-pressure region is more significant. It can be easily inferred that the prediction results of GERG-2008 fit the experimental data of all SNGs quite well except for one case from reference (9) (SNG4) and one case (SNG26) in this work. The comparison of these two cases has been intentionally illustrated in the top area of Figure 3. For such two cases, the deviations of GERG-2008 in the high-pressure region are around 5.0 °C, while PR exceeds 10.0 °C. However, the overall AADs of SNG4 and SNG26 are just 2.13 and 2.17 °C, respectively, for GERG-2008 and 4.46 and 4.49 °C for PR, as presented in Table 4. From this point of view, taking AAD over the full pressure range as the major index to evaluate the performance of models and further give model adoption recommendations, as most previous studies did, may lead to misestimation of the model error when predicting the HCDP in the high-pressure region.
Figure 2.

Predicted phase curves for SNGs with SRK, PR, PSRK, PC-SAFT, and GERG-2008 compared to the experimental data.
Figure 3.

AADs between experimental and model prediction values for different pressure regions of RGs.
In short, GERG-2008 has the best performance in HCDP prediction for SNGs, in both low- and high-pressure regions. However, this model can be used just within a limited 21 components currently,22 which restricts its applications.
Model Evaluation Results for Real Gases (RGs)
The data set of RG includes the data of 334 dew points from 14 RGs. The maximum pressure and temperature of these experimental data exceed 10.9 MPa and 30.0 °C, respectively.
RGs in this work contain components not listed in GERG-2008′s 21 components list,22 such as benzene, toluene, cyclohexane, and methylcylcohexane, which have a significant influence on HCDP prediction results indicated by ISO 23874. Thus, the performance of GERG-2008 is not evaluated for RGs.
In general, the overall AADs for RGs are larger than for SNGs. As presented in Table 5, the overall AADs of the SRK family models for RGs are around 2.50 °C and about 3.50 °C for the other four models. Both of the values are larger than the AADs for SNG. In addition, SRK–Twu and PSRK have the least NRPs, which are 13 and 19, respectively.
Table 5. AAD of the Model Prediction Value against the Experimental Data of RGs.
| AADb (NRPc) |
|||||||
|---|---|---|---|---|---|---|---|
| RG (NP) | SRK | PR | SRK–Twu | TST | PRSV | PSRK | PC-SAFT |
| RG1(23) | 3.44(2) | 4.05(4) | 1.95(0) | 4.66(3) | 3.94(3) | 3.23(1) | 4.75(3) |
| RG2(15) | 3.35(4) | 3.63(5) | 2.83(1) | 3.29(5) | 3.65(4) | 2.78(1) | 4.01(5) |
| RG3(18) | 1.02(5) | 4.90(6) | 1.15(2) | 4.23(6) | 2.68(6) | 1.36(4) | 2.73(6) |
| RG4(12) | 2.79(3) | 3.11(4) | 1.72(1) | 2.73(4) | 3.24(3) | 2.90(1) | 3.11(4) |
| RG5(25) | 3.47(12) | 2.91(14) | 2.43(5) | 2.89(14) | 4.19(12) | 3.52(5) | 4.27(14) |
| RG6(26) | 3.05(10) | 2.88(12) | 2.24(4) | 2.78(12) | 2.60(10) | 2.73(7) | 3.52(12) |
| RG7(41) | 3.63(0) | 5.98(0) | 3.86(0) | 5.27(0) | 4.20(0) | 3.43(0) | 2.96(0) |
| RG8(40) | 3.64(0) | 6.28(0) | 3.81(0) | 5.81(0) | 4.41(0) | 3.62(0) | 3.21(0) |
| RG9(29) | 3.76(0) | 6.29(0) | 3.90(0) | 5.13(0) | 4.23(0) | 2.58(0) | 1.83(0) |
| RG10(27) | 0.62(0) | 2.02(0) | 0.56(0) | 0.92(0) | 0.41(0) | 1.06(0) | 2.05(0) |
| RG11(30) | 1.01(0) | 1.69(0) | 0.84(0) | 1.04(0) | 0.58(0) | 1.51(0) | 2.26(0) |
| RG12(30) | 3.59(0) | 5.79(0) | 3.81(0) | 4.90(0) | 4.08(0) | 3.17(0) | 2.10(0) |
| RG13(7) | 6.32(0) | 3.76(1) | 3.76(0) | 3.77(1) | 4.76(1) | 3.20(0) | 4.33(1) |
| RG14(11) | 2.12(0) | 1.58(0) | 2.18(0) | 1.80(0) | 1.69(0) | 1.10(0) | 1.64(0) |
| Overall(334) | 2.99(36) | 3.92(46) | 2.50(13) | 3.52(45) | 3.19(39) | 2.58(19) | 3.05(45) |
NP, number of experimental data points.
AAD, average absolute deviations, °C.
NRP, number of rejected data points.
As can be seen from Figure 3, the AAD difference in high- and low-pressure regions for RGs is less notable than that of SNGs. The SRK family models have comparable accuracy (the AAD is around 3.0 °C) in high- and low-pressure regions. AADs for SRK and SRK–Twu in the low-pressure region are even slightly larger than those in the high-pressure region. In addition, the margin of difference between AADs in high- and low-pressure regions for RGs is smaller than that for SNGs according to calculation results of PR, TST, PRSV, and PC-SAFT.
Because of high concentrations of heavy hydrocarbons in RGs and the inherent difficulties to comprehensively analyze the composition of RGs, there is no single model that can perform the best in both high- and low-pressure regions as GERG-2008 does for SNGs. For RGs, among all of these seven models, PSRK has the lowest AAD in the low-pressure region, which is 2.52 °C, and SRK–Twu has the lowest AAD in the high-pressure region, which is 2.01 °C. The best performance of PSRK in the low-pressure region may lie in the incorporated UNIFAC activity coefficient model, coefficients of which are usually obtained from low-pressure equilibrium experimental data. In addition, due to the linear function modification of the α function, SRK–Twu can provide accurate prediction results in the high-pressure region for RGs as it was claimed.
The comparison between the predicted phase envelop curves and experimental data of four RGs is illustrated in Figure 4, through which good consistency with experimental data in the low-pressure region of PSRK and the high-pressure region of SRK–Twu can be observed.
Figure 4.

Predicted phase curves for RGs with SRK, PR, PSRK, PC-SAFT, and SRK–Twu with comparison of experimental data.
Moreover, there are two questions that need to be further studied and discussed. The first is that according to some research works there are some other models, such as other versions of SAFT with a more precise description of methane33 and UMR-PR10 mentioned in the introduction part, not evaluated in this work, that may also be able to yield accurate results. These models can be evaluated in further study. The second is that the accuracy and reliability of experimental data will have a great influence on the model evaluation results. For example, the average dew point test accuracy in this work is expected to be within 0.5 °C, while the overall AAD difference between GERG-2008 and SRK for SNG26–SNG28 is around 0.48 °C. It is hard to say that the performance of GERG-2008 is much better than SRK in view of that difference. Therefore, obtaining much more accurate and reliable measurement data is a priority to find and develop more appropriate models.
Conclusions
Through an improved dew point test system and a rigorous determination procedure, a series of dew point data of three SNGs and one RG have been obtained in this work. The HCDP test pressure is up to 9.47 MPa, and the dew point temperature ranges from −38.2 to 15.6 °C.
Model evaluation work has been carried out based on a set of data, which contains 712 dew points from 28 SNGs and 334 dew points from 14 RGs. For SNGs, the GERG-2008 model has the best performance among the eight evaluated models and shows good agreement with the experimental data (overall: 1.44 °C; low-pressure region: 1.27 °C; high-pressure region: 2.10 °C). PSRK and SRK–Twu fit the experimental data in low-pressure and high-pressure regions best for RGs, respectively (low-pressure region (PSRK): 2.52 °C; high-pressure region (SRK–Twu): 2.01 °C). For natural gas with relatively simpler constituents, GERG-2008 is recommended for HCDP prediction. However, the limited component database of GERG-2008 restricts its application to real gases. When natural gases consist of heavier and more complex components, PSRK and SRK–Twu can be used for low-pressure and high-pressure regions, respectively.
Other models such as SRK, PR, PRSV, TST, and PC-SAFT can also be employed to calculate the dew point of natural gas with relatively poor accuracy. SRK is more precise than the other four models with the least of NRP. The overall ADDs of PC-SAFT for SNGs and RGs are not much different from SRK, but its NRPs are far larger in high-pressure regions. So it is not recommended by this work. Similarly, PR, PRSV, and TST are also not suggested to calculate the HCDP of natural gas in the high-pressure region.
The evaluation results also show that considerable deviations between experimental data and prediction data occur in the high-pressure region. This may be the model problem in the high-pressure region and demonstrates that further evaluation and modification are required to concentrate on the model’s performance in the high-pressure region. In addition, it is must be noted that the model evaluation in this work only focuses on hydrocarbon dew point prediction, so the conclusion and recommendation made herein are just for HCDP prediction rather than calculation of any other properties.
Experimental Apparatus and Materials
In this work, the manual chilled mirror tester with some improvement is adopted to determine HCDP. A sketch of the improved test system is illustrated in Figure 5. The dew point tester, of which the mirror is slowly cooled by the CO2 cooling system, is manufactured by Chandler Engineering. In addition, core improvements of this test system lie in two aspects. The first is that a high-definition camera with 5 megapixels is used to obtain the live image of the chilled mirror. The image displayed on the connected pad is very clear. With this improvement, operators can determine the dew point temperature more easily and precisely. The second improvement is that the NG cylinder and connecting pipelines of the test system are all traced and well insulated before and during the HCDP determination process. The tracing temperature is set to be above 50 °C to prevent the formation of hydrocarbon liquid and to minimize the heavy hydrocarbon adsorption onto the inner surface of the gas container and connecting lines,11 which can ensure the accuracy of the HCDP test value.
Figure 5.

Sketch of the improved dew point test system.
The mirror temperature is measured by a PT-100 thermometer, the precision of which is ±0.1 °C in the region of −100–100 °C. The adopted pressure transducer has a maximum error of 0.1% in the pressure range from 0.1 to 10.0 MPa.
The test method is validated first using the pure propane as the tested sample. The dew point results under five different pressures are listed in Table 6. The average error between the standard value (from the NIST WebBook, https://webbook.nist.gov/chemistry/fluid/) and the test value is expected to be lower than 0.5 °C.
Table 6. HCDP Test Method Validation Results Using Pure Propane.
| pressure | standard value | HCDP
test value/°C |
|||||
|---|---|---|---|---|---|---|---|
| tested sample | MPa | °C | 1st | 2nd | 3rd | average | error/°C |
| pure propane (99.99%) | 0.30 | –14.2 | –14.2 | –14.4 | –14.3 | –14.3 | –0.1 |
| 0.44 | –2.4 | –1.8 | –2.1 | –2.2 | –2.0 | 0.4 | |
| 0.60 | 7.9 | 8.1 | 7.9 | 7.6 | 7.9 | –0.1 | |
| 0.70 | 13.4 | 13.2 | 13.9 | 13.0 | 13.4 | –0.0 | |
| 0.88 | 21.9 | 21.4 | 21.2 | 21.7 | 21.4 | –0.5 | |
SNGs used in this work are all certified reference gases with relative expanded uncertainty (k = 2) less than 2% for each component. For major components such as CH4 and C2H6, the gravimetrical uncertainties are less than 0.1 and 0.3%, respectively. The RG is sampled from a gas field, and a piston cylinder similar to reference (1) is employed to prevent condensation during sampling. However, unlike adopted Ar or N2 as the back-pressure gas usually, the process gas is used instead. In other words, the back-pressure gas is the same as sampled gas, which can avoid the risk of sample containment in the first place and obtain the representative sample.
The dew point test method is in accordance with ISO 6327 gas analysis—determination of the water dew point of natural gas-cooled surface condensation hygrometers. Key controls during the HCDP determination process are as follows: (1) natural gas flow is controlled between 1 and 3 L/min; (2) the temperature decrease rate is controlled to 0.5 °C/min when temperature is approaching the dew point; (3) tests were repeated until the deviation between two measured results is less than 1.0 °C, and the average value was taken as the final dew point temperature.
With the improvements of the measurement system and the control procedures, the overall measurement uncertainty of HCDP temperature can be less than 0.5 °C.
During sampling, HCDP testing, sample transporting, and composition analysis, the electric tracing system also keeps working to reduce the uncertainty of the composition analysis results. The natural gas composition is analyzed by GC Agilent 7890A in a lab, and the analysis method is consistent with ISO6974 and ISO6975.
According to ISO 23874, benzene, toluene, cyclohexane, and methylcyclohexane are also analyzed as individual components for RG in this work.
Acknowledgments
The authors would like to acknowledge the funding of this work by CNPC’s “Measurement and Prediction of Hydrocarbon Dew Point for Natural Gases” program.
Glossary
Abbreviations
- AAD
average absolute deviation
- EoS
equation of state
- GC
gas chromatography
- HCDP
hydrocarbon dew point
- NP
number of experimental data points
- NRP
number of rejected data points
- PC-SAFT
perturbed-chain statistical associating fluid theory
Supporting Information Available
The Supporting Information is available free of charge at https://pubs.acs.org/doi/10.1021/acsomega.9b03469.
Natural gas composition of 28 SNGs (Table S1); natural gas composition of 14 RGs (Table S2); measured hydrocarbon dew point of 25 SNGs from the literature (Table S3); measured hydrocarbon dew point of 13 RGs from the literature (Table S4); binary interaction parameters for SRK, SRK–Twu, and PSRK (Table S5); binary interaction parameters for PR and PRSV (Table S6); binary interaction parameters for TST (Table S7); parameter of the attractive term for PRSV (Table S8); parameters for SRK–Twu, PR–Twu, and TST (Table S9) (PDF)
The authors declare no competing financial interest.
Supplementary Material
References
- Skylogianni E.; Novak N.; Louli V.; Pappa G.; Boukouvalas C.; Skouras S.; Solbraa E.; Voutsas E. Measurement and prediction of dew points of six natural gases. Fluid Phase Equilib. 2016, 424, 8–15. 10.1016/j.fluid.2015.08.025. [DOI] [Google Scholar]
- Blanco S. T.; Avila S.; Velasco I.; Rauzy E.; Otı′n S. Dew points of ternary methane+ethane+butane and quaternary methane+ethane+butane+water mixtures: measurement and correlation. Fluid Phase Equilib. 2000, 171, 233–242. 10.1016/S0378-3812(00)00368-X. [DOI] [Google Scholar]
- Avila S.; Blanco S. A. T.; Velasco I.; Rauzy E.; Otín S. Thermodynamic properties of synthetic natural gases: Part 4. Dew point curves of synthetic natural gases and their mixtures with water: measurement and correlation. Fluid Phase Equilib. 2002, 202, 399–412. 10.1016/S0378-3812(02)00166-8. [DOI] [Google Scholar]
- Avila S.; Blanco S. T.; Velasco I.; Rauzy E.; Otín S. Thermodynamic Properties of Synthetic Natural Gases. 1. Dew-Point Curves of Synthetic Natural Gases and Their Mixtures with Water and Methanol. Measurement and Correlation. Ind. Eng. Chem. Res. 2002, 41, 3714–3721. 10.1021/ie0110282. [DOI] [Google Scholar]
- Avila S.; Blanco S. T.; Velasco I.; Rauzy E.; Otín S. Thermodynamic Properties of Synthetic Natural Gases. 2. Dew Point Curves of Synthetic Natural Gases and Their Mixtures with Water and Methanol. Measurement and Correlation. Energy Fuels 2002, 16, 928–934. 10.1021/ef0102824. [DOI] [Google Scholar]
- Avila S.; Blanco S. T.; Velasco I.; Rauzy E.; Otín S. Thermodynamic Properties of Synthetic Natural Gases. Part 3. Dew Point Curves of Synthetic Natural Gases and Their Mixtures with Water. Measurement and Correlation. Energy Fuels 2003, 17, 338–343. 10.1021/ef020129p. [DOI] [Google Scholar]
- Jarne C.; Avila S.; Blanco S. T.; Rauzy E.; Otín S.; Velasco I. Thermodynamic Properties of Synthetic Natural Gases. 5. Dew Point Curves of Synthetic Natural Gases and Their Mixtures with Water and with Water and Methanol:ation. lation. nd Correlation. Ind. Eng. Chem. Res. 2004, 43, 209–217. 10.1021/ie030121i. [DOI] [Google Scholar]
- Avila S.; Benito A.; Berro C.; Blanco S. T.; Otín S.; Velasco I. Dew-Point Curves of Natural Gas. Measurement and Modeling. Ind. Eng. Chem. Res. 2006, 45, 5179–5184. 10.1021/ie058083l. [DOI] [Google Scholar]
- Mørch Ø.; Nasrifar K.; Bolland O.; Solbraa E.; Fredheim A. O.; Gjertsen L. H. Measurement and modeling of hydrocarbon dew points for five synthetic natural gas mixtures. Fluid Phase Equilib. 2006, 239, 138–145. 10.1016/j.fluid.2005.11.010. [DOI] [Google Scholar]
- Louli V.; Pappa G.; Boukouvalas C.; Skouras S.; Solbraa E.; Christensen K. O.; Voutsas E. Measurement and prediction of dew point curves of natural gas mixtures. Fluid Phase Equilib. 2012, 334, 1–9. 10.1016/j.fluid.2012.07.028. [DOI] [Google Scholar]
- Skylogianni E.Measurements and Modelling of Hydrocarbon Dew Points for Natural Gases. MasterThesis, Norwegian University of Science and Technology, May 2013. [Google Scholar]
- ISO 23874 . Natural gas — Gas Chromatographic Requirements for Hydrocarbon Dewpoint Calculation; The International organization for Standardization, 2006. [Google Scholar]
- Brown A. S.; Milton M. J. T.; Vargha G. M.; Mounce R.; Cowper C. J.; Stokes A. M. V.; Benton A. J.; Lander D. F.; Ridge A.; Laughton A. P.. Comparison of Methods for the Measurement of Hydrocarbon Dew Point of Natural Gas, NPL Report AS 3; National Physical Laboratory: Middlesex, May 2007.
- Brown A. S.; Milton M. J. T.; Vargha G. M.; Mounce R.; Cowper C. J.; Stokes A. M. V.; Benton A. J.; Lander D. F.; Ridge A.; Laughton A. P. Measurement of the Hydrocarbon Dew Point of Real and Synthetic Natural Gas Mixtures by Direct and Indirect Methods. Energy Fuels 2009, 23, 1640–1650. 10.1021/ef8009469. [DOI] [Google Scholar]
- Nasrifar K.; Bolland O.; Moshfeghian M. Predicting Natural Gas Dew Points from 15 Equations of State. Energy Fuel 2005, 19, 561–572. 10.1021/ef0498465. [DOI] [Google Scholar]
- George D. L.Development of Accurate Methods for Predicting Hydrocarbon Dew Points; Technical Report for United States Minerals Management Service Engineering and Research, Southwest Research Institute: San Antonio, May 2007.
- Martinez S. A.; Hall K. R. Thermodynamic properties of light synthetic natural gas mixtures using the RK-PR cubic equation of state. Ind. Eng. Chem. Res. 2006, 45, 3684–3692. 10.1021/ie051241o. [DOI] [Google Scholar]
- Twu C. H.; Coon J. E.; Cunningham J. R. A new generalized alpha function for a cubic equation of state Part 2. Redlich-Kwong equation. Fluid Phase Equilib. 1995, 105, 61–69. 10.1016/0378-3812(94)02602-W. [DOI] [Google Scholar]
- Holderbaum T.; Gmehling J. PSRK: a group contribution equation of state based on UNIFAC. Fluid Phase Equilib. 1991, 70, 251–265. 10.1016/0378-3812(91)85038-V. [DOI] [Google Scholar]
- Louli V.; Boukouvalas C.; Voutsas E.; Magoulas K.; Tassios D. Application of the UMR-PRU model to multicomponent systems: Prediction of the phase behavior of synthetic natural gas and oil systems. Fluid Phase Equilib. 2007, 261, 351–358. 10.1016/j.fluid.2007.07.025. [DOI] [Google Scholar]
- Valiollahi S.; Kavianpour B.; Raeissi S.; Moshfeghian M. A new Peng-Robinson modification to enhance dew point estimations of natural gases. J. Nat. Gas Sci. Eng. 2016, 34, 1137–1147. 10.1016/j.jngse.2016.07.049. [DOI] [Google Scholar]
- Kunz O.; Wagner W. The GERG-2008 Wide-Range Equation of State for Natural Gases and Other Mixtures: An Expansion of GERG-2004. J. Chem. Eng. Data. 2012, 57, 3032–3091. 10.1021/je300655b. [DOI] [Google Scholar]
- Dauber F.; Span R. Achieving higher accuracies for process simulations by implementing the new reference equation for natural gases. Comput. Chem. Eng. 2012, 37, 15–21. 10.1016/j.compchemeng.2011.09.009. [DOI] [Google Scholar]
- Baker C. J.; Hughes T. J.; Graham B. F.; Marsh K. N.; May E. F. Rapid hydrocarbon dew points by infrared spectroscopy: results and validation for binary mixture of methane +{propane, isobutane and butane}. J. Ind. Eng. Chem. 2018, 58, 304–310. 10.1016/j.jiec.2017.09.041. [DOI] [Google Scholar]
- Varzandeh F.; Stenby E. H.; Yan W. Comparison of GERG-2008 and simpler EoS models in calculation of phase equilibrium and physical properties of natural gas related systems. Fluid Phase Equilib. 2017, 434, 21–43. 10.1016/j.fluid.2016.11.016. [DOI] [Google Scholar]
- Gross J.; Sadowski G. Application of the Perturbed-Chain SAFT equation of state to associating systems. Ind. Eng. Chem. Res. 2001, 40, 1244–1260. 10.1021/ie0003887. [DOI] [Google Scholar]
- Chapman W. G.; Gubbins K. E.; Jackson G.; Radosz M. SAFT: Equation-of-state solution model for associating fluids. Fluid Phase Equilib. 1989, 52, 31–38. 10.1016/0378-3812(89)80308-5. [DOI] [Google Scholar]
- Yan W.; Varzandeh F.; Stenby E. H. PVT modeling of reservoir fluids using PC-SAFT EoS and Soave-BWR EoS. Fluid Phase Equilib. 2015, 386, 96–124. 10.1016/j.fluid.2014.11.022. [DOI] [Google Scholar]
- Soave G. Equilibrium constants from a modified Redlich-Kwong equation of state. Chem. Eng. Sci. 1972, 27, 1197–1203. 10.1016/0009-2509(72)80096-4. [DOI] [Google Scholar]
- Peng D. Y.; Robinson D. B. A New Two-Constant Equation of State. Ind. Eng. Chem. Res. 1976, 15, 59–64. 10.1021/i160057a011. [DOI] [Google Scholar]
- Stryjek R.; Vera J. H. PRSV — An improved peng-Robinson equation of state with new mixing rules for strongly nonideal mixtures. Can. J. Chem. Eng. 1986, 64, 334–340. 10.1002/cjce.5450640225. [DOI] [Google Scholar]
- Twu C. H.; Sim W. D.; Tassone V. A versatile liquid activity model for SRK, PR and a new cubic equation-of-state TST. Fluid Phase Equilib. 2002, 194-197, 385–399. 10.1016/S0378-3812(01)00663-X. [DOI] [Google Scholar]
- Kontogeorgis G. M.; Folas G. K.. Thermodynamic Models for Industrial Applications. From Classical and Advanced Mixing Rules to Association Theories; Wiley: New York, 2010. [Google Scholar]
Associated Data
This section collects any data citations, data availability statements, or supplementary materials included in this article.